Daily Technical Analysis by FxGrow

FxGrow Daily Technical Analysis – 08th Aug, 2016
By FxGrow Research & Analysis Team

AUDUSD
AUDUSDM15_zpsxttw6z7d.png


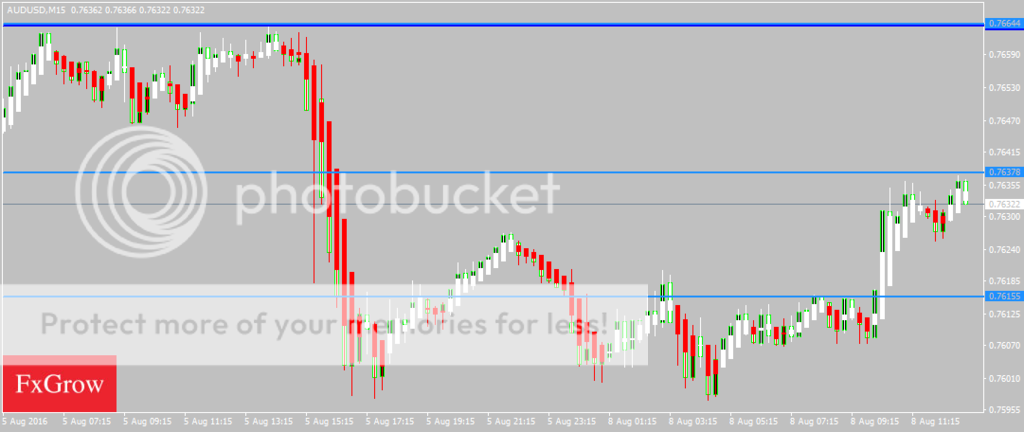
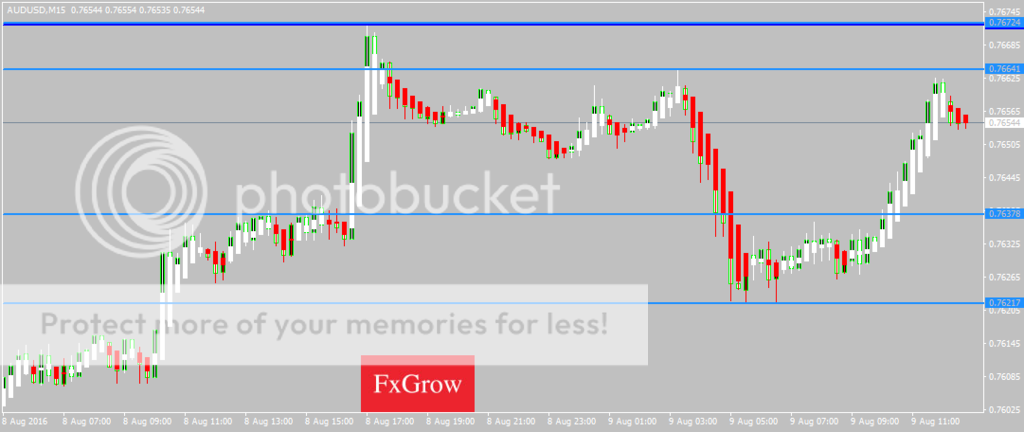
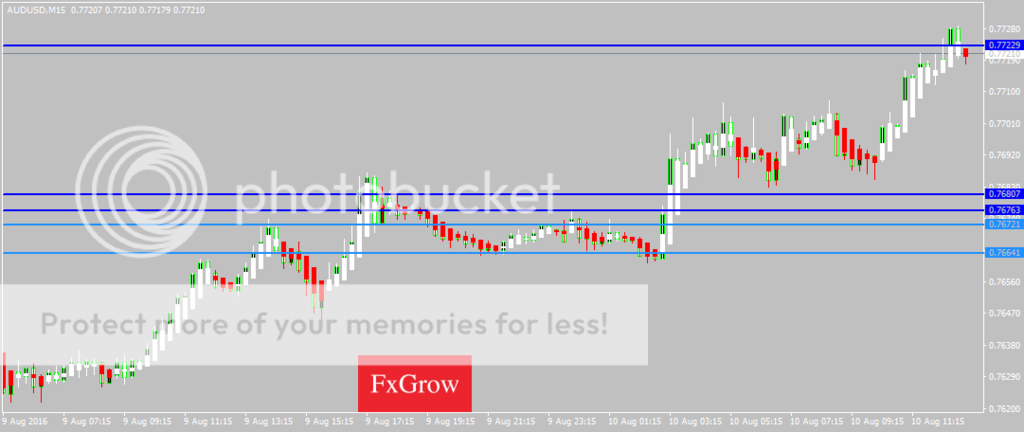
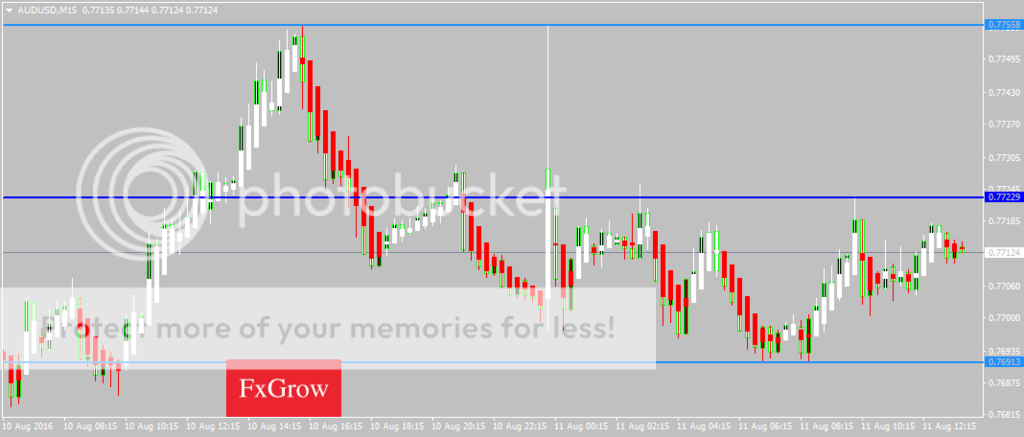
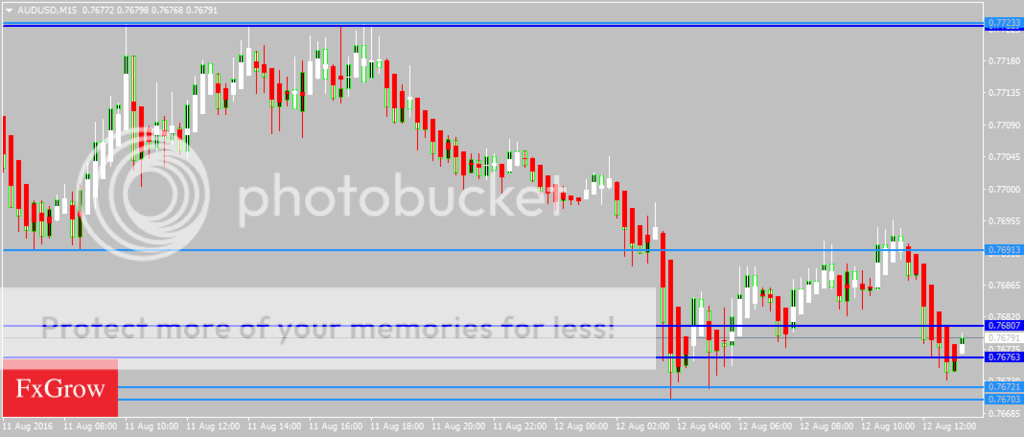
AUDUSD was bullish last week as it touched a high of 0.7663 but came down on Friday below the 0.7600 handle and remained weak towards the end of the trading session. AUDUSD is moving in a bullish tone today and is now trading above its 100day SMA of 0.7612 in the European trading session. The near term bias is Neutral to Bullish with targets of 0.7700

RSI (14), STOCH (9, 6), Ultimate Oscillator, ROC, MA100 indicate a BUY; MACD (12, 26), ADX (14) are Neutral; STOCHRSI (14) is Overbought; while Average True Range (14) indicates Less Volatility.

Support is at 0.7606 while Resistance is at 0.7637 and 0.7664

08th Aug 2016 – 10:20AM (UTC)

USDJPY
USDJPYM15_zpsbhwkczbp.png


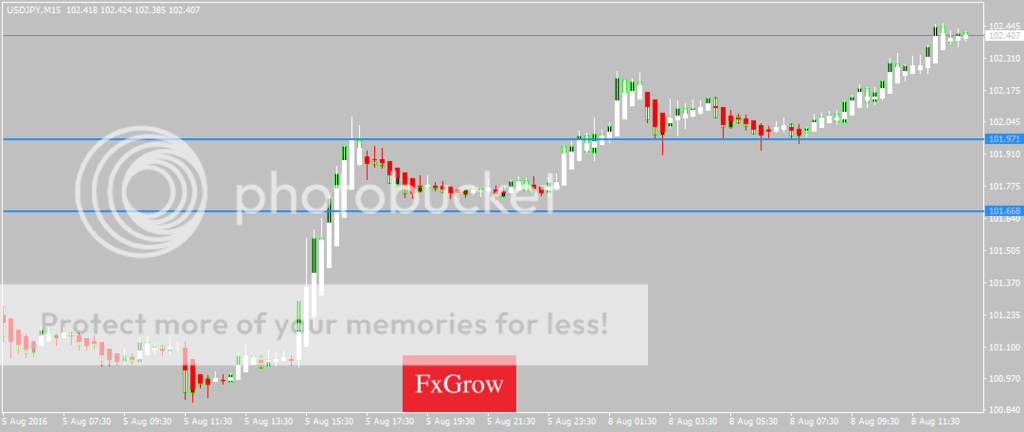
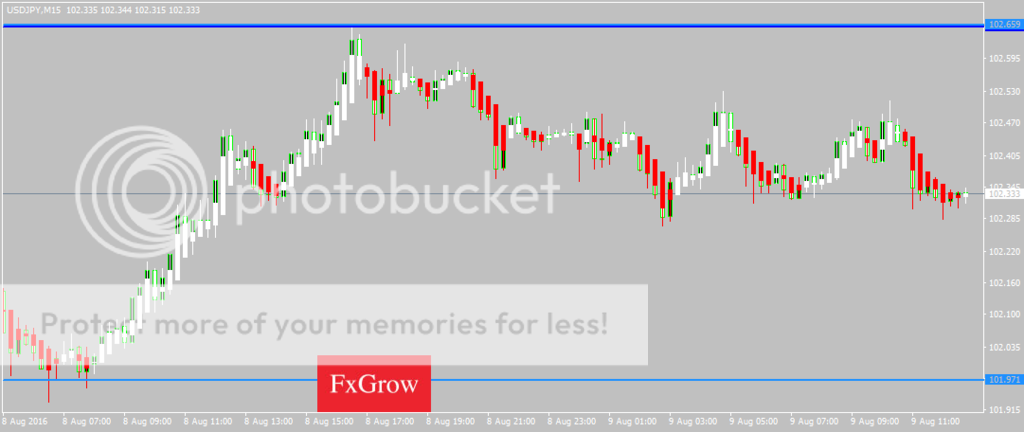
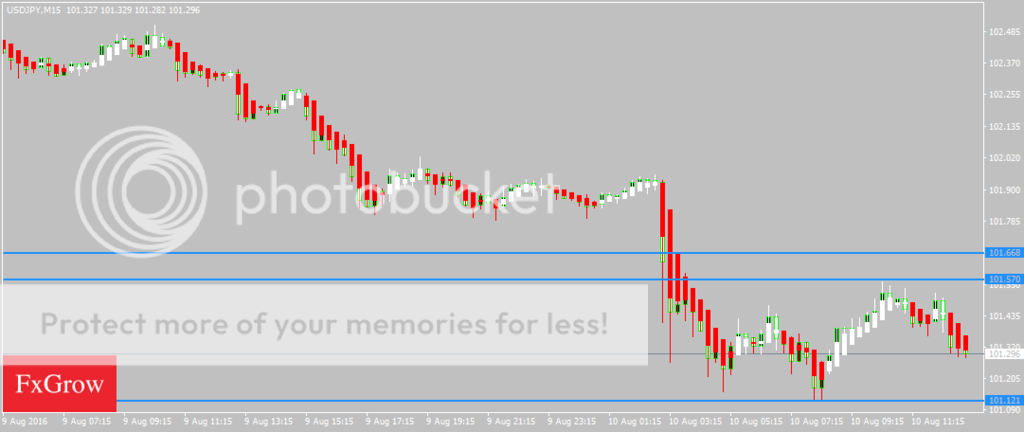
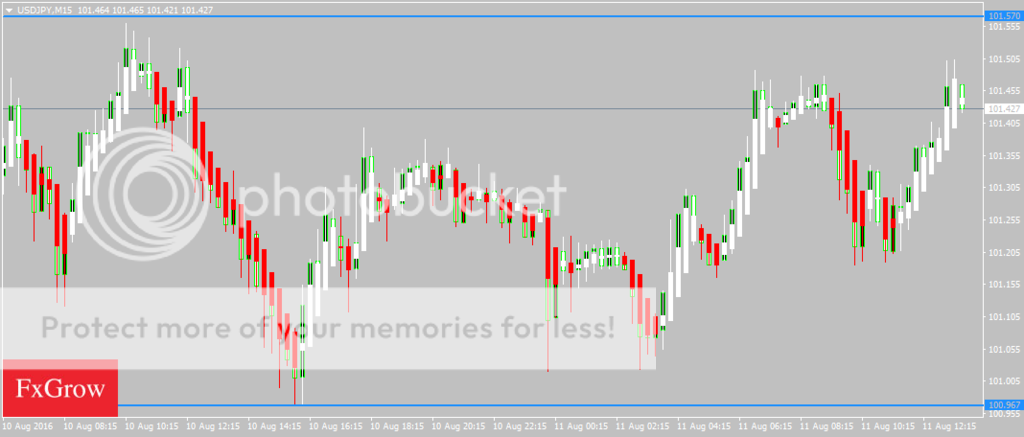
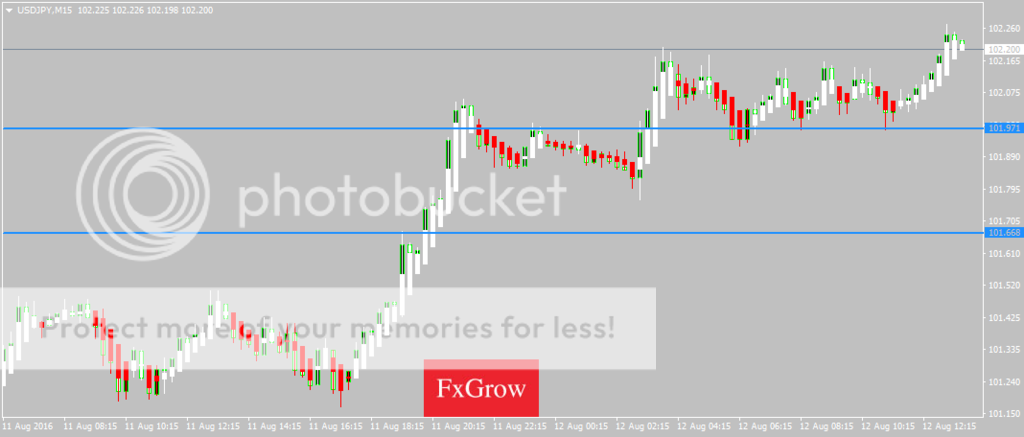
USDJPY was indecisive last week as it touched a high of 102.82 and a low of 100.67 and recovered on Friday closing above the 101.50 handle towards the end of the trading session. Dollar-Yen is moving in a mild bullish tone today and is now trading above its 100day SMA of 101.38 in the European trading session. The near term bias is Bullish with targets of 103

RSI (14), STOCH (9, 6), STOCHRSI (14), MACD (12, 26), ADX (14), CCI (14), ROC, MA100 indicate a BUY; Ultimate Oscillator is Overbought; while Average True Range (14) indicates Less Volatility.

Support is at 102.16 while Resistance is at 102.58 and 102.70

08th Aug 2016 – 10:28AM (UTC)

For more in depth Research & Analysis please visit FxGrow.http://fxgrow.com/analysis-educatio...alysis-fxgrow-free-forex-analysis-tools#close

Note: This analysis is intended to provide general information and does not constitute the provision of INVESTMENT ADVICE. Investors should, before acting on this information, consider the appropriateness of this information having regard to their personal objectives, financial situation or needs. We recommend investors obtain investment advice specific to their situation before making any financial investment decision.
 
FxGrow Daily Technical Analysis – 09th Aug, 2016
By FxGrow Research & Analysis Team

EURUSD
EURUSDM15_zpswkgcr8xd.png


EURUSD was indecisive yesterday as it touched a high of 1.1104 and a low of 1.1072 remaining weak towards the end of the trading session. Euro is moving in a mild bullish tone today and is now trading below its 100day SMA of 1.1120 in the European trading session. The near term bias is Neutral to Bullish with targets of 1.1135

RSI (14), STOCH (9, 6), ADX (14) are Neutral; Ultimate Oscillator, ROC indicate a BUY; STOCHRSI (14) is Overbought; while Average True Range (14) indicates Less Volatility.

Support is at 1.1072 while Resistance is at 1.1098 and 1.1122

09th Aug 2016 – 09:47AM (UTC)

GBPUSD
GBPUSDM15_zpsf1d2k2kq.png


GBPUSD was bearish yesterday as it came down below 1.3050 handle and touched a low of 1.3029 remaining weak towards the end of the trading session. Cable is moving in a bearish phase today and is now trading below its 100day SMA of 1.3147 in the European trading session. The near term bias is Bearish with targets of 1.2925

RSI (14), STOCH (9, 6), MACD (12, 26), ADX (14), CCI (14), ROC indicate a SELL; Ultimate Oscillator is Neutral; while Average True Range (14) indicates High Volatility.

Support is at 1.2966 while Resistance is at 1.3056 and 1.3064

09th Aug 2016 – 09:50AM (UTC)

For more in depth Research & Analysis please visit FxGrow.http://fxgrow.com/analysis-educatio...alysis-fxgrow-free-forex-analysis-tools#close

Note: This analysis is intended to provide general information and does not constitute the provision of INVESTMENT ADVICE. Investors should, before acting on this information, consider the appropriateness of this information having regard to their personal objectives, financial situation or needs. We recommend investors obtain investment advice specific to their situation before making any financial investment decision.
 
FxGrow Daily Technical Analysis – 09th Aug, 2016
By FxGrow Research & Analysis Team

AUDUSD
AUDUSDM15_zps9kuv03lr.png


AUDUSD was bullish yesterday as it touched a high of 0.7671 and remained firm towards the end of the trading session. AUDUSD is moving in a bullish tone today after touching an intraday low of 0.7621 and is now trading above its 100day SMA of 0.7624 in the European trading session. The near term bias is Neutral to Bullish with targets of 0.7700

RSI (14), STOCHRSI (14), MACD (12, 26), CCI (14), Ultimate Oscillator, ROC, MA100 indicate a BUY; while Average True Range (14) indicates High Volatility.

Support is at 0.7621 while Resistance is at 0.7664 and 0.7672

09th Aug 2016 – 09:55AM (UTC)

USDJPY
USDJPYM15_zpst0vshbyl.png


USDJPY was bullish yesterday as it crossed the 102.50 handle and remained strong towards the end of the trading session. Dollar-Yen is moving in a zigzag pattern today and is now trading above its 100day SMA of 101.67 in the European trading session. The near term bias is Neutral to Bearish with targets of 102

STOCH (9, 6), CCI (14), Ultimate Oscillator, ROC indicate a SELL; RSI (14), ADX (14) are Neutral; STOCHRSI (14) is Oversold; while Average True Range (14) indicates Less Volatility.

Support is at 101.97 while Resistance is at 102.41 and 102.65

09th Aug 2016 – 10:01AM (UTC)

For more in depth Research & Analysis please visit FxGrow.http://fxgrow.com/analysis-educatio...alysis-fxgrow-free-forex-analysis-tools#close

Note: This analysis is intended to provide general information and does not constitute the provision of INVESTMENT ADVICE. Investors should, before acting on this information, consider the appropriateness of this information having regard to their personal objectives, financial situation or needs. We recommend investors obtain investment advice specific to their situation before making any financial investment decision.
 
FxGrow Daily Technical Analysis – 10th Aug, 2016
By FxGrow Research & Analysis Team

EURUSD
EURUSDM15_zpsbdbh17rw.png


EURUSD was bullish yesterday as it crossed the 1.1100 handle and remained strong towards the end of the trading session. Euro is moving in a bullish momentum today and is now trading above its 100day SMA of 1.1109 in the European trading session. The near term bias is Neutral to Bullish with targets of 1.1250

MACD (12, 26), ADX (14), CCI (14), Ultimate Oscillator, ROC, MA100 indicate a BUY; STOCH (9, 6) is Neutral; RSI (14), STOCHRSI (14) are Overbought; while Average True Range (14) indicates High Volatility.

Support is at 1.1135 while Resistance is at 1.1151 and 1.1180

10th Aug 2016 – 10:04AM (UTC)

GBPUSD
GBPUSDM15_zps6igvk0rl.png


GBPUSD was bearish yesterday as it came down below 1.3000 handle and touched a low of 1.2960 remaining weak towards the end of the trading session. Cable is moving in a bullish tone having touched an intraday high of 1.3089 and is now trading below its 100day SMA of 1.3070 in the European trading session. The near term bias is Neutral to Bullish with targets of 1.3100

RSI (14), STOCHRSI (14), MACD (12, 26), ADX (14), ROC indicate a BUY; CCI (14) is Neutral; while Average True Range (14) indicates Less Volatility.

Support is at 1.3022 while Resistance is at 1.3066 and 1.3088

10th Aug 2016 – 10:10AM (UTC)

For more in depth Research & Analysis please visit FxGrow.http://fxgrow.com/analysis-educatio...alysis-fxgrow-free-forex-analysis-tools#close

Note: This analysis is intended to provide general information and does not constitute the provision of INVESTMENT ADVICE. Investors should, before acting on this information, consider the appropriateness of this information having regard to their personal objectives, financial situation or needs. We recommend investors obtain investment advice specific to their situation before making any financial investment decision.
 
FxGrow Daily Technical Analysis – 10th Aug, 2016
By FxGrow Research & Analysis Team

AUDUSD
AUDUSDM15_zpsxux8fxte.png


AUDUSD was bullish yesterday as it touched a high of 0.7686 and remained firm towards the end of the trading session. AUDUSD is moving in a bullish tone today after touching an intraday high of 0.7727 and is now trading above its 100day SMA of 0.7646 in the European trading session. The near term bias is Bullish with targets of 0.7760

RSI (14), STOCH (9, 6), MACD (12, 26), ADX (14), CCI (14), Ultimate Oscillator, ROC, MA100 indicate a BUY; STOCHRSI (14) is Overbought; while Average True Range (14) indicates High Volatility.

Support is at 0.7664 while Resistance is at 0.7737 and 0.7745

10th Aug 2016 – 10:14AM (UTC)

USDJPY
USDJPYM15_zpsfs2kt0zi.png


USDJPY was bearish yesterday as it came down below 102 handle and remained towards the end of the trading session. Dollar-Yen is moving in a bearish momentum today and is now trading below its 100day SMA of 101.79 in the European trading session. The near term bias is Neutral to Bearish with targets of 100.50

RSI (14), STOCH (9, 6), MACD (12, 26), ADX (14), CCI (14), ROC indicate a SELL; STOCHRSI (14) is Neutral; while Average True Range (14) indicates High Volatility.

Support is at 101.12 while Resistance is at 101.57 and 101.66

10th Aug 2016 – 10:20AM (UTC)

For more in depth Research & Analysis please visit FxGrow.http://fxgrow.com/analysis-educatio...alysis-fxgrow-free-forex-analysis-tools#close

Note: This analysis is intended to provide general information and does not constitute the provision of INVESTMENT ADVICE. Investors should, before acting on this information, consider the appropriateness of this information having regard to their personal objectives, financial situation or needs. We recommend investors obtain investment advice specific to their situation before making any financial investment decision.
 
FxGrow Daily Technical Analysis – 11th Aug, 2016
By FxGrow Research & Analysis Team

EURUSD
EURUSDM15_zpsbgf3ewmu.png


EURUSD was bullish yesterday as it crossed the 1.1150 handle and touched an intraday high of 1.1189 remaining strong towards the end of the trading session. Euro is moving in a bearish tone today and is now trading above its 100day SMA of 1.1118 in the European trading session. The near term bias is Bearish with targets of 1.1100

RSI (14), STOCH (9, 6), ADX (14), CCI (14), Ultimate Oscillator, ROC indicate a SELL; STOCHRSI (14), CCI (14) is Oversold; MACD (12, 26) is Neutral; while Average True Range (14) indicates Less Volatility.

Support is at 1.1136 while Resistance is at 1.1150 and 1.1159

11th Aug 2016 – 10:22AM (UTC)

GBPUSD
GBPUSDM15_zpsnmh2z0fq.png


GBPUSD was bullish yesterday as it crossed the 1.3050 handle and touched a high of 1.3093 but came down below 1.3000 towards the end of the trading session. Cable is moving in a bearish tone and is now trading below its 100day SMA of 1.3036 in the European trading session. The near term bias is Bearish with targets of 1.2900

RSI (14), STOCH (9, 6), MACD (12, 26), ADX (14), CCI (14), Ultimate Oscillator, ROC indicate a SELL; STOCHRSI (14) is Oversold; while Average True Range (14) indicates Less Volatility.

Support is at 1.2935 while Resistance is at 1.3056 and 1.3064

11th Aug 2016 – 10:30AM (UTC)

For more in depth Research & Analysis please visit FxGrow.http://fxgrow.com/analysis-educatio...alysis-fxgrow-free-forex-analysis-tools#close

Note: This analysis is intended to provide general information and does not constitute the provision of INVESTMENT ADVICE. Investors should, before acting on this information, consider the appropriateness of this information having regard to their personal objectives, financial situation or needs. We recommend investors obtain investment advice specific to their situation before making any financial investment decision.
 
FxGrow Daily Technical Analysis – 11th Aug, 2016
By FxGrow Research & Analysis Team

AUDUSD
AUDUSDM15_zps6crxjayn.png


AUDUSD was bullish yesterday as it touched a high of 0.7754 but came down to touch 0.7700 levels towards the end of the trading session. AUDUSD is moving in a zigzag pattern today and is now trading above its 100day SMA of 0.7666 in the European trading session. The near term bias is Neutral to Bullish with targets of 0.7770

MACD (12, 26), ADX (14), CCI (14), Ultimate Oscillator, ROC, MA100 indicate a BUY; RSI (14), STOCH (9, 6) is Neutral; STOCHRSI (14) is Overbought; while Average True Range (14) indicates Less Volatility.

Support is at 0.7691 while Resistance is at 0.7722 and 0.7736

11th Aug 2016 – 10:36AM (UTC)

USDJPY
USDJPYM15_zpsbe4he5fx.png


USDJPY was bearish yesterday as it came down below 101 handle and remained weak towards the end of the trading session. Dollar-Yen is moving in a mild bullish tone today and is now trading below its 100day SMA of 101.81 in the European trading session. The near term bias is Neutral to Bullish with targets of 101.80

STOCH (9, 6), CCI (14), Ultimate Oscillator, ROC indicate a BUY; RSI (14), ADX (14) is Neutral; STOCHRSI (14) is Overbought; while Average True Range (14) indicates Less Volatility.

Support is at 100.96 while Resistance is at 101.44 and 101.57

11th Aug 2016 – 10:42AM (UTC)

For more in depth Research & Analysis please visit FxGrow.http://fxgrow.com/analysis-educatio...alysis-fxgrow-free-forex-analysis-tools#close

Note: This analysis is intended to provide general information and does not constitute the provision of INVESTMENT ADVICE. Investors should, before acting on this information, consider the appropriateness of this information having regard to their personal objectives, financial situation or needs. We recommend investors obtain investment advice specific to their situation before making any financial investment decision.
 
FxGrow Daily Technical Analysis – 11th Aug, 2016
By FxGrow Research & Analysis Team

XAUUSD[Gold]
XAUUSDM15_zpsdi4m7q4e.png


XAUUSD was bullish yesterday as it touched a high of 1356.40 but could not sustain to its bullish moves and came down below 1350 handle towards the end of the trading session. Gold is moving in a consolidation phase today and is now trading below its 100day SMA of 1348.02 in the European trading session. The near term bias is Neutral to Bullish with targets of 1350

RSI (14), CCI (14) is Neutral; STOCH (9, 6), Ultimate Oscillator, ROC, MA100 indicate a BUY; STOCHRSI (14) is Oversold; while Average True Range (14) indicates Less Volatility.

Support is at 1340.18 while Resistance is at 1351.61 and 1352.91

11th Aug 2016 – 10:52AM (UTC)

XAGUSD[Silver]
XAGUSDM15_zpssakyc8r7.png


XAGUSD was bullish yesterday as it touched a high of 20.45 but came down to touch a low of 20.09 towards the end of the trading session. Silver is moving in a mild bullish tone today after touching an intraday low of 20.00 and is now trading above its 100day SMA of 19.96 in the European trading session. The near term bias is Bullish with targets of 20.50

RSI (14), STOCH (9, 6), MACD (12, 26), ADX (14), CCI (14), Ultimate Oscillator, ROC, MA100 indicate a BUY; STOCHRSI (14) is Overbought; while Average True Range (14) indicates Less Volatility.

Support is at 19.95 while Resistance is at 20.33 and 20.48

11th Aug 2016 – 11:00AM (UTC)

USOil.cfd
USOil_zpsuxl7a4ww.png


US Oil was bullish yesterday as it touched a high of 43.37 but came down to touch low of 41.39 towards the end of the trading session. US Oil is moving in a mild bullish tone today after touching an intraday high of 0.7727 and is now trading below its 100day SMA of 42.24 in the European trading session. The near term bias is Neutral to Bullish with targets of 42.40

STOCH (9, 6), ADX (14), CCI (14), Ultimate Oscillator, ROC indicate a BUY; STOCHRSI (14) is Overbought; RSI (14) is Neutral; while Average True Range (14) indicates Less Volatility.

Support is at 41.39 while Resistance is at 42.08 and 42.40

11th Aug 2016 – 11:06AM (UTC)

For more in depth Research & Analysis please visit FxGrow.http://fxgrow.com/analysis-educatio...alysis-fxgrow-free-forex-analysis-tools#close

Note: This analysis is intended to provide general information and does not constitute the provision of INVESTMENT ADVICE. Investors should, before acting on this information, consider the appropriateness of this information having regard to their personal objectives, financial situation or needs. We recommend investors obtain investment advice specific to their situation before making any financial investment decision.
 
FxGrow Daily Technical Analysis – 12th Aug, 2016
By FxGrow Research & Analysis Team

EURUSD
EURUSDM15_zpsa90rrqhx.png


EURUSD was indecisive yesterday as it touched a high of 1.1190 and a low of 1.1136 towards the end of the trading session. Euro is moving in a zigzag pattern today and is now trading above its 100day SMA of 1.1130 in the European trading session. The near term bias is Neutral to Bullish with targets of 1.1200

STOCH (9, 6), ADX (14), CCI (14), Ultimate Oscillator, ROC, MA100 indicate a BUY; RSI (14) is Neutral; STOCHRSI (14) is Overbought; while Average True Range (14) indicates Less Volatility.

Support is at 1.1131 while Resistance is at 1.1159 and 1.1164

12th Aug 2016 – 10:18AM (UTC)

GBPUSD
GBPUSDM15_zpskfrgevbi.png


GBPUSD was bearish yesterday as it touched a low of 1.2935 and remained weak towards the end of the trading session. Cable is moving in a zigzag pattern today and is now trading below its 100day SMA of 1.3006 in the European trading session. The near term bias is Neutral to Bearish with targets of 1.2900

RSI (14), STOCHRSI (14), MACD (12, 26), ADX (14), CCI (14), MA100 indicate a SELL; STOCH (9, 6), ROC is Neutral; while Average True Range (14) indicates Less Volatility.

Support is at 1.2935 while Resistance is at 1.2978 and 1.2991

12th Aug 2016 – 10:25AM (UTC)

For more in depth Research & Analysis please visit FxGrow.http://fxgrow.com/analysis-educatio...alysis-fxgrow-free-forex-analysis-tools#close

Note: This analysis is intended to provide general information and does not constitute the provision of INVESTMENT ADVICE. Investors should, before acting on this information, consider the appropriateness of this information having regard to their personal objectives, financial situation or needs. We recommend investors obtain investment advice specific to their situation before making any financial investment decision.
 
FxGrow Daily Technical Analysis – 12th Aug, 2016
By FxGrow Research & Analysis Team

AUDUSD
AUDUSDM15_zpszkgr58qt.png


AUDUSD was indecisive yesterday as it touched a low of 0.7692 and a high of 0.7723 towards the end of the trading session. AUDUSD is moving in a mild bearish tone and is now trading above its 100day SMA of 0.7683 in the European trading session. The near term bias is Neutral to Bearish with targets of 0.7630

RSI (14), MACD (12, 26), ADX (14), CCI (14), Ultimate Oscillator, ROC, MA100 indicate a SELL; STOCH (9, 6) is Neutral; while Average True Range (14) indicates High Volatility.

Support is at 0.7670 while Resistance is at 0.7691 and 0.7723

12th Aug 2016 – 10:30AM (UTC)

USDJPY
USDJPYM15_zpsnp5namkq.png


USDJPY was bullish yesterday as it crossed 102 handle towards the end of the trading session. Dollar-Yen is moving in a mild bullish tone today and is now trading below its 100day SMA of 101.83 in the European trading session. The near term bias is Neutral to Bullish with targets of 102.60

RSI (14), STOCH (9, 6), STOCHRSI (14), MACD (12, 26), ADX (14), CCI (14), Ultimate Oscillator, ROC indicate a BUY; while Average True Range (14) indicates Less Volatility.

Support is at 101.66 while Resistance is at 102.25 and 102.41

12th Aug 2016 – 10:35AM (UTC)

For more in depth Research & Analysis please visit FxGrow.http://fxgrow.com/analysis-educatio...alysis-fxgrow-free-forex-analysis-tools#close

Note: This analysis is intended to provide general information and does not constitute the provision of INVESTMENT ADVICE. Investors should, before acting on this information, consider the appropriateness of this information having regard to their personal objectives, financial situation or needs. We recommend investors obtain investment advice specific to their situation before making any financial investment decision.
 
Back
Top