BEST INDEX TECHNICAL ANALYSIS BY CAPITAL STREET FX

Tusharcsfx

Recruit
Messages
0

Daily Index Analysis – Wall Street soars, Dow hits 38K, S&P rises, FTSE falls.​


Introduction:

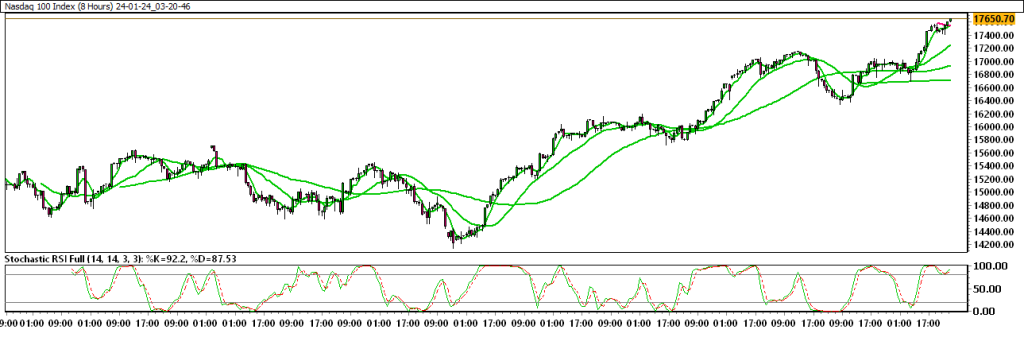
Asian markets respond to Wall Street’s record performance, with gains in Shanghai, Hang Seng, Kospi, and S&P/ASX 200. Meanwhile, European stocks see a modest rise ahead of the ECB meeting. In the U.S., the S&P 500 reaches another all-time high as technology stocks lead the way, while investors eagerly await upcoming corporate reports for insights into this year’s earnings outlook.

Market In Focus For Today – DOW JONES

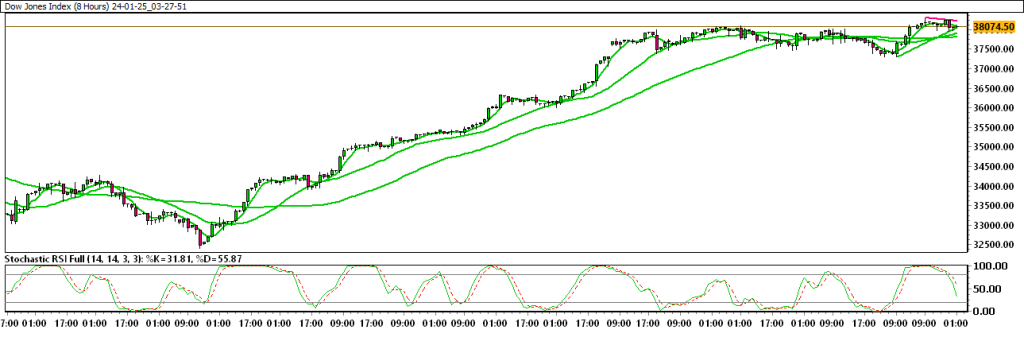
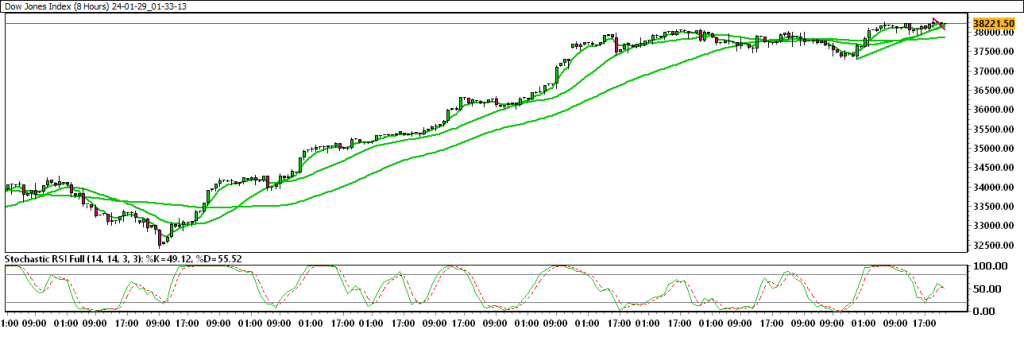
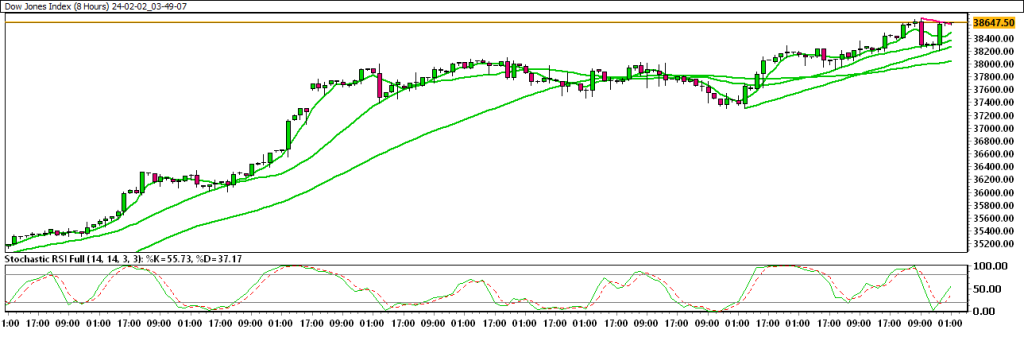
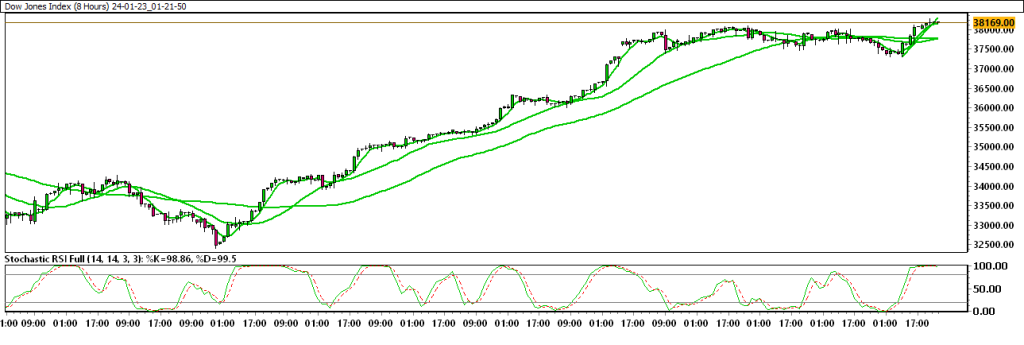
Tuesday morning saw minimal movement in U.S. stock futures following the historic milestone of the Dow Jones surpassing 38,000 for the first time. Dow futures dipped by 17 points, or 0.04% decrease.

TECHNICAL OVERVIEW:

24-01-23_01-21-50_Dow-Jones-Index-1024x345.png

Moving Averages:

Exponential:

  • MA 5: 38127.08 | Positive Crossover | Bullish
  • MA 20: 37767.23 | Positive Crossover | Bullish
  • MA 50: 37784.71 | Positive Crossover | Bullish

Simple:

  • MA 5: 38156.05 | Positive Crossover | Bullish
  • MA 20: 37767.22| Positive Crossover | Bullish
  • MA 50: 37784.34 | Positive Crossover | Bullish
RSI (Relative Strength Index): 66.98| Buy Zone| Bullish

Stochastic Oscillator: 98.95| Buy Zone | Positive

Resistance And Support Levels:

  • R1: 38289.20 | R2: 38670.30
  • S1: 37990.50| S2: 37485.80

Overall Sentiment: Bullish | Market Direction: Buy​

Trade Suggestion: Limit Buy: 37805.10 | Take Profit: 38217.10| Stop Loss: 37557.90.

S&P 500:


READ THE FULL REPORT VISIT US - CAPITAL STREET FX
 

Daily Index Analysis – Nasdaq, S&P 500 bullish, DAX cautious, Euro STOXX defies.​


Introduction:

Global markets witness diverse movements: Asian stocks rise on hopes of a Chinese rescue package, with the Shanghai Composite up 1.80%. European markets show improvement driven by positive Eurozone PMI data. In the U.S., indices display mixed performance as investors await major earnings reports, contributing to the S&P 500 reaching a new record high on Tuesday.

Market In Focus For Today – Nasdaq 100

Nasdaq-100 futures experience an increase following a surge in Netflix subscribers.

TECHNICAL OVERVIEW:

24-01-24_03-20-46_Nasdaq-100-Index-1024x345.png

Moving Averages:

Exponential:

  • MA 5: 17569.54 | Positive Crossover | Bullish
  • MA 20: 17248.83 | Positive Crossover | Bullish
  • MA 50: 16941.36 | Positive Crossover | Bullish

Simple:

  • MA 5: 17553.05 | Positive Crossover | Bullish
  • MA 20: 17248.02| Positive Crossover | Bullish
  • MA 50: 16941.31 | Positive Crossover | Bullish
RSI (Relative Strength Index): 77.07| Buy Zone| Bullish

Stochastic Oscillator: 92.05| Buy Zone | Positive

Resistance And Support Levels:

  • R1: 17664.95 | R2: 18114.72
  • S1: 17154.40| S2: 16643.84

Overall Sentiment: Bullish | Market Direction: Buy​

Trade Suggestion: Limit Buy: 17190.86 | Take Profit: 17664.95| Stop Loss: 16886.96.

S&P 500:

READ THE FULL REPORT VISIT US - CAPITAL STREET FX
 

Daily Index Analysis – Netflix, S&P 500 Records, DAX Surge.​


Introduction:

In the Asian indices market, most shares see gains, particularly in China following recent policy moves. However, European shares decline at the open, awaiting updates from the ECB on rates. Meanwhile, U.S. equities advance, propelled by positive earnings and economic data, leading to a rise in yields. Global markets reflect optimism, with MSCI’s global equity index hitting a near two-year high, fuelled by encouraging developments in Europe, the U.S., and expectations of Chinese stimulus support.

Market In Focus For Today – DOW JONES

The Dow Jones Industrial Average briefly rallied 150 points Wednesday, as Wall Street reacted to Netflix’s (NFLX) earnings report.

TECHNICAL OVERVIEW:

24-01-25_03-27-51_Dow-Jones-Index-1024x345.png

Moving Averages:

Exponential:

  • MA 5: 38089.54 | Negative Crossover | Bearish
  • MA 20: 37908.35 | Positive Crossover | Bullish
  • MA 50: 37809.36 | Positive Crossover | Bullish

Simple:

  • MA 5: 38103.05 | Negative Crossover | Bearish
  • MA 20: 37908.37| Positive Crossover | Bullish
  • MA 50: 37809.31 | Positive Crossover | Bullish
RSI (Relative Strength Index): 57.43| Buy Zone| Bullish

Stochastic Oscillator: 13.31| Sell Zone | Negative

Resistance And Support Levels:

  • R1: 38299.50 | R2: 38795.01
  • S1: 37969.16| S2: 37308.48

Overall Sentiment: Bullish | Market Direction: Buy​

Trade Suggestion: Limit Buy: 37728.91 | Take Profit: 38299.50| Stop Loss: 37308.48.

S&P 500:


READ THE FULL REPORT VISIT US - CAPITAL STREET FX
 

Daily Index Analysis – Nasdaq turbulence, S&P records, FTSE luxury, Euro Stoxx ECB boost.​


Introduction:

In the global indices market, Asian shares predominantly declined despite encouraging U.S. economic growth indicators. European equities displayed mixed performance, influenced by weakening German consumer sentiment. Conversely, Wall Street observed gains fuelled by robust GDP data, highlighting an economy surpassing expectations.

Market In Focus For Today – Nasdaq 100

Nasdaq 100 futures experienced a decline on Friday morning following Intel’s issuance of an outlook that failed to meet Wall Street’s expectations.

TECHNICAL OVERVIEW:

24-01-26_02-11-05_Nasdaq-100-Index-1024x345.png

Moving Averages:

Exponential:

  • MA 5: 17560.54 | Negative Crossover | Bearish
  • MA 20: 17462.35 | Positive Crossover | Bullish
  • MA 50: 17066.36 | Positive Crossover | Bullish

Simple:

  • MA 5: 17587.05 | Negative Crossover | Bearish
  • MA 20: 17462.37| Positive Crossover | Bullish
  • MA 50: 17066.31 | Positive Crossover | Bullish
RSI (Relative Strength Index): 60.58| Buy Zone| Bullish

Stochastic Oscillator: 2.14| Sell Zone | Negative

Resistance And Support Levels:

  • R1: 17791.70 | R2: 18176.39
  • S1: 17443.08| S2: 17058.39

Overall Sentiment: Bullish | Market Direction: Buy​

Trade Suggestion: Limit Buy: 17226.69 | Take Profit: 17719.57| Stop Loss: 16902.11.

S&P 500:

READ THE FULL REPORT VISIT US - CAPITAL STREET FX


Weekly Index Analysis – Nasdaq’s ride, S&P records, trade insights.​


Introduction:

Asian stocks are poised for a weekly gain, with attention focused on the upcoming US inflation test. The Shanghai composite has risen by 0.14%. Across the region, the Singapore MSCI is up 0.76% at 279.55. European equities have reached a two-year peak, driven by positive economic indicators and strong earnings reports. On Wall Street, there is an uptrend fueled by robust GDP data. The strong start to the year for the US stock market faces a significant challenge next week, with a busy schedule featuring major tech earnings, the Federal Reserve’s monetary policy meeting, and the eagerly awaited employment report.

Market In Focus For The Next Week – Nasdaq 100

Nasdaq 100 futures experienced a decline on Friday morning following Intel’s issuance of an outlook that failed to meet Wall Street’s expectations.

TECHNICAL OVERVIEW:

24-01-27_02-30-17_Nasdaq-100-Index-1024x345.png

Moving Averages:

Exponential:

  • MA 5: 17560.54 | Negative Crossover | Bearish
  • MA 20: 17462.35 | Positive Crossover | Bullish
  • MA 50: 17066.36 | Positive Crossover | Bullish

Simple:

  • MA 5: 17587.05 | Negative Crossover | Bearish
  • MA 20: 17462.37| Positive Crossover | Bullish
  • MA 50: 17066.31 | Positive Crossover | Bullish
RSI (Relative Strength Index): 60.58| Buy Zone| Bullish

Stochastic Oscillator: 2.14| Sell Zone |Negative

Resistance And Support Levels:

  • R1: 17791.70 | R2: 18176.39
  • S1: 17443.08| S2: 17058.39

Overall Sentiment: Bullish | Market Direction: Buy​

Trade Suggestion: Limit Buy: 17226.69 | Take Profit: 17719.57| Stop Loss: 16902.11.

S&P 500:

READ THE FULL REPORT VISIT US - CAPITAL STREET FX


Daily Index Analysis – Tech, tensions, and banks unsettle global markets.​


Introduction:

In the global indices landscape, Asian stocks climb with China’s stimulus efforts easing Evergrande concerns. Meanwhile, European markets display a mixed performance amid caution in anticipation of a week filled with significant events. In the U.S., stock futures dip ahead of major tech earnings and the Federal Reserve’s crucial meeting decision, adding uncertainty to Monday’s market outlook.

Market In Focus For Today – Dow Jones

Dow Jones futures decline as Microsoft takes the lead in a substantial wave of tech earnings.

TECHNICAL OVERVIEW:

24-01-29_01-33-13_Dow-Jones-Index-1024x345.png

Moving Averages:

Exponential:

  • MA 5: 38210.94 | Positive Crossover | Bullish
  • MA 20: 38142.35 | Positive Crossover | Bullish
  • MA 50: 37877.36 | Positive Crossover | Bullish

Simple:

  • MA 5: 38229.06 | Negative Crossover | Bearish
  • MA 20: 38142.17| Positive Crossover | Bullish
  • MA 50: 37877.07 | Positive Crossover | Bullish
RSI (Relative Strength Index): 60.86| Buy Zone| Bullish

Stochastic Oscillator: 49.87| Buy Zone | Negative

Resistance And Support Levels:

  • R1: 38383.17 | R2: 38681.85
  • S1: 37967.14| S2: 37572.46

Overall Sentiment: Bullish | Market Direction: Buy​

Trade Suggestion: Limit Buy: 38041.82 | Take Profit: 38383.17| Stop Loss: 37828.47.

S&P 500:

READ THE FULL REPORT VISIT US - CAPITAL STREET FX


Daily Index Analysis – Nasdaq tech clash, FTSE energy surge.​


Introduction:

In the indices market, Asian equities exhibit a mixed performance, with Chinese shares declining ahead of the Federal Reserve rate decision. Meanwhile, European markets show upward movement, but eurozone GDP data signals Germany’s proximity to recession. Stock futures decline as investors brace for major tech company earnings, emphasizing caution ahead of the Federal Reserve policy meeting.

Market In Focus For Today – Nasdaq 100

The primary U.S. stock indices trade with a mixed but mostly lower sentiment in Tuesday’s pre-market session, as investors redirect their attention towards recent corporate earnings and the upcoming Federal Reserve policy meeting.

TECHNICAL OVERVIEW:

24-01-30_03-59-20_Nasdaq-100-Index-1024x345.png

Moving Averages:

Exponential:

  • MA 5: 17656.57 | Positive Crossover | Bullish
  • MA 20: 17580.38 | Positive Crossover | Bullish
  • MA 50: 17223.07 | Positive Crossover | Bullish

Simple:

  • MA 5: 17639.06 | Positive Crossover | Bullish
  • MA 20: 17580.17| Positive Crossover | Bullish
  • MA 50: 17223.07 | Positive Crossover | Bullish
RSI (Relative Strength Index): 65.86| Buy Zone| Bullish

Stochastic Oscillator: 45.87| Buy Zone | Positive

Resistance And Support Levels:

  • R1: 17791.70 | R2: 18131.71
  • S1: 17401.31| S2: 16998.33

Overall Sentiment: Bullish | Market Direction: Buy​

Trade Suggestion: Limit Buy: 17262.79 | Take Profit: 17791.70| Stop Loss: 16947.96.

S&P 500:

READ THE FULL REPORT VISIT US - CAPITAL STREET FX

 
Last edited:

Daily Index Analysis – Dow soars, S&P teeters, FTSE optimistic, DAX fears.​


Introduction:

In the global indices market, Asian markets show a varied performance with disappointing Chinese economic data, while European markets display a mixed trend ahead of the Federal Reserve decision. The US stocks, particularly the Nasdaq, face a subdued atmosphere as investors await corporate earnings and the outcome of the Fed’s monetary policy meeting.

Market In Focus For Today – Dow Jones

Dow Jones advances, propelled by the robust showing of financial stocks.

TECHNICAL OVERVIEW:

24-01-31_02-14-43_Dow-Jones-Index-1024x345.png

Moving Averages:

Exponential:

  • MA 5: 38542.06 | Positive Crossover | Bullish
  • MA 20: 38263.37 | Positive Crossover | Bullish
  • MA 50: 37971.07 | Positive Crossover | Bullish

Simple:

  • MA 5: 38537.01 | Positive Crossover | Bullish
  • MA 20: 38263.17| Positive Crossover | Bullish
  • MA 50: 37972.07 | Positive Crossover | Bullish
RSI (Relative Strength Index): 73.34| Buy Zone| Bullish

Stochastic Oscillator: 100.00| Buy Zone | Neutral

Resistance And Support Levels:

  • R1: 38055.00 | R2: 38682.50
  • S1: 37578.97| S2: 37124.57

Overall Sentiment: Bullish | Market Direction: Buy​

Trade Suggestion: Limit Buy: 37990.09 | Take Profit: 38682.50| Stop Loss: 37557.33.

S&P 500:

READ THE FULL REPORT VISIT US - CAPITAL STREET FX


Daily Index Analysis – Nasdaq revival, S&P drop, FTSE boost, DAX impacted.​


Introduction:

Amidst the global indices landscape, Asian stocks grapple with uncertainty as the Federal Reserve minimizes the possibility of early rate cuts. Shanghai Composite and Singapore MSCI record declines, while Hong Kong’s Hang Seng Index sees an uptick. European stocks dropped ahead of the Fed decision, with Germany’s DAX and France’s CAC 40 facing losses. Wall Street concludes January on a downturn after the Fed maintains interest rates, dispelling hopes for a March rate cut, prompting a decline in U.S. stocks.

Market In Focus For Today – Nasdaq 100

The NASDAQ 100 experienced a slight decline in Wednesday’s trading session but reversed course, displaying signs of revival.

TECHNICAL OVERVIEW:

24-02-01_03-04-20_Nasdaq-100-Index-1024x345.png

Moving Averages:

Exponential:

  • MA 5: 17367.19 | Negative Crossover | Bearish
  • MA 20: 17534.54 | Negative Crossover | Bearish
  • MA 50: 17289.55 | Positive Crossover | Bullish

Simple:

  • MA 5: 17351.12 | Negative Crossover | Bearish
  • MA 20: 17534.54| Negative Crossover | Bearish
  • MA 50: 17289.55 | Positive Crossover | Bullish
RSI (Relative Strength Index): 45.04| Buy Zone| Bullish

Stochastic Oscillator: 8.88| Sell Zone | Positive

Resistance And Support Levels:

  • R1: 17506.01 | R2: 17798.84
  • S1: 17163.18| S2: 16784.64

Overall Sentiment: Bullish | Market Direction: Buy​

Trade Suggestion: Limit Buy: 17191.75 | Take Profit: 17506.01| Stop Loss: 16998.91.

S&P 500:

READ THE FULL REPORT VISIT US - CAPITAL STREET FX


Daily Index Analysis – Dow, S&P resilient, Euro mirrors triumph.​


Introduction:

In the world of indices, Asian shares predominantly climb as Wall Street bounces back, fuelled by the technology sector’s resilience. European stocks experience a surge amid ongoing impressive corporate earnings. Meanwhile, U.S. stocks rebound following the Federal Reserve’s letdown and strong earnings from major tech firms, reversing the prior session’s sell-off.

Market In Focus For Today – Dow Jones

The Dow Jones rises on surprise jobless claims.

TECHNICAL OVERVIEW:

24-02-02_03-49-07_Dow-Jones-Index-1024x345.png

Moving Averages:

Exponential:

  • MA 5: 38557.13 | Positive Crossover | Bullish
  • MA 20: 38369.54 | Positive Crossover | Bullish
  • MA 50: 38045.55 | Positive Crossover | Bullish

Simple:

  • MA 5: 38498.00 | Positive Crossover | Bullish
  • MA 20: 38368.23| Positive Crossover | Bullish
  • MA 50: 38045.55 | Positive Crossover | Bullish
RSI (Relative Strength Index): 64.54| Buy Zone| Bullish

Stochastic Oscillator: 55.66| Buy Zone | Positive

Resistance And Support Levels:

  • R1: 38717.50 | R2: 39266.49
  • S1: 38052.05| S2: 37369.97

Overall Sentiment: Bullish | Market Direction: Buy​

Trade Suggestion: Limit Buy: 38235.05 | Take Profit: 38717.50| Stop Loss: 37885.69.

S&P 500:

READ THE FULL REPORT VISIT US - CAPITAL STREET FX

 
Back
Top