Tusharcsfx
Recruit
- Messages
- 0
Weekly Crypto Analysis – Bitcoin up, Ethereum down, Dogecoin active, Chainlink rising.
Introduction
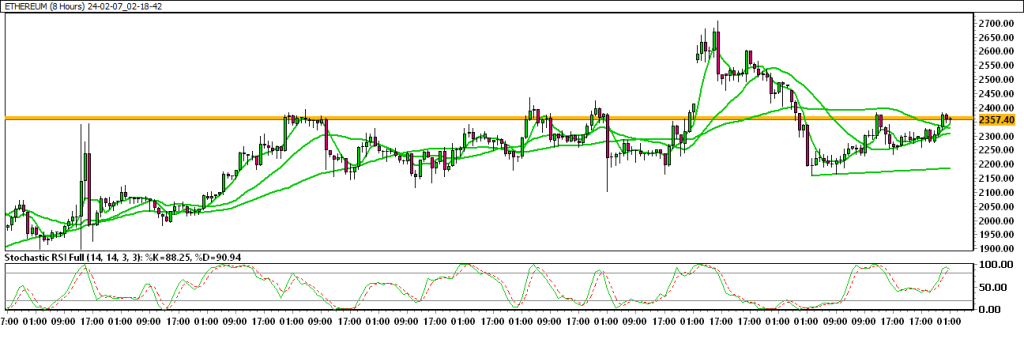
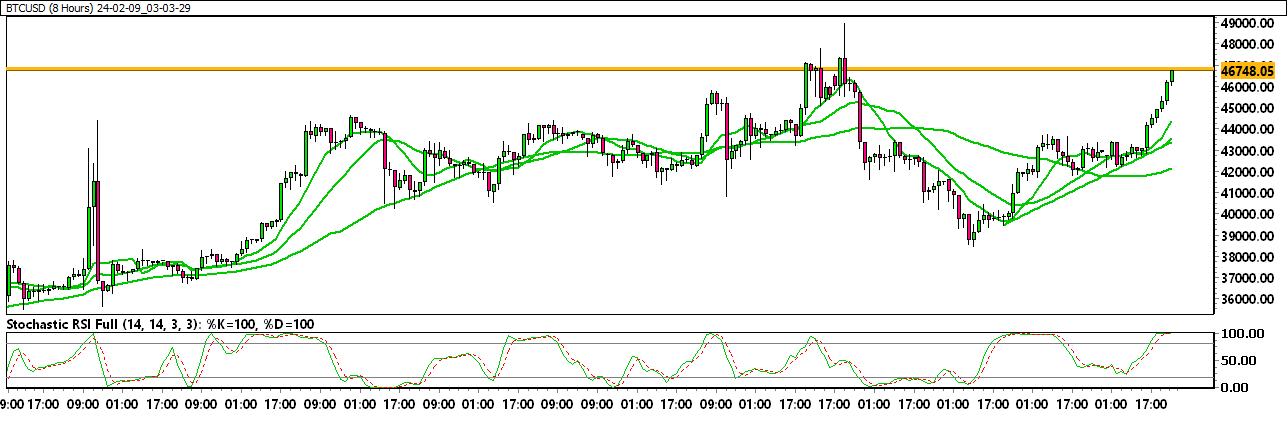
Bitcoin’s resurgence to $43,000 signals a recovery after a week-long dip, with on-chain metrics hinting at a potential rally. Declines in profit-taking by BTC whales provide room for extended gains. Meanwhile, Ethereum erases recent gains, facing a significant bearish signal. Dogecoin sees a marginal uplift despite increased network activity, and Chainlink, an outlier in the volatile altcoin market, faces a potential 20% correction. The crypto landscape remains dynamic, with on-chain indicators influencing asset trajectories.Markets In Focus Today – BITCOIN
Bitcoin Price Recovers As On-Chain Metrics Point To A Potential BTC Rally.
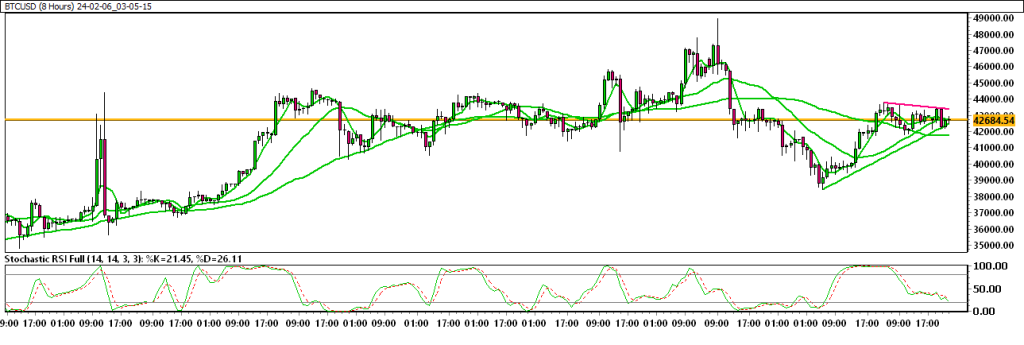
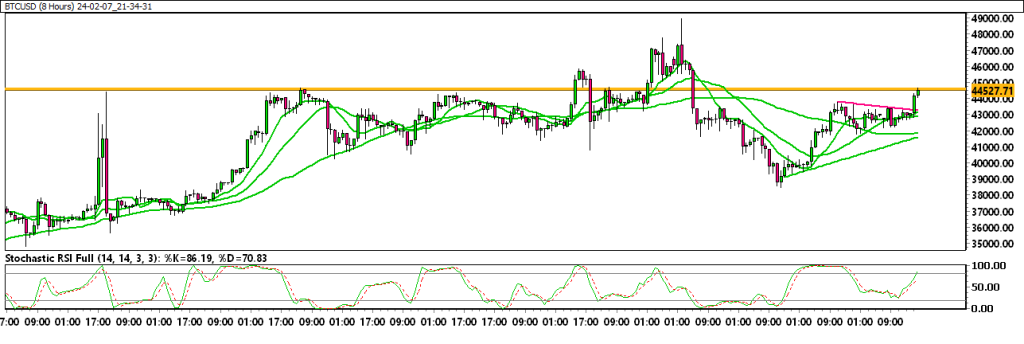
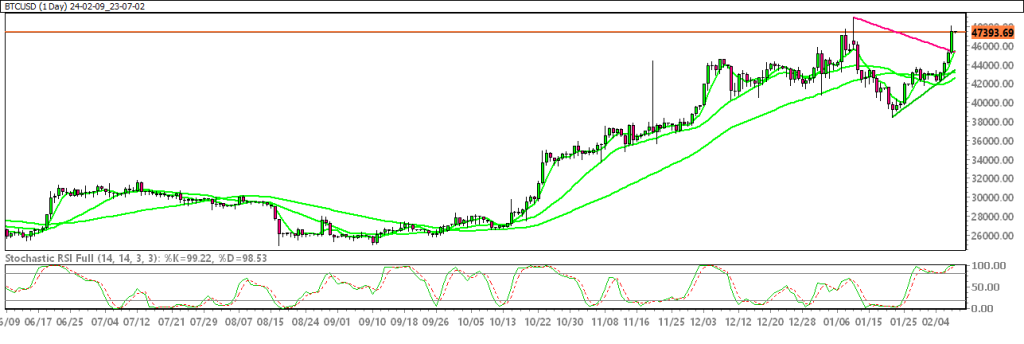
Bitcoin price tests resistance at $43,000, recovering from a week-long slump. Bitcoin on-chain metrics signal a likelihood of a BTC price rally. BTC profit-taking by whales has declined, paving the way for extended price gains. Bitcoin (BTC) price tested resistance at $43,000 on Friday, recovering from declines earlier this week, in a sign of increasing buying pressure after a choppy week. Some of the asset’s on-chain metrics support the thesis of further price gains ahead, although Bitcoin price has been moving broadly sideways for the last two months. The asset could kick-start a potential rally as on-chain metrics are bullish and renewed BTC ETFs inflows after weeks of massive GBTC outflows.Technical Overview With Chart :
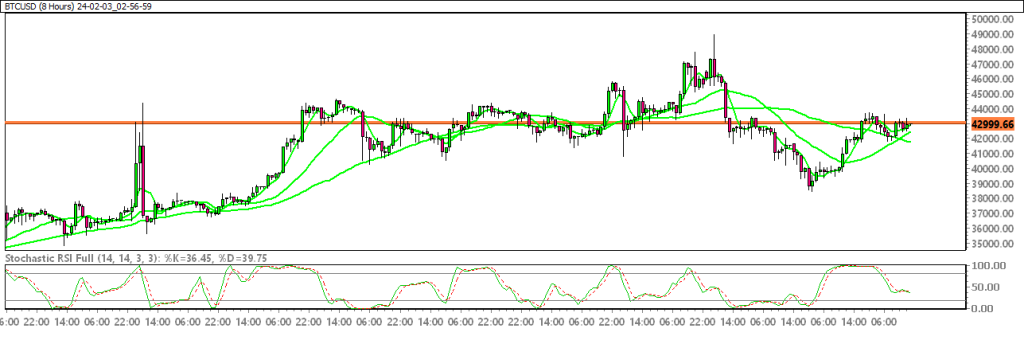
Moving Averages :
Exponential :
- MA 10 : 42576.36 | Positive Crossover | Bullish
- MA 20 : 42457.91 | Positive Crossover | Bullish
- MA 50 : 42090.86 | Positive Crossover | Bullish
Simple :
- MA 10 : 42432.69 | Positive Crossover | Bullish
- MA 20 : 41940.23 | Positive Crossover | Bullish
- MA 50 : 42975.56 | Positive Crossover | Bullish
Stochastic Oscillator : 85.16 | Buy Zone | Neutral
Resistance And Support Levels :
- R1 : 47387.23 R2 : 49860.60
- S1 : 39380.20 S2 : 36906.83