Sive Morten
Special Consultant to the FPA
- Messages
- 18,669
Guys, as nothing really is going on on Gold market right now, at least nothing that needs an update, we will take a look at NZD instead, as we have setup in progress there...
Fundamentals
(Reuters Gold news) - Gold rose on Friday as forecast-beating euro zone inflation data boosted the euro
versus the dollar, while global stock markets retreated from Wednesday's record highs on concerns about global trade.
The euro rose toward 5-1/2-month highs as the data was seen as keeping pressure on the European Central Bank to start dialing back stimulus measures as early as June. That lifted gold, which is priced in the U.S. currency.
Spot gold was up 0.3 percent at $1,266.9 an ounce by 2:42 p.m. EDT (1842 GMT), on track to close April up 1.5 percent. U.S. gold futures for June delivery settled up 0.2 percent at $1,268.30.
"At this point, $1,300 looks like it's more appealing for gold than $1,100," ING analyst Hamza Khan said.
"A bit more weakness in the dollar, combined with more movements around North Korea, could be the situation that sets the stage for higher gold prices."
Jitters over tensions in the Korean peninsula and the threat of a strong showing from an anti-European Union candidate in the French elections helped drive gold higher last week. However, it is now on track for its biggest weekly drop in seven as fading concerns over Korea and a strong showing in the first round of the French vote from centrist candidate Emmanuel Macron sharpened risk appetite, pressuring gold.
"Most of the correction should be done by now," Commerzbank analyst Daniel Briesemann said. "We see good support at this level. There are a lot of uncertainties remaining."
Banks remain stubbornly cautious on gold's price prospects this year in spite of a strong first-quarter performance, a Reuters poll showed on Friday, as the prospect of higher interest rates take the shine off the metal.
A Triumph for M. Macron and the Pollsters in Round One
by Fathom Consulting
French surveyors of public opinion have done a good job so far, with the results from Sunday’s first round of the French presidential race very close to the final set of polls. In line with our central forecast, it is Emmanuel Macron and Marine Le Pen who proceed to the definitive round on 7 May, with the vote reportedly split 61/39 in favour of the centrist candidate.

Absent a dramatic shift in sentiment, the polls — which were largely accurate in predicting the first-round outcome — ought to give us some comfort that M. Macron will become the next President of France. However, there is a risk that abstentions will be greater than normal, which would favour Mme Le Pen.
As readers will doubtless be aware, the two candidates offer voters two radically different visions of France. Mme Le Pen is committed to taking France out of the single currency, while M. Macron is pushing for greater EU integration.
Taking comfort from the polls, which suggest M. Macron is in pole position, European equities, bonds and the euro have all rallied. As our chart highlights, European banks have been the big winners. However, as we noted in last week’s News in Charts, the relief rally in EURUSD will be short lived as the diverging paths of the ECB and the US Federal Reserve cause the euro to depreciate throughout the second half of this year. Our central scenario sees the common currency falling to parity against the US dollar by early next year.
CFTC Report
NZD CFTC data mostly confirms existing bearish sentiment on the market. Net short position were increasing for four weeks, in a row with open interest. It means that week by week new shorts were opened. At the same time, NZD has limited downside potential and very soon it will have to make pause and turn to retracement. Reason for that - oversold area around 19-20K contracts. Right now NZD stands at 15K short contract. So it still has some potential but position aready stands close to all-time low in summer 2015.

Thus, let's keep in mind that NZD still has room to drop but right now we need to control value of net short position carefully. Because result will the same as on GBP - unexpected upside reversal and deep retracement due CFTC oversold.
Technicals
Our discussion of this setup has started as soon as market has reached major 5/8 monthly Fib support @ monthly Oversold (not shown). Situation on NZD long-term picture was very contradictive. From one side we have thurst down and upside retracement from major Fib support, that takes the shape of bearish flag.
But, from the other one - NZD has moved above YPP, it has broken very strong weekly K-resistance and Agreement that happens very rare. Now we have more inputs to make a suggestion on reasons that pushed NZD higher and what to expect in nearest time. There were two major factors that pushed kiwi up - rally on diary products, and some uncertainy around Fed policy and coming elections in the middle of 2016 when Fed was in uncomfortable situation with their promise to hike rates 4 times, and every time they postponed this procedure. While RBNZ has done some unexpected hawkish steps in the same period and didn't cut rate when market has expected it.
Right now we have more clarity as on Fed policy perspectives as on technical picture. Although mothly chart keeps bullish trend still, but price starts to drop out of the flag pattern. NZD in turn was not able to break through major 3/8 Resistance level and out of the flag pattern, when it has made an attemtpt to. Besides, last upward action was not able even to reach the border of the flag pattern. Such action usually precedes downside breakout.
Once price has moved above YPP - it wasn't able to reach YPR1. Now price even stands below trendline and mostly is supported by YPP. Previous rally in January now is totally vanished. This dynamic looks bearish. It is also supported by recent CFTC data:

Weekly
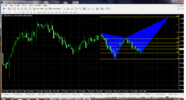
This chart brings very important bearish details. Trend holds bearish here as well. First of all - kiwi has broken both trend line supports, as short-term as longer-term. Harmonic swing also has been broken as after second retracement price was not able to continue move up and "higher high" tendency was over.
Finally, as price has taken out previous lows around 0.6870 - it has destroyed even theoretical chances on appearing of upside butterfly here and this is important. Last week kiwi also has broken first 3/8 major fib support.
As price is not at oversold - it breaks out on free area, where downside action will go easier. Our next target stands 100 pips lower around 0.6760 as AB=CD extension:

Daily
Here you could see familiar picture as we've discussed it recently. Our strategy here was correct as NZD confirms it by price action. Indeed, we're going step by step. In the beginning of the April we've started just with B&B "Sell", second target was 1.618 AB-CD extesion and it has been hit last week.
Now we're talking on 0.6760 - large AB=CD completion point. Also this butterfly 1.618 extension. Appearing of butterfly is rather symbolic here. Recall what we've said in sentiment analysis - "NZD has downside potential but it is limited". Thus, when our target will be hit - we need to check net short postion value. If it will be around 20K contracts - it could mean that butterfly could trigger strong opposite action... Let's don't forget about it.
Why we think that downside action will continue? Well, price is not at oversold and it doesn't hurry up after washing previous lows. It means that barely this is W&R action. But most important is a speed of dropping, it's really fast, like a stone. Usually, when we see such acceleration down to 1.27 target of butterfly - price a bit later follows to 1.618 as well.
Still, some respect of current support could happen in the beginning of the week:

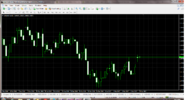
Hourly
In the beginning of the week we will be watching for upside retracement here. Currently it is difficult to suggest, what level market could reach on a way up. Taking in consideration technical moments - retracement should be deep as market is not at oversold and it already has broken major weekly support at 0.6970.
At the same time here, we could recognize potential reverse H&S pattern. It really could trigger deeper upside action. Right now we could accept two levels - 3/8 @ 0.69 and K-resistance @ 0.6925, although we prefer end point at first level.

Still, if even retracement will be higher and reach 5/8 resistance - this will not be the tragedy and it will not cancel yet overall bearish scenario. This will be just a bit surprising for existed background. This deep retracement will happen only if NZD will indeed form reverse H&S pattern here. So let's keep watching.
Conclusion:
Right now market stands at crucial point and depending on what will happen around will clear further perspectives of NZD. Overall fundamental and sentiment background stands not in favor of NZD.
In short-term perspective first we expect to see upside retracement to 0.69-0.6925 area first and downward continuation to 0.6760 target second. Still, if reverse H&S will be formed on hourly chart - retracement could reach 0.6975-0.6980 area.
The technical portion of Sive's analysis owes a great deal to Joe DiNapoli's methods, and uses a number of Joe's proprietary indicators. Please note that Sive's analysis is his own view of the market and is not endorsed by Joe DiNapoli or any related companies.
Fundamentals
(Reuters Gold news) - Gold rose on Friday as forecast-beating euro zone inflation data boosted the euro
versus the dollar, while global stock markets retreated from Wednesday's record highs on concerns about global trade.
The euro rose toward 5-1/2-month highs as the data was seen as keeping pressure on the European Central Bank to start dialing back stimulus measures as early as June. That lifted gold, which is priced in the U.S. currency.
Spot gold was up 0.3 percent at $1,266.9 an ounce by 2:42 p.m. EDT (1842 GMT), on track to close April up 1.5 percent. U.S. gold futures for June delivery settled up 0.2 percent at $1,268.30.
"At this point, $1,300 looks like it's more appealing for gold than $1,100," ING analyst Hamza Khan said.
"A bit more weakness in the dollar, combined with more movements around North Korea, could be the situation that sets the stage for higher gold prices."
Jitters over tensions in the Korean peninsula and the threat of a strong showing from an anti-European Union candidate in the French elections helped drive gold higher last week. However, it is now on track for its biggest weekly drop in seven as fading concerns over Korea and a strong showing in the first round of the French vote from centrist candidate Emmanuel Macron sharpened risk appetite, pressuring gold.
"Most of the correction should be done by now," Commerzbank analyst Daniel Briesemann said. "We see good support at this level. There are a lot of uncertainties remaining."
Banks remain stubbornly cautious on gold's price prospects this year in spite of a strong first-quarter performance, a Reuters poll showed on Friday, as the prospect of higher interest rates take the shine off the metal.
A Triumph for M. Macron and the Pollsters in Round One
by Fathom Consulting
French surveyors of public opinion have done a good job so far, with the results from Sunday’s first round of the French presidential race very close to the final set of polls. In line with our central forecast, it is Emmanuel Macron and Marine Le Pen who proceed to the definitive round on 7 May, with the vote reportedly split 61/39 in favour of the centrist candidate.
Absent a dramatic shift in sentiment, the polls — which were largely accurate in predicting the first-round outcome — ought to give us some comfort that M. Macron will become the next President of France. However, there is a risk that abstentions will be greater than normal, which would favour Mme Le Pen.
As readers will doubtless be aware, the two candidates offer voters two radically different visions of France. Mme Le Pen is committed to taking France out of the single currency, while M. Macron is pushing for greater EU integration.
Taking comfort from the polls, which suggest M. Macron is in pole position, European equities, bonds and the euro have all rallied. As our chart highlights, European banks have been the big winners. However, as we noted in last week’s News in Charts, the relief rally in EURUSD will be short lived as the diverging paths of the ECB and the US Federal Reserve cause the euro to depreciate throughout the second half of this year. Our central scenario sees the common currency falling to parity against the US dollar by early next year.
CFTC Report
NZD CFTC data mostly confirms existing bearish sentiment on the market. Net short position were increasing for four weeks, in a row with open interest. It means that week by week new shorts were opened. At the same time, NZD has limited downside potential and very soon it will have to make pause and turn to retracement. Reason for that - oversold area around 19-20K contracts. Right now NZD stands at 15K short contract. So it still has some potential but position aready stands close to all-time low in summer 2015.
Thus, let's keep in mind that NZD still has room to drop but right now we need to control value of net short position carefully. Because result will the same as on GBP - unexpected upside reversal and deep retracement due CFTC oversold.
Technicals
Our discussion of this setup has started as soon as market has reached major 5/8 monthly Fib support @ monthly Oversold (not shown). Situation on NZD long-term picture was very contradictive. From one side we have thurst down and upside retracement from major Fib support, that takes the shape of bearish flag.
But, from the other one - NZD has moved above YPP, it has broken very strong weekly K-resistance and Agreement that happens very rare. Now we have more inputs to make a suggestion on reasons that pushed NZD higher and what to expect in nearest time. There were two major factors that pushed kiwi up - rally on diary products, and some uncertainy around Fed policy and coming elections in the middle of 2016 when Fed was in uncomfortable situation with their promise to hike rates 4 times, and every time they postponed this procedure. While RBNZ has done some unexpected hawkish steps in the same period and didn't cut rate when market has expected it.
Right now we have more clarity as on Fed policy perspectives as on technical picture. Although mothly chart keeps bullish trend still, but price starts to drop out of the flag pattern. NZD in turn was not able to break through major 3/8 Resistance level and out of the flag pattern, when it has made an attemtpt to. Besides, last upward action was not able even to reach the border of the flag pattern. Such action usually precedes downside breakout.
Once price has moved above YPP - it wasn't able to reach YPR1. Now price even stands below trendline and mostly is supported by YPP. Previous rally in January now is totally vanished. This dynamic looks bearish. It is also supported by recent CFTC data:
Weekly
This chart brings very important bearish details. Trend holds bearish here as well. First of all - kiwi has broken both trend line supports, as short-term as longer-term. Harmonic swing also has been broken as after second retracement price was not able to continue move up and "higher high" tendency was over.
Finally, as price has taken out previous lows around 0.6870 - it has destroyed even theoretical chances on appearing of upside butterfly here and this is important. Last week kiwi also has broken first 3/8 major fib support.
As price is not at oversold - it breaks out on free area, where downside action will go easier. Our next target stands 100 pips lower around 0.6760 as AB=CD extension:
Daily
Here you could see familiar picture as we've discussed it recently. Our strategy here was correct as NZD confirms it by price action. Indeed, we're going step by step. In the beginning of the April we've started just with B&B "Sell", second target was 1.618 AB-CD extesion and it has been hit last week.
Now we're talking on 0.6760 - large AB=CD completion point. Also this butterfly 1.618 extension. Appearing of butterfly is rather symbolic here. Recall what we've said in sentiment analysis - "NZD has downside potential but it is limited". Thus, when our target will be hit - we need to check net short postion value. If it will be around 20K contracts - it could mean that butterfly could trigger strong opposite action... Let's don't forget about it.
Why we think that downside action will continue? Well, price is not at oversold and it doesn't hurry up after washing previous lows. It means that barely this is W&R action. But most important is a speed of dropping, it's really fast, like a stone. Usually, when we see such acceleration down to 1.27 target of butterfly - price a bit later follows to 1.618 as well.
Still, some respect of current support could happen in the beginning of the week:
Hourly
In the beginning of the week we will be watching for upside retracement here. Currently it is difficult to suggest, what level market could reach on a way up. Taking in consideration technical moments - retracement should be deep as market is not at oversold and it already has broken major weekly support at 0.6970.
At the same time here, we could recognize potential reverse H&S pattern. It really could trigger deeper upside action. Right now we could accept two levels - 3/8 @ 0.69 and K-resistance @ 0.6925, although we prefer end point at first level.
Still, if even retracement will be higher and reach 5/8 resistance - this will not be the tragedy and it will not cancel yet overall bearish scenario. This will be just a bit surprising for existed background. This deep retracement will happen only if NZD will indeed form reverse H&S pattern here. So let's keep watching.
Conclusion:
Right now market stands at crucial point and depending on what will happen around will clear further perspectives of NZD. Overall fundamental and sentiment background stands not in favor of NZD.
In short-term perspective first we expect to see upside retracement to 0.69-0.6925 area first and downward continuation to 0.6760 target second. Still, if reverse H&S will be formed on hourly chart - retracement could reach 0.6975-0.6980 area.
The technical portion of Sive's analysis owes a great deal to Joe DiNapoli's methods, and uses a number of Joe's proprietary indicators. Please note that Sive's analysis is his own view of the market and is not endorsed by Joe DiNapoli or any related companies.