Sive Morten
Special Consultant to the FPA
- Messages
- 18,699
Fundamentals
(Reuters FX news) - The dollar was flat on Friday as a Federal Reserve official's seemingly dovish remarks and uninspiring data on the U.S. economy "squelched" the sanguine mood from earlier this week.
The euro rebounded from a two-week trough, and the dollar fell to its low on the day against the Japanese yen after comments from New York Fed President William Dudley. Seen as one of the most important members of the Fed's rate-setting committee, Dudley said the central bank was in no rush to tighten monetary policy.
His comments followed less-than-stellar data on U.S. consumer spending that showed that even as confidence hit its highest level in more than 16 years, Americans are still holding their wallets tightly.
"We're not seeing great sentiment one way or another, but bursts of enthusiasm this morning definitely got squelched by the comments and economic data," said Boris Schlossberg, managing director of FX strategy at BK Asset Management.
"A lot of the air went out of the balloon today because we didn’t get quite the positive data set that we wanted and we’re still getting relatively cautious commentary from the Fed."
Consumer spending, which accounts for more than two-thirds of U.S. economic activity, edged up just 0.1 percent last month.
The dollar index, which tracks the greenback against six rival currencies, was little changed from its late Thursday levels at 100.39. Backed by early-week gains, however, it is headed for its best week since mid-February.
For the month, the dollar index fell 0.7 percent, its second fall in three months after three straight monthly gains to end 2016.
Similarly, the euro, which briefly hit its lowest since March 15, was on track for its worst week in seven as investors this week have revised their expectations for when the European Central Bank will begin to tighten monetary policy.
The euro was last flat against the dollar at $1.0686. It rose nearly 1 percent during the month.
The dollar hit a 10-day high against the yen in overnight trading, but reversed that move, touching its session low after Dudley's remarks. It was last down 0.55 percent at 111.34 yen. The dollar fell 1.2 percent against the yen in March.
Introducing Fathom’s UK STAM: Activity slows into the New Year
by Fathom Consulting
After the UK voted to leave the EU, forecasters believed that the UK economy would slow substantially. Indeed, we had expected some slowdown even in the event of a ‘Remain’ vote. Yet growth picked-up in the second half of 2016. Despite this, ‘pain deferred’ remains our central view.
Upside surprises through the second half of last year gave us little reason to change our assessment of the fundamental impact of the referendum, only the timing. But this is a judgement about the most likely outcome, and we must of course be vigilant to the fact that we may be incorrect.

In August of last year, we introduced our Economic Sentiment Indictor (ESI). Rather than attempt to forecast published estimates of GDP growth, which can be noisy from quarter to quarter, the ESI was intended to measure underlying activity based on survey responses from both consumers and businesses, produced well ahead of official data. We have subsequently created similar measures for both France and Germany.
Applying a similar methodology, we have expanded the UK ESI to create our Short-Term Activity Measure (STAM). In addition to survey results, the STAM includes a range of additional non-survey indicators of economic activity, such as unsecured credit growth and car sales.
Movements in our UK STAM suggest that underlying growth slowed through the first two months of 2017, led by weaker business surveys, and a slowdown in retail sales and car registrations. We expect that the UK STAM will fall further as Brexit negotiations get underway, but we remain alert to the possibility that we may be surprised on the upside, as we highlighted to clients in a recent Newsletter.
COT Report
CFTC data on GBP shows that cable still stands extremely oversold. Speculative net shorts stands at highest level, since 2008. Last two weeks show some fluctuations, but no major reversal has happened yet. Last week shows that some part of shorts has been closed as open interest has decreased slightly as well as net short position. For us it means that major part of potential rally on GBP still stands ahead...

Today guys, it makes sense to take a look at GBP again. Concerning EUR - we mostly have said everything yesterday: bearish reversal week and deep retracement on daily chart significantly erodes bullish perspectives. That's why there we mostly will watch for minor bounce in short-term perspective and downward continuation after this bounce in medium-term horizon...Yesterday EUR has hit our 1.0650 target. Now we will watch for respect of daily K-support area...
Meantime let's take a look at GBP.
Technicals
Monthly
Right now monthly trend is bearish, but market is not at oversold on monthly chart. Market has completed all-time 0.618 AB=CD target and right now stands around it. Overall consolidation remains bearish flag pattern. Now meaningul upside reaction has followed yet on completion of the target.
Overall picture looks bearish by some signs. First is - acceleration down to AB-CD target. Usually fast drop on this point tells that market has chances to continue to AB=CD target, which stands at 1.06 area. Currently it seems too brave suggestion, but at least some minor continuation down is very probable. At the same time, last week we've mentioned HSBC bank forecast that it suggests to see pound around 1.10 area by the end of 2017. Thus, may be our view is not absolutely crackpot...
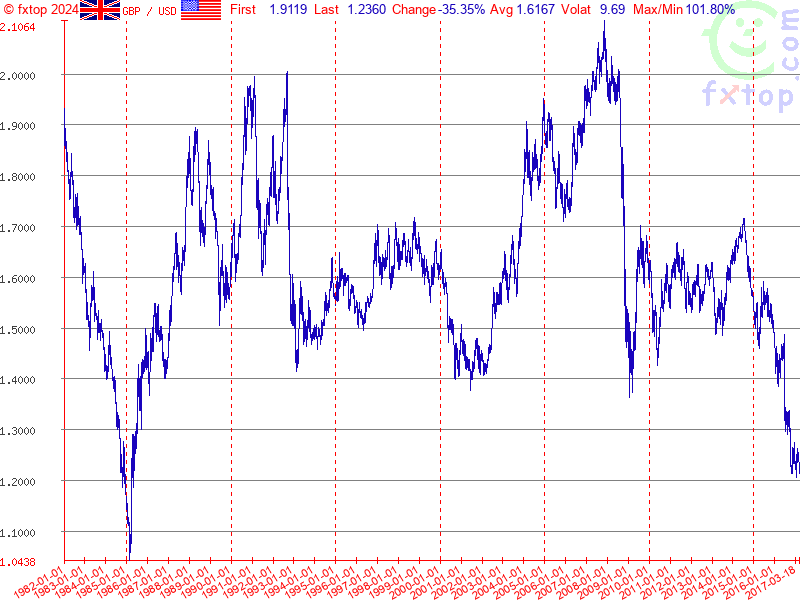
The point is if you will take a look at all-time GBP chart, you'll see that market already has broken major 5/8 Fib support and on a way down, drop is really fast since first leg was on 2008 crisis. Overall fundamental situation is mostly supportive to this scenario, besides, 20 points is not really big distance to GBP that is more volatile than many other major currencies. Fundamentally, as we've read above, Fathom consulting also supports idea of further GBP weakness.
But right now we're mostly interested in possible short-term tactical upside bounce.
Here we have two factors that in general support idea of possible upside bounce. First is - sentiment analysis as GBP is extremely oversold according to CFTC data. Second - on monthly chart we have small W&R of 1.2020 lows. This is very weak context, but we need to take in consideration all details. March candle has closed and we do not have bearish grabber here. Also take a look - flag consolidation could hold reaching of our minimum target by weekly bearish grabber. So, this target could be completed without breaking monthly picture. Market could even test YPP and flag will not hurt significantly.

Weekly
On weekly chart we have our major pattern that could push cable slightly higher. This is bullish grabber that was formed 2 weeks ago. In general, since October market shows signs of bearish dynamic pressure. Another risk factor is untouched 1.618 AB-CD target. That's why, as we've said overall bullish setup is arguable or at least brings more risks to fail than usual.
Still, although untouched targets exist - speculative position is too short. Markets needs more shorts to come to complete AB-CD, but it doesn't have it right now. That's why there are chances exist that first we will get upside bounce and only after that GBP will drop to next downward target:
Thus, here we can specify our "at least" target for this setup. This is previous top at 1.27 area. It should be taken out. But what other targets could be reached here? Well, we have also nice harmonic pattern here that points on 1.3350 area. As market has not touched Yearly Pivot by far around 1.3130, this makes chances on reaching 1.3350 feasible. But first let's focus on 1.27, because 1.3350 now stands even beyond weekly OB area..Due existing of the grabber, invalidation point also becomes clear - this is 1.21 area. Also it is clear that we mostly should focus on most recent upside candle for trading, we do not need swings of larger scale for this setup.

Daily
So daily trend is still bullish. Unfortunately we didn't get bullish grabbers last week, although price stand rather close to MACDP line. As you can see market has completed our first destination point, which is 0.618 AB-CD target. Retracement after it has been hit was really small, just 3/8 Fib support and this is good sign.
At the same time, we can't exclude that GBP still could turn to some intraday AB-CD. Right now upside bounce looks strong and hence, chances on intraday AB-CD are not too significant, but, who knows...
Daily picture is important as it brings array of patterns. First one that we will deal with is upside AB-CD to 1.2830 area. Mostly it matches to grabber pattern and leads to completion of its target.
In general, sideways consolidation since September reminds the shape of H&S pattern. Yes, it doesn't hold ratios, but still, shoulders are rather equal, head also is well recognizable. If upside action will continue by some reason, we could pay attention to more extended patterns that are 1.618 AB-CD and upside butterfly. By the way, it stands rather close to 1.3350 harmoic target that we've discussed above.
Right now we're mostly interested in 1.29 area. This is AB-CD destination, major 5/8 Fib resistance (which creates an Agreement resistance, right?) and 1.27 extension of possible butterfly pattern here:

Intraday
For shorter term perspective we have another question: whether market immediately will continue move up to next daily target, or, we will get deeper retracement first.
If you remember, when saw collapse on 4-hour chart we had intention to wait for deeper retracement level - 1.23 major Fib support. But somehow GBP was able to hold around our 1.24 K-support area. This is good sign. Upward action looks very nice right now, also we have hidden bullish divergence here that brings more confidence with upside continuation, but still we have to keep in mind the strength of plunge and be prepared to unexpected situations.

Hourly chart will help us with this. As you can see on a way up cable has broken all Fib resitance levels. This is good sign. But at the same time it has completed two different extensions. This should lead to minor downside retracement in the beginning of the week. Besides, price will open around WPR1:

That's why on Monday market could show retracement to 1.25 K-support or even 1.2445 major Fib level. This will not be sign of weakness, but normal technical process. Any significant drop below major 5/8 Fib support will increase chances on large bearish AB-CD pattern right to 1.23 level.
Conclusion:
Currently we do not want to look too far in the future. Yes, market shows strong bearish action, especially on very long-term charts, drops down indeed look miserable, and from that standpoint GBP could reach even 1.06 target, but right now we're mostly interested in tactical weekly/daily setup.
Currently cable is forming the background that looks supportive for upside bounce. Another advantage of our setup is its scale - it is not too large. But, at the same time, we have some additional risk factors as major weekly target has not been hit yet.
The technical portion of Sive's analysis owes a great deal to Joe DiNapoli's methods, and uses a number of Joe's proprietary indicators. Please note that Sive's analysis is his own view of the market and is not endorsed by Joe DiNapoli or any related companies.
(Reuters FX news) - The dollar was flat on Friday as a Federal Reserve official's seemingly dovish remarks and uninspiring data on the U.S. economy "squelched" the sanguine mood from earlier this week.
The euro rebounded from a two-week trough, and the dollar fell to its low on the day against the Japanese yen after comments from New York Fed President William Dudley. Seen as one of the most important members of the Fed's rate-setting committee, Dudley said the central bank was in no rush to tighten monetary policy.
His comments followed less-than-stellar data on U.S. consumer spending that showed that even as confidence hit its highest level in more than 16 years, Americans are still holding their wallets tightly.
"We're not seeing great sentiment one way or another, but bursts of enthusiasm this morning definitely got squelched by the comments and economic data," said Boris Schlossberg, managing director of FX strategy at BK Asset Management.
"A lot of the air went out of the balloon today because we didn’t get quite the positive data set that we wanted and we’re still getting relatively cautious commentary from the Fed."
Consumer spending, which accounts for more than two-thirds of U.S. economic activity, edged up just 0.1 percent last month.
The dollar index, which tracks the greenback against six rival currencies, was little changed from its late Thursday levels at 100.39. Backed by early-week gains, however, it is headed for its best week since mid-February.
For the month, the dollar index fell 0.7 percent, its second fall in three months after three straight monthly gains to end 2016.
Similarly, the euro, which briefly hit its lowest since March 15, was on track for its worst week in seven as investors this week have revised their expectations for when the European Central Bank will begin to tighten monetary policy.
The euro was last flat against the dollar at $1.0686. It rose nearly 1 percent during the month.
The dollar hit a 10-day high against the yen in overnight trading, but reversed that move, touching its session low after Dudley's remarks. It was last down 0.55 percent at 111.34 yen. The dollar fell 1.2 percent against the yen in March.
Introducing Fathom’s UK STAM: Activity slows into the New Year
by Fathom Consulting
After the UK voted to leave the EU, forecasters believed that the UK economy would slow substantially. Indeed, we had expected some slowdown even in the event of a ‘Remain’ vote. Yet growth picked-up in the second half of 2016. Despite this, ‘pain deferred’ remains our central view.
Upside surprises through the second half of last year gave us little reason to change our assessment of the fundamental impact of the referendum, only the timing. But this is a judgement about the most likely outcome, and we must of course be vigilant to the fact that we may be incorrect.
In August of last year, we introduced our Economic Sentiment Indictor (ESI). Rather than attempt to forecast published estimates of GDP growth, which can be noisy from quarter to quarter, the ESI was intended to measure underlying activity based on survey responses from both consumers and businesses, produced well ahead of official data. We have subsequently created similar measures for both France and Germany.
Applying a similar methodology, we have expanded the UK ESI to create our Short-Term Activity Measure (STAM). In addition to survey results, the STAM includes a range of additional non-survey indicators of economic activity, such as unsecured credit growth and car sales.
Movements in our UK STAM suggest that underlying growth slowed through the first two months of 2017, led by weaker business surveys, and a slowdown in retail sales and car registrations. We expect that the UK STAM will fall further as Brexit negotiations get underway, but we remain alert to the possibility that we may be surprised on the upside, as we highlighted to clients in a recent Newsletter.
COT Report
CFTC data on GBP shows that cable still stands extremely oversold. Speculative net shorts stands at highest level, since 2008. Last two weeks show some fluctuations, but no major reversal has happened yet. Last week shows that some part of shorts has been closed as open interest has decreased slightly as well as net short position. For us it means that major part of potential rally on GBP still stands ahead...
Today guys, it makes sense to take a look at GBP again. Concerning EUR - we mostly have said everything yesterday: bearish reversal week and deep retracement on daily chart significantly erodes bullish perspectives. That's why there we mostly will watch for minor bounce in short-term perspective and downward continuation after this bounce in medium-term horizon...Yesterday EUR has hit our 1.0650 target. Now we will watch for respect of daily K-support area...
Meantime let's take a look at GBP.
Technicals
Monthly
Right now monthly trend is bearish, but market is not at oversold on monthly chart. Market has completed all-time 0.618 AB=CD target and right now stands around it. Overall consolidation remains bearish flag pattern. Now meaningul upside reaction has followed yet on completion of the target.
Overall picture looks bearish by some signs. First is - acceleration down to AB-CD target. Usually fast drop on this point tells that market has chances to continue to AB=CD target, which stands at 1.06 area. Currently it seems too brave suggestion, but at least some minor continuation down is very probable. At the same time, last week we've mentioned HSBC bank forecast that it suggests to see pound around 1.10 area by the end of 2017. Thus, may be our view is not absolutely crackpot...
The point is if you will take a look at all-time GBP chart, you'll see that market already has broken major 5/8 Fib support and on a way down, drop is really fast since first leg was on 2008 crisis. Overall fundamental situation is mostly supportive to this scenario, besides, 20 points is not really big distance to GBP that is more volatile than many other major currencies. Fundamentally, as we've read above, Fathom consulting also supports idea of further GBP weakness.
But right now we're mostly interested in possible short-term tactical upside bounce.
Here we have two factors that in general support idea of possible upside bounce. First is - sentiment analysis as GBP is extremely oversold according to CFTC data. Second - on monthly chart we have small W&R of 1.2020 lows. This is very weak context, but we need to take in consideration all details. March candle has closed and we do not have bearish grabber here. Also take a look - flag consolidation could hold reaching of our minimum target by weekly bearish grabber. So, this target could be completed without breaking monthly picture. Market could even test YPP and flag will not hurt significantly.
Weekly
On weekly chart we have our major pattern that could push cable slightly higher. This is bullish grabber that was formed 2 weeks ago. In general, since October market shows signs of bearish dynamic pressure. Another risk factor is untouched 1.618 AB-CD target. That's why, as we've said overall bullish setup is arguable or at least brings more risks to fail than usual.
Still, although untouched targets exist - speculative position is too short. Markets needs more shorts to come to complete AB-CD, but it doesn't have it right now. That's why there are chances exist that first we will get upside bounce and only after that GBP will drop to next downward target:
Thus, here we can specify our "at least" target for this setup. This is previous top at 1.27 area. It should be taken out. But what other targets could be reached here? Well, we have also nice harmonic pattern here that points on 1.3350 area. As market has not touched Yearly Pivot by far around 1.3130, this makes chances on reaching 1.3350 feasible. But first let's focus on 1.27, because 1.3350 now stands even beyond weekly OB area..Due existing of the grabber, invalidation point also becomes clear - this is 1.21 area. Also it is clear that we mostly should focus on most recent upside candle for trading, we do not need swings of larger scale for this setup.
Daily
So daily trend is still bullish. Unfortunately we didn't get bullish grabbers last week, although price stand rather close to MACDP line. As you can see market has completed our first destination point, which is 0.618 AB-CD target. Retracement after it has been hit was really small, just 3/8 Fib support and this is good sign.
At the same time, we can't exclude that GBP still could turn to some intraday AB-CD. Right now upside bounce looks strong and hence, chances on intraday AB-CD are not too significant, but, who knows...
Daily picture is important as it brings array of patterns. First one that we will deal with is upside AB-CD to 1.2830 area. Mostly it matches to grabber pattern and leads to completion of its target.
In general, sideways consolidation since September reminds the shape of H&S pattern. Yes, it doesn't hold ratios, but still, shoulders are rather equal, head also is well recognizable. If upside action will continue by some reason, we could pay attention to more extended patterns that are 1.618 AB-CD and upside butterfly. By the way, it stands rather close to 1.3350 harmoic target that we've discussed above.
Right now we're mostly interested in 1.29 area. This is AB-CD destination, major 5/8 Fib resistance (which creates an Agreement resistance, right?) and 1.27 extension of possible butterfly pattern here:
Intraday
For shorter term perspective we have another question: whether market immediately will continue move up to next daily target, or, we will get deeper retracement first.
If you remember, when saw collapse on 4-hour chart we had intention to wait for deeper retracement level - 1.23 major Fib support. But somehow GBP was able to hold around our 1.24 K-support area. This is good sign. Upward action looks very nice right now, also we have hidden bullish divergence here that brings more confidence with upside continuation, but still we have to keep in mind the strength of plunge and be prepared to unexpected situations.
Hourly chart will help us with this. As you can see on a way up cable has broken all Fib resitance levels. This is good sign. But at the same time it has completed two different extensions. This should lead to minor downside retracement in the beginning of the week. Besides, price will open around WPR1:
That's why on Monday market could show retracement to 1.25 K-support or even 1.2445 major Fib level. This will not be sign of weakness, but normal technical process. Any significant drop below major 5/8 Fib support will increase chances on large bearish AB-CD pattern right to 1.23 level.
Conclusion:
Currently we do not want to look too far in the future. Yes, market shows strong bearish action, especially on very long-term charts, drops down indeed look miserable, and from that standpoint GBP could reach even 1.06 target, but right now we're mostly interested in tactical weekly/daily setup.
Currently cable is forming the background that looks supportive for upside bounce. Another advantage of our setup is its scale - it is not too large. But, at the same time, we have some additional risk factors as major weekly target has not been hit yet.
The technical portion of Sive's analysis owes a great deal to Joe DiNapoli's methods, and uses a number of Joe's proprietary indicators. Please note that Sive's analysis is his own view of the market and is not endorsed by Joe DiNapoli or any related companies.