Sive Morten
Special Consultant to the FPA
- Messages
- 18,673
Fundamentals
Reuters reports dollar fell against a basket of currencies on Friday, ending a decent month on a sour note as a record-low rise in U.S. employment costs in the second quarter dialed back bets the Federal Reserve would raise interest rates later this year.
The euro rebounded strongly against the greenback following Thursday's losses in the wake of encouraging inflation data in the euro zone. A nearly 3 percent drop in Brent crude oil prices hurt the Norwegian crown, Australian dollar and other commodity-linked currencies, but they turned higher as the greenback stumbled on the disappointing 0.2 percent gain in labor costs in the second quarter.
"It knocked the knees out of the dollar longs. It took everyone by shock," said Boris Schlossberg, managing director of FX strategy at BK Asset Management in New York.
Some analysts had reckoned a rise of at least 0.5 percent in the employment cost index would seal the deal for the Fed to hike rates, perhaps as early as September.
A stronger-than-forecast report on U.S. Midwest factory activity took some of the sting out of the ECI report. The greenback trimmed its losses in late trading following comments from St. Louis Federal Reserve Bank President James Bullard in an interview with the Wall Street Journal, who downplayed the tepid ECI figure.
“We are (in a) good position to make the first normalization move,” Bullard told the paper, adding he was open for a rate hike in September.
The next big moment for the greenback will be the July U.S. jobs report, which, if it shows further jobs growth, may spur traders to add bullish bets on the dollar, analysts said.
Meanwhile, currencies closely linked to oil and commodities prices fell earlier Friday on fears about global oversupply and diminishing demand from China before they recovered on the dollar's downturn.
Now let’s take a look closer view on recent ECI Index that has stunned markets. (By Bloomberg news service)
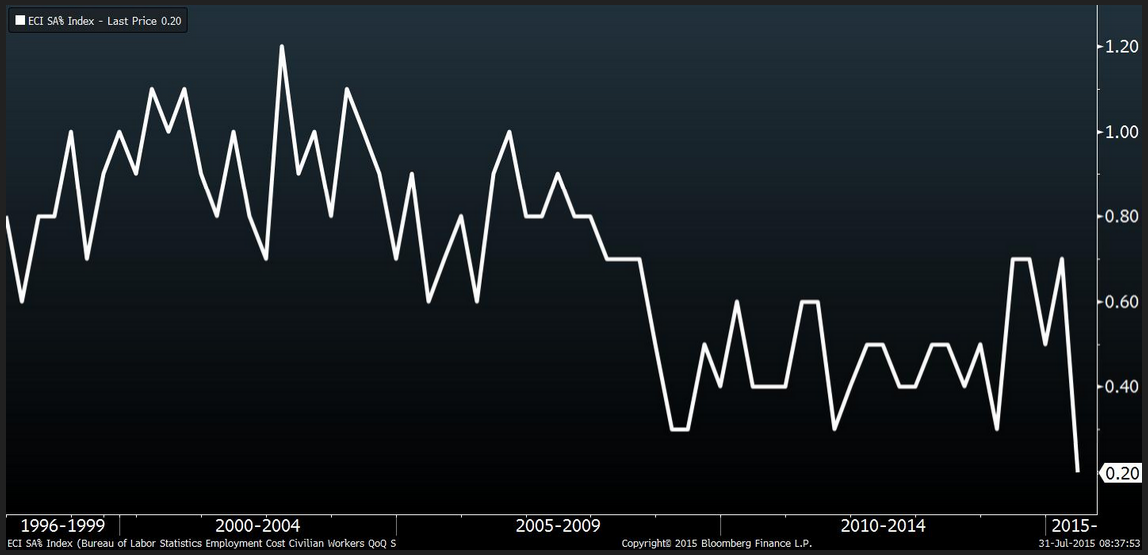 Wages and salaries in the U.S. rose in the second quarter at the slowest pace on record, dashing projections that an improving labor market would boost pay.
The 0.2 percent advance was the smallest since records began in 1982 and followed a 0.7 percent increase in the first quarter, the Labor Department said Friday. The agency’s employment cost index, which also includes benefits, also rose 0.2 percent in the second quarter from the prior three months.
Federal Reserve Chair Janet Yellen and her colleagues are counting on rising wages to boost the economy and bring inflation closer to their 2 percent goal. The setback may prompt some officials to call for a delay in raising interest rates for the first time since 2006.
“You’re really not building up the tightness that everyone says,” said Steven Ricchiuto, chief economist at Mizuho Securities USA Inc. in New York, who projected the overall ECI would rise 0.5 percent, among the lowest estimates. “For the people who were saying the Fed’s got to raise rates in September, this is a shock.”
The yield on the benchmark 10-year note dropped to 2.21 percent at 8:47 a.m. in New York from 2.26 percent late on Thursday as investors weighed what impact it would have on Fed policy. Stock-index futures rallied after the report.
Survey Results
The median forecast of 57 economists surveyed projected a 0.6 percent increase for the total ECI index. Last quarter’s reading was lower than all estimates, which ranged from increases of 0.4 percent to 0.8 percent. The gauge measures employer-paid taxes such as Social Security and Medicare in addition to the costs of wages and benefits.
Wages and salaries typically account for about 70 percent of total employment expenses. The ECI data help color the outlook for worker pay after the June employment report showed average hourly earnings rose 2 percent from a year earlier, matching the average since the start of the expansion six years ago.
Because the ECI tracks the same job over time, it removes shifts in the mix of workers across industries, which is a shortcoming of the hourly earnings figures.
Wages of all employees, including government workers, advanced 2.1 percent from the same period in 2014 after climbing 2.6 percent year-over-year in the first quarter.
Private Wages
Private wages were little changed in the second quarter from the previous three months, the worst performance since those records began in 1980.
Wage growth has been slow to respond to indications that the labor market is tightening, which would normally cause managers to feel pressure to boost pay amid a smaller pool of workers.
Job openings climbed in May to 5.36 million, the highest in records dating to the end of 2000, Labor Department data show. There are about 1.6 Americans per available position, matching the lowest level since September 2007.
Surveys of small businesses, at least, show managers aren’t planning on further need to raise wages in order to attract and retain employees.
A net 11 percent of managers in June said they plan to increase pay, the fewest since January 2014, according to 620 responses in a National Federation of Independent Business survey. A net 21 percent said they had already recently boosted worker compensation.
Payroll Gains
Wage growth has been slow to emerge even as the job market strengthens. Employers have added an average 208,300 positions a month this year compared with 259,700 in 2014 that was the best in 15 years. Economists surveyed by Bloomberg project 2015 will show a 220,000 average, according to a poll conducted July 2-8.
The unemployment rate is fast approaching the 5-to-5.2 percent range that Fed policy makers have defined as full employment. The rate dropped to 5.3 percent in June, the lowest since April 2008.
“The labor market continued to improve, with solid job gains and declining unemployment,” Fed policy makers said in a statement Wednesday at the conclusion of their two-day meeting in Washington. “On balance, a range of labor market indicators suggests that underutilization of labor resources has diminished since early this year.”
QIII 2015 Perspectives
Recent data, Fed comments makes us think that US rate hike in September will not lead to the real cycle and consequences of rising rates. Based on the comments, it seems that Fed mostly worries on hurting fragile economy growth rather than scares inflation. We see other signs that support this view. Thus, despite outstanding measures in different countries to increase pace of economy growth – world economy slows down. This is point on continuation of low rates environment. Simultaneously we should point on contradiction between political decisions and economic forces and nature.
That’s being said now we see massive measures to make economy hotter. First is QE is US. Now we see the same program in Japan and EU. But all these countries right now meet intrinsic problems. EU has problems with building of single currency, while Japan has frozen economy growth after rising VAT in 2014. China right now turns in turbulence and we see deterioration as in fundamentals as on financial markets and economy. As a result, such indicators of Globe economy as Copper, Iron Ore and Crude oil continue to decrease.
At first glance situation in US becomes better, but in reality middle class has got just modest benefit from improvements in economy situation. In recent 3-5 years US GDP shows stable growth 2-3% and looks like everything is OK. But we have to understand that this grows stands in environment of growing public debt, exceptional QE program and exacerbation of social inequalities, undermining its sustainability. Fed measures have led to improving situation – public debt starts to grow, job market is improving, low interest rates let people to refinance former debt and reconstituting their savings. At the same time, when these sources mostly were utilized, further domestic consumption growth will be possible only due wage increasing. And this is particularly what we do not see right now. If wages will not start to grow, hardly we will see GDP growth above 3%. That’s why Fed every time attracts attention to this subject.
Another primary condition for stable US economy growth is investment expenditure. Theoretically US companies should invest much due Fed zero rate program. Although expenditures have increased recently but they have not reached yet the top of 2000 year. Companies right now prefer to generate earnings on shares buyback rather than widening of investment programs and activity. Other words, current growth mostly seems artificial that is based on unsustainable fiscal policy but not on real booming of investment activity.
In the eurozone, the single currency’s weakness prompted a slight improvement in economic activity at the start of the year. Despite the rising trend of the last two years,GDP growth is barely 1%, illustrating the structural difficulties facing Europe. The escalation of the Greek crisis demonstrates the inherent contradictions in the construction of the euro. By giving the same currency to countries with widely diverging levels of competitiveness, without providing for a transfer of resources from the most competitive countries to the least competitive countries, the public authorities have created a system which, sooner or later, will become unstable. The least competitive countries are accumulating budgetary and trade deficits that are leading to excessive debt levels. As European citizens are not ready for fiscal union and the political authorities do not want to give up on the euro, Europe is in danger of being wedged in a dilemma that will impede economic growth.
Speaking on inflation we should point that it stands mostly anemic and we do not see real hazard right now. Commodities prices are falling across the board, In the UnitedStates, the consumption price deflator (excluding food and energy), which is the Federal Reserve’s preferred price indicator, remains well below the 2% target. Until wages start to rise
significantly, inflationary pressures will be minimal.
Despite the return of volatility in the second quarter, the fundamentals of the financial markets have not changed. Excessive debt in industrialized countries means that the bases for a strong and sustainable economic recovery are not present. The central banks will therefore continue to pursue very expansive monetary policies and use unconventional means such as quantitative easing. As long as they can keep control of the situation, interest rates will remain very low, especially as
it would be hard for the global economy to support higher interest rates.
Company profits, the second key factor for rising stock markets, are reasonable but not exceptional. While sales have
been impacted by the weak global economic context, profits have fared better thanks to good cost control. The situation is even better when it comes to earnings per share thanks to the share buybacks that many companies have conducted, especially in Anglo- Saxon countries. In the United States, over 80% of recorded earnings have been used to buy back shares or increase the dividend. These financial operations shore up share prices in the short term although the resulting low level of productive investment is a concern for the long term.
Speaking on US and EU monetary policies, USD will stand in favor is we will take a look at US bonds yields, rate hiking expectation and Greece problems and other imbalances between rich and poor EU countries. At the same time, capital flows underpinning the dollar’s strength are mainly short term. By contrast, the respective base balance (current account balance + direct investments) favours the euro.
Last week CFTC data does not show big changes. Shorts-to-All speculative positions still stands around 70% and keeps door open as for rally as for further drop. Thus, we again will rely mostly on technical analysis. Still, data shows while short positions slightly have decreased – long ones vice versa have crept slightly higher. So may be our hopes on deeper upside retracement are not desperate.
Open Interest:
 Longs:
 Shorts:

Technicals
Monthly
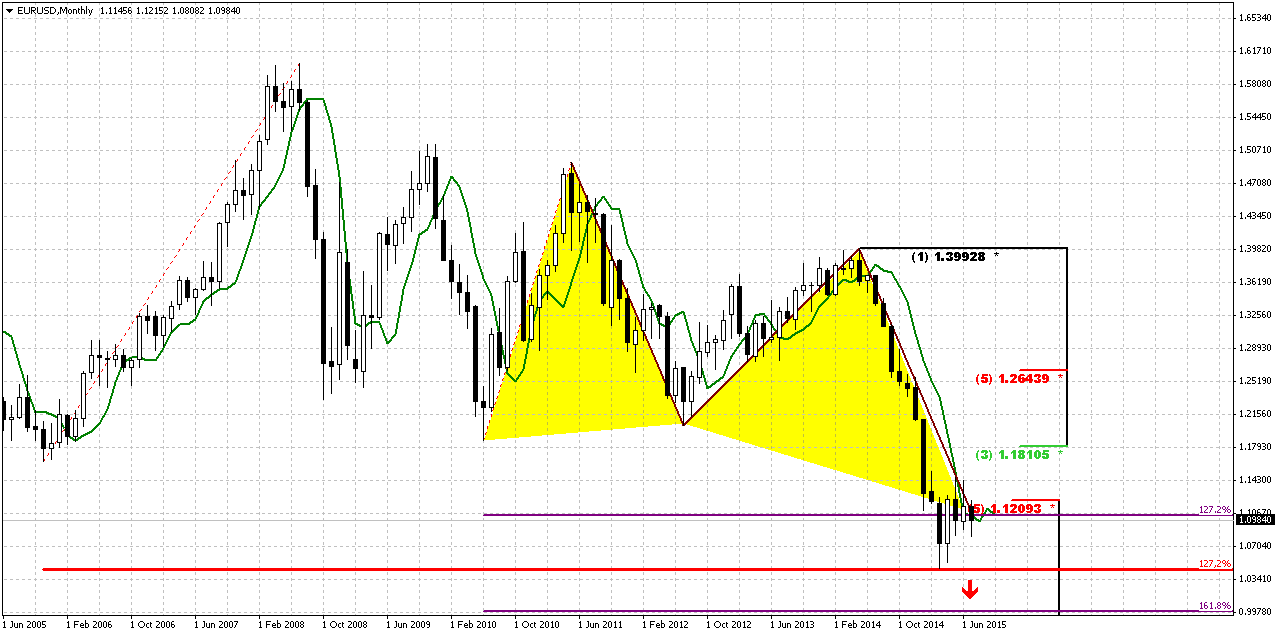
Trend is bearish on monthly chart, July action does not bring any additional information by far and does not clarify further direction. Based on character of recent activity on the market – recent 3-4 months are definitely a retracement, but it could develop differently. For example, market could return back to lows and then form DRPO Buy and trigger upside retracement or, say, it could move directly to 1.18 right now and form B&B “Sell”. Both scenarios are possible yet.
As we have estimated previously 1.05 is 1.27 extension of huge upside swing in 2005-2008 that also has created large & wide butterfly pattern. Recent action does not quite look like normal butterfly wing, but extension is valid and 1.05 is precisely 1.27 ratio. At the same time we have here another supportive targets, as most recent AB=CD, oversold and 1.27 of recent butterfly.
April has closed and confirmed nicely looking bullish engulfing pattern. We know that most probable target of this pattern is length of the bars counted upside. This will give us approximately 3/8 Fib resistance 1.1810 area. This retracement should be mostly tactical. We continue to expect downward continuation in long-term perspective.
Now about our recent talk on possible B&B or DRPO here. We’ve said that B&B seems more probable. We’ve got close above 3x3 DMA in June, but this barely has happened. July action stands flat and this is not sufficient to get B&B “Sell”. So chances on its appearing are melting as time is passing by. Still we will keep watching for DiNapoli directional patterns but probably they will appear not as fast as we have expected.
Despite whether upside retracement will happen or not our next long-term target stands the same – parity as 1.618 completion point of recent butterfly. Currently we should treat possible bounce up, even to 1.18 area, only as retracement within bear trend.
Weekly
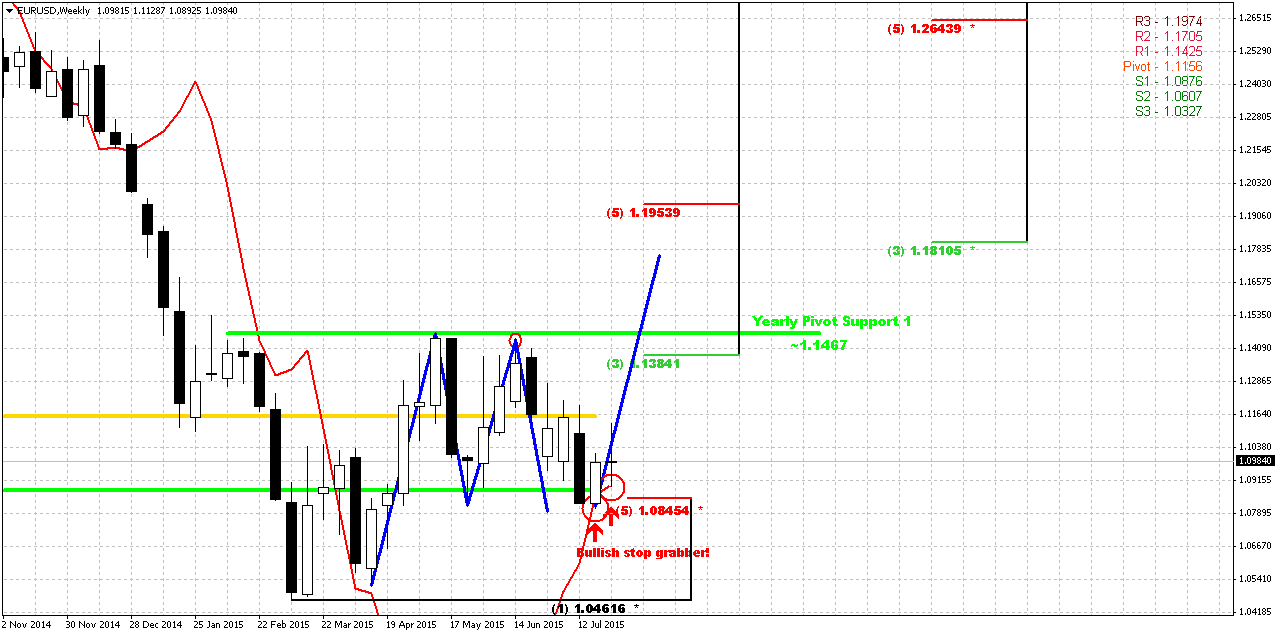
Right now weekly chart is most important for us, since it has major patterns that could become driving factors medium-term perspective. Once we’ve said that if EUR will take 1.08 lows it will erase chance on upside butterfly, and this has happened. At the same time take a look at the picture – market has created nothing but “222” Buy pattern. Now recall puny W&R on daily chart two days ago. When I saw it I thought why it is so small. Now we understand – market just has completed downward AB=CD. As soon as it has done it – it has turned up.
Second issue is MPS1. Price has held above it. It means that bullish trend on weekly chart is still valid. And finally – last week we’ve got bullish grabber again, second one in a row. Also market has perfectly completed our setup on long entry by meaningful retracement inside the body of first grabber. Both grabbers are valid right now. Minimum target that market should reach based on this pattern is former highs around 1.1450 level. If we suggest possible upside AB=CD then our monthly scenario with B&B pattern @ 1.18 does not look as impossible as previously.
Last week we’ve said - don’t ask me how this should happen in current fundamental background. And again – it were fundamentals as last week. Miserable drop in ECI index has pushed EUR 100+ higher and setup has worked perfectly.
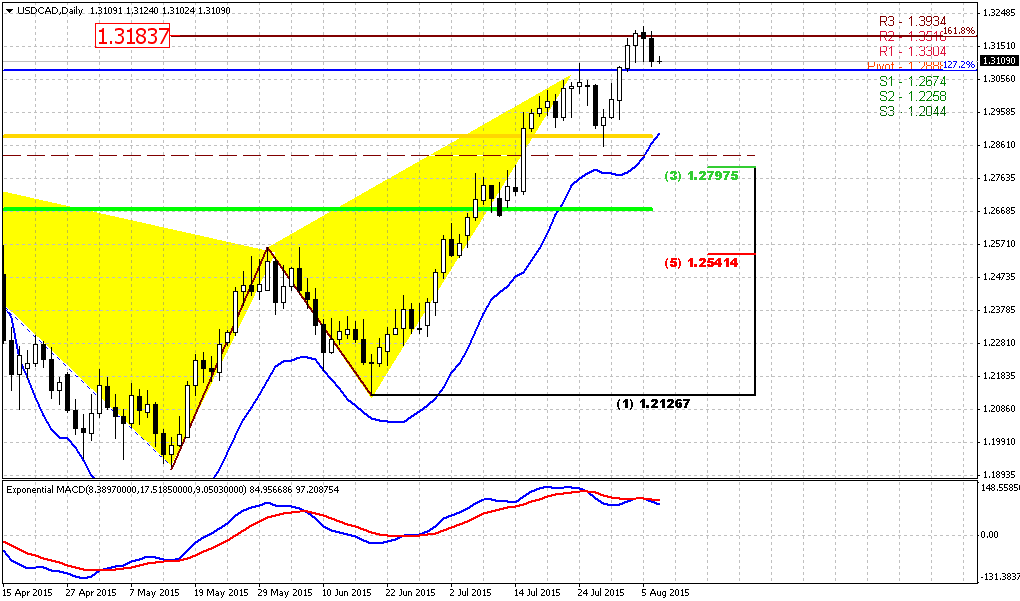
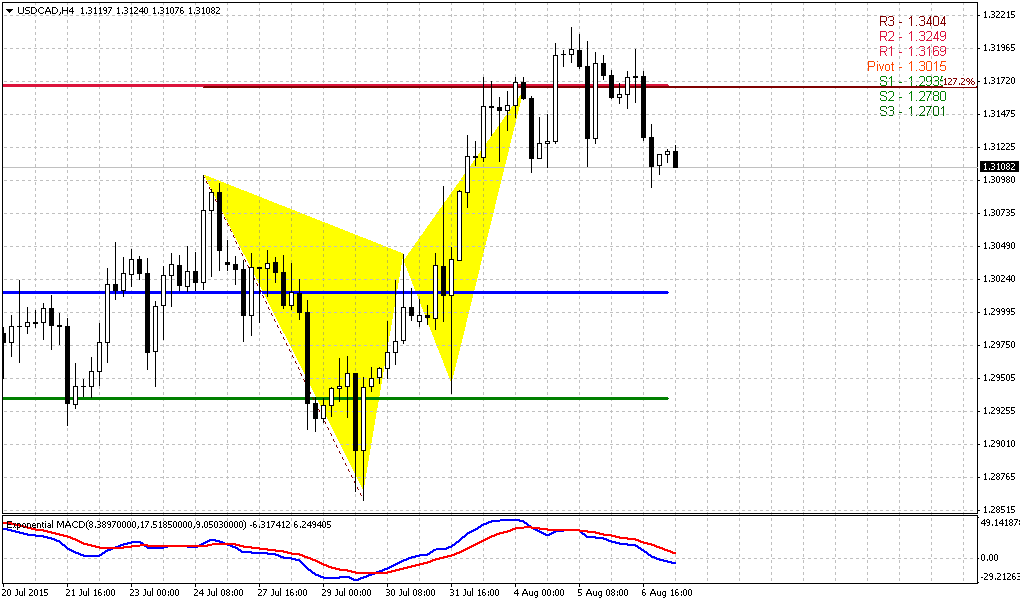
Last week when we’ve said that CAD should reach 1.30 there also were a lot of doubts. But Bank of Canada surprisingly cut the rate and target has been achieved. May be we also will get some event that will make possible to reach the target.
Conversely, any setup could fail, and grabber is not an exception. Failure also will eliminate any concerns on “how EUR will reach 1.18” answer will be nohow. But as soon as setup is still valid we will work with it. It gives us important information that our invalidation point is 1.08 lows. If market will break them – our setup will be destroyed.
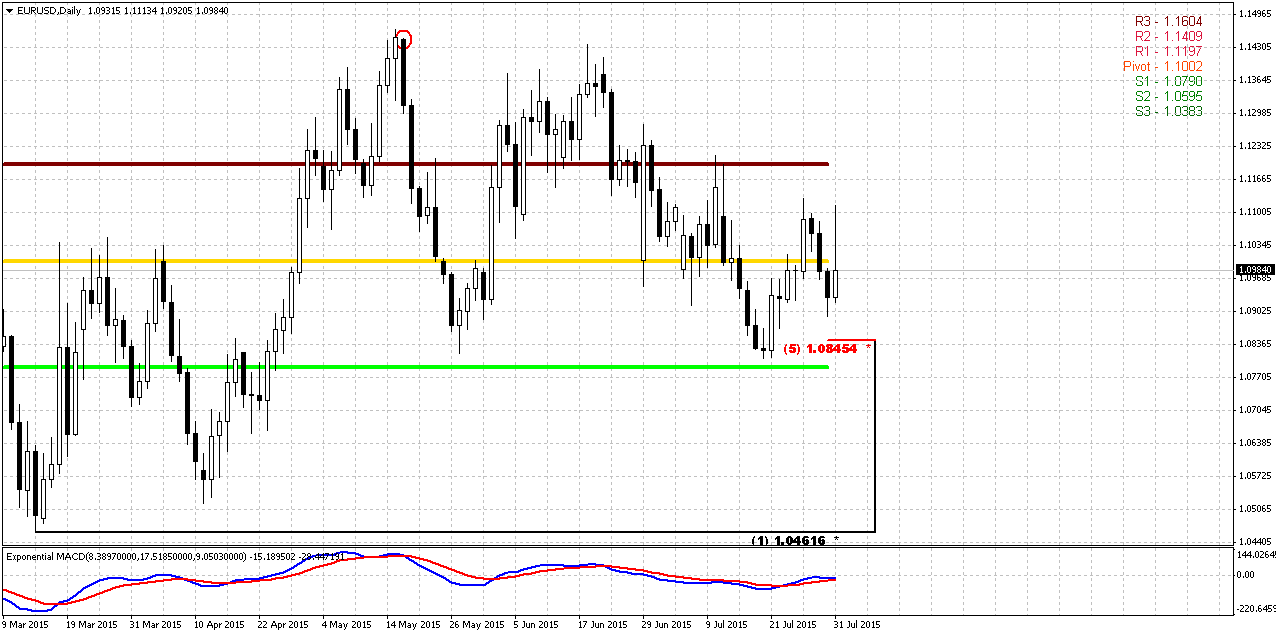
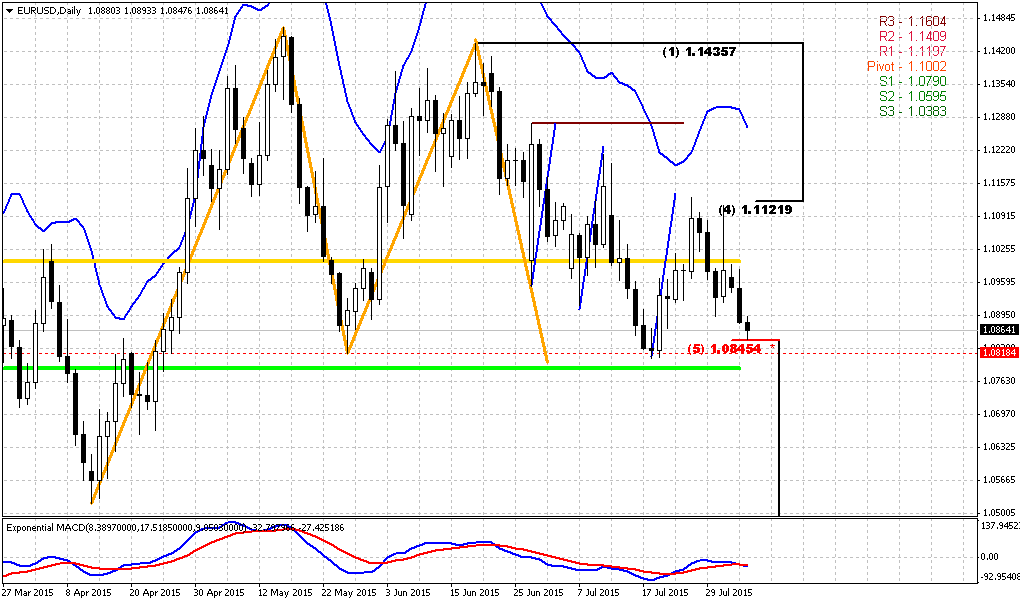
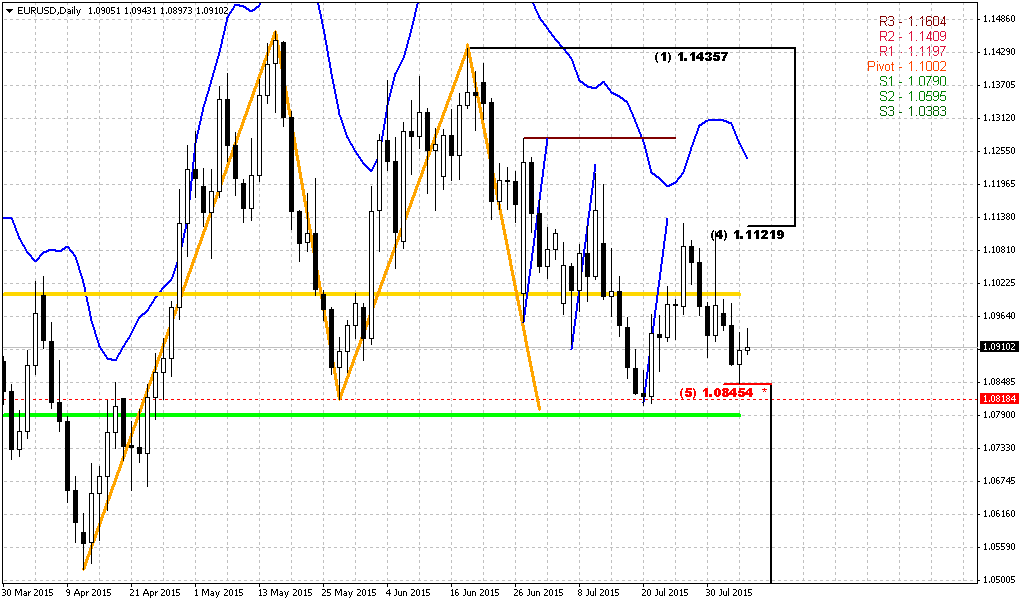
Daily
Daily picture does not give us any new inputs by far, but at the same time it does not contradict other time frames as well. Mostly it stands neutral. Here we do not see any patterns, but at the same time trend still holds bullish here. EUR was not able to move higher at the first challenge but it does not mean that upside scenario has failed totally. Probably we will get final clarity on coming week, may be ADP and NFP reports will play their role to become a driving factors. Also here I plot new August pivots.
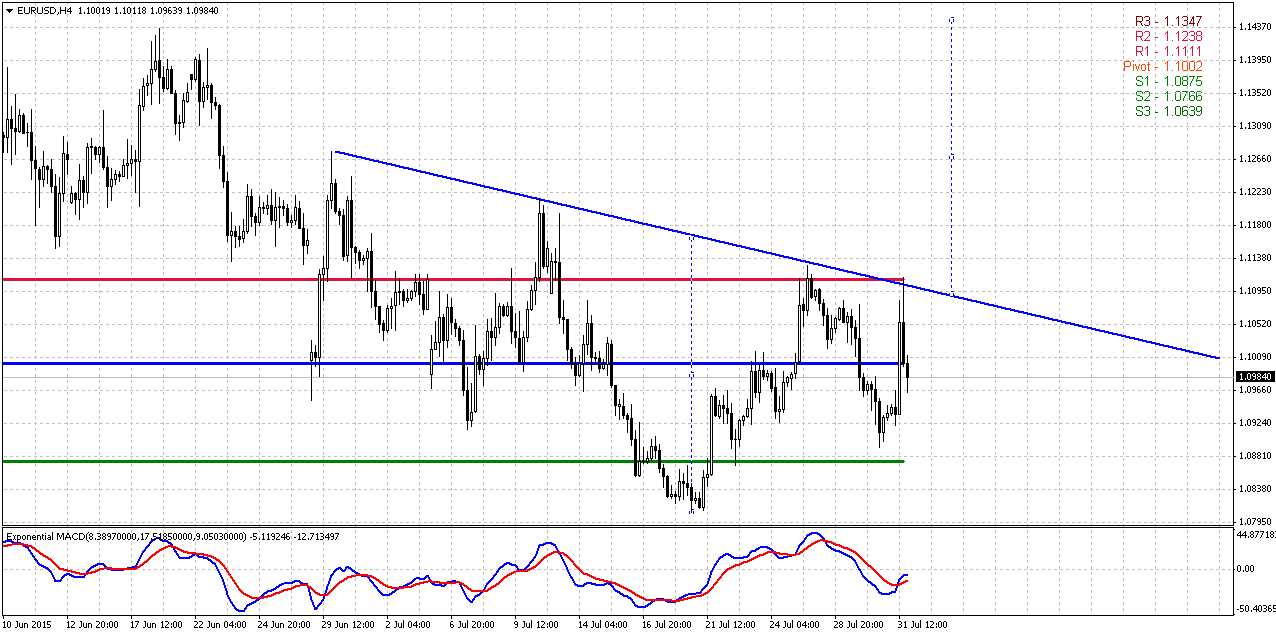
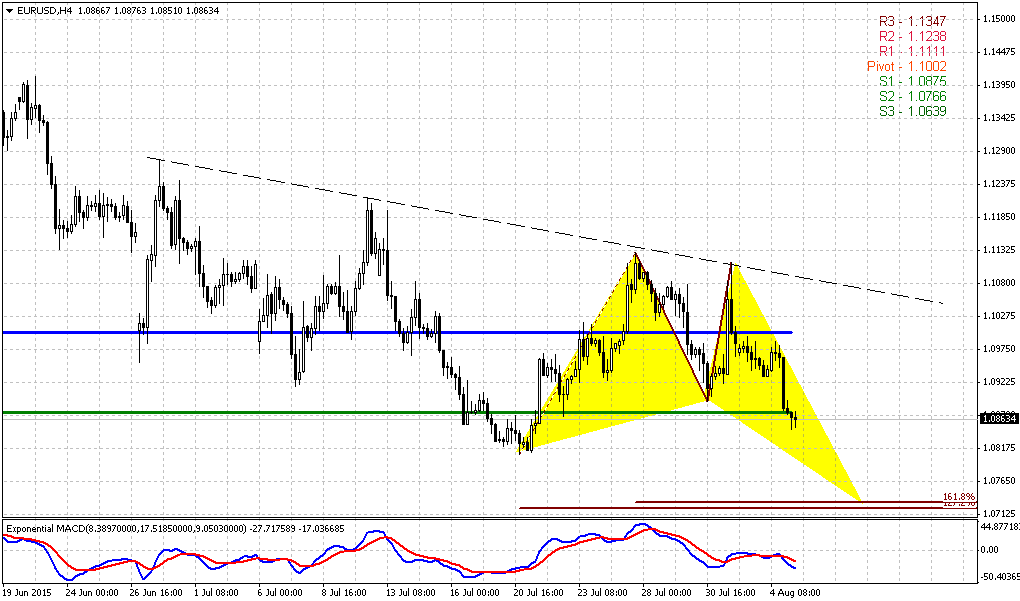
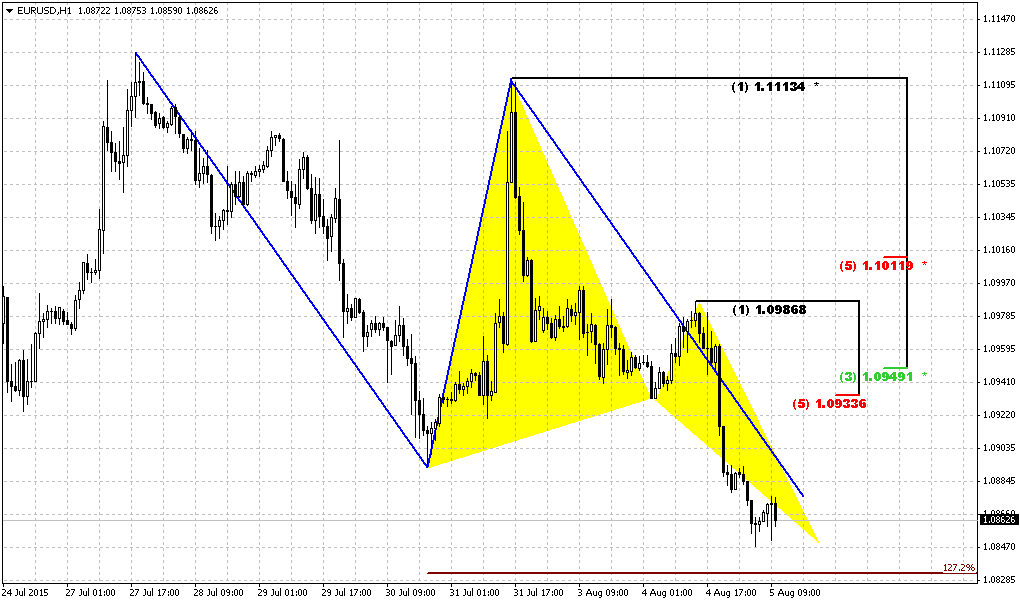
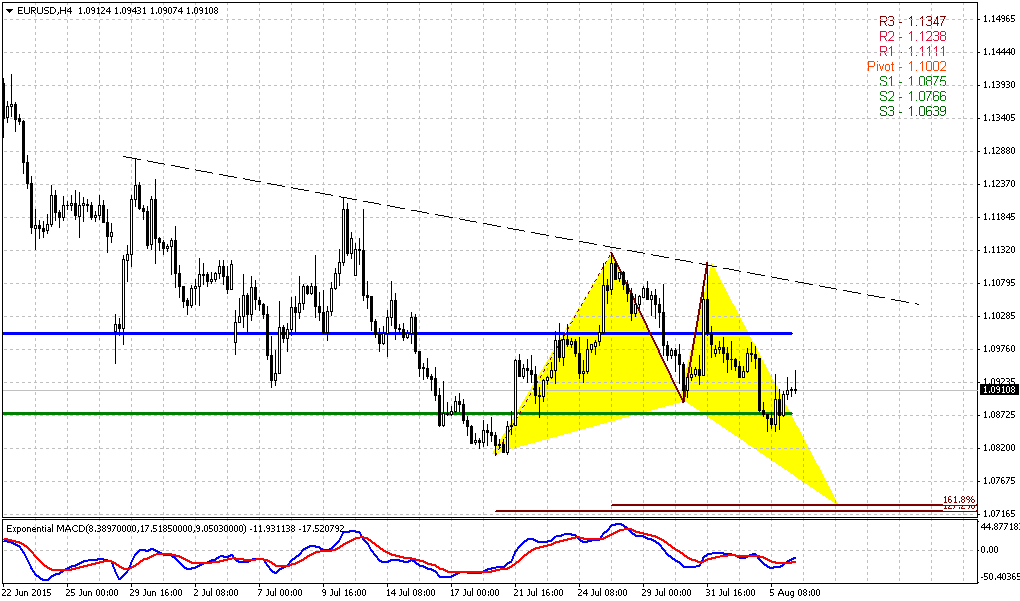
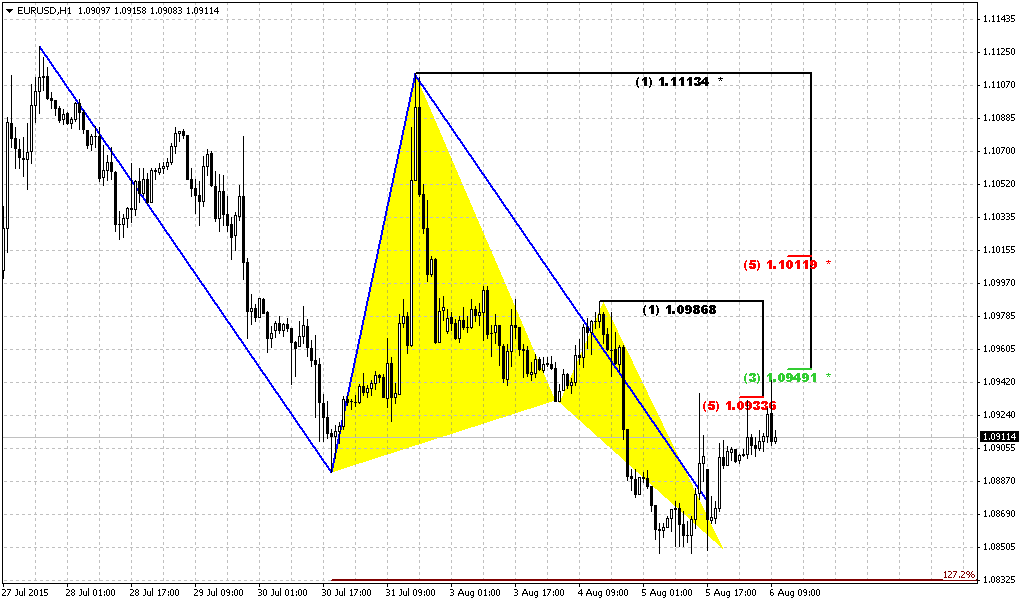
4-Hour
Since there is nothing special on daily, let’s see what we have on 4-hour chart. First of all take a look at WPP. On coming week it coincides !!! with monthly one right at 1.10 level. So moving above this area will be bullish sign and EUR will open on Monday right around it.
Trend has turned bullish here with strong crossing angle on MACD. Pattern that we will monitor on coming week is reverse H&S pattern. I hope guys, that if you have followed our analysis and entered long, you already have moved your stops to breakeven…
To better understand what will be unnatural behavior for the market, let’s turn to mechanics. Upward action of the head was a reaction on strong support of daily/weekly area that has led to appearing of bullish grabber on weekly chart. Upside action was strong that is typical for right side of the H&S pattern where bulls should control the market. Last week market mostly has spent in retracement where we’ve taken long position and on Friday EUR has skyrocketed. So, H&S looks nice. If market really has intention to go up further, probably it should keep the bottom of right shoulder and definitely should keep the bottom of the head. But, as we know, if market fails at shoulder – almost every time it lead to total failure of H&S, drop below head and as consequence – to the failure of weekly bullish setup. If this will happen, then market will clarify that grabber candle is just reaction on support, minor bounce but not reversal. Hence, probably we will get clarity on next week.
If market is really bullish it has no necessity to return back to the lows, since it already has shown 5/8 retracement after initial swing up. As retracement already has happened, next step should be upside development and challenging of neckline + WPR1 resistance area.
Target of H&S approximately coincides with bullish grabber and stands around 1.1450 area.
Conclusion:
Despite strong bearish background and fundamentals market shows signs of possible upside retracement, initially to 1.1450, potentially to 1.18 area. Still, this retracement will be mostly tactical and not break long-term bearish trend and our expectation of parity.
In short-term perspective our major pattern is weekly grabber. If it will fail – then upside action probably will not happen and market will continue move down but currently we just can’t ignore this setup.
The technical portion of Sive's analysis owes a great deal to Joe DiNapoli's methods, and uses a number of Joe's proprietary indicators. Please note that Sive's analysis is his own view of the market and is not endorsed by Joe DiNapoli or any related companies.
Reuters reports dollar fell against a basket of currencies on Friday, ending a decent month on a sour note as a record-low rise in U.S. employment costs in the second quarter dialed back bets the Federal Reserve would raise interest rates later this year.
The euro rebounded strongly against the greenback following Thursday's losses in the wake of encouraging inflation data in the euro zone. A nearly 3 percent drop in Brent crude oil prices hurt the Norwegian crown, Australian dollar and other commodity-linked currencies, but they turned higher as the greenback stumbled on the disappointing 0.2 percent gain in labor costs in the second quarter.
"It knocked the knees out of the dollar longs. It took everyone by shock," said Boris Schlossberg, managing director of FX strategy at BK Asset Management in New York.
Some analysts had reckoned a rise of at least 0.5 percent in the employment cost index would seal the deal for the Fed to hike rates, perhaps as early as September.
A stronger-than-forecast report on U.S. Midwest factory activity took some of the sting out of the ECI report. The greenback trimmed its losses in late trading following comments from St. Louis Federal Reserve Bank President James Bullard in an interview with the Wall Street Journal, who downplayed the tepid ECI figure.
“We are (in a) good position to make the first normalization move,” Bullard told the paper, adding he was open for a rate hike in September.
The next big moment for the greenback will be the July U.S. jobs report, which, if it shows further jobs growth, may spur traders to add bullish bets on the dollar, analysts said.
Meanwhile, currencies closely linked to oil and commodities prices fell earlier Friday on fears about global oversupply and diminishing demand from China before they recovered on the dollar's downturn.
Now let’s take a look closer view on recent ECI Index that has stunned markets. (By Bloomberg news service)
The 0.2 percent advance was the smallest since records began in 1982 and followed a 0.7 percent increase in the first quarter, the Labor Department said Friday. The agency’s employment cost index, which also includes benefits, also rose 0.2 percent in the second quarter from the prior three months.
Federal Reserve Chair Janet Yellen and her colleagues are counting on rising wages to boost the economy and bring inflation closer to their 2 percent goal. The setback may prompt some officials to call for a delay in raising interest rates for the first time since 2006.
“You’re really not building up the tightness that everyone says,” said Steven Ricchiuto, chief economist at Mizuho Securities USA Inc. in New York, who projected the overall ECI would rise 0.5 percent, among the lowest estimates. “For the people who were saying the Fed’s got to raise rates in September, this is a shock.”
The yield on the benchmark 10-year note dropped to 2.21 percent at 8:47 a.m. in New York from 2.26 percent late on Thursday as investors weighed what impact it would have on Fed policy. Stock-index futures rallied after the report.
Survey Results
The median forecast of 57 economists surveyed projected a 0.6 percent increase for the total ECI index. Last quarter’s reading was lower than all estimates, which ranged from increases of 0.4 percent to 0.8 percent. The gauge measures employer-paid taxes such as Social Security and Medicare in addition to the costs of wages and benefits.
Wages and salaries typically account for about 70 percent of total employment expenses. The ECI data help color the outlook for worker pay after the June employment report showed average hourly earnings rose 2 percent from a year earlier, matching the average since the start of the expansion six years ago.
Because the ECI tracks the same job over time, it removes shifts in the mix of workers across industries, which is a shortcoming of the hourly earnings figures.
Wages of all employees, including government workers, advanced 2.1 percent from the same period in 2014 after climbing 2.6 percent year-over-year in the first quarter.
Private Wages
Private wages were little changed in the second quarter from the previous three months, the worst performance since those records began in 1980.
Wage growth has been slow to respond to indications that the labor market is tightening, which would normally cause managers to feel pressure to boost pay amid a smaller pool of workers.
Job openings climbed in May to 5.36 million, the highest in records dating to the end of 2000, Labor Department data show. There are about 1.6 Americans per available position, matching the lowest level since September 2007.
Surveys of small businesses, at least, show managers aren’t planning on further need to raise wages in order to attract and retain employees.
A net 11 percent of managers in June said they plan to increase pay, the fewest since January 2014, according to 620 responses in a National Federation of Independent Business survey. A net 21 percent said they had already recently boosted worker compensation.
Payroll Gains
Wage growth has been slow to emerge even as the job market strengthens. Employers have added an average 208,300 positions a month this year compared with 259,700 in 2014 that was the best in 15 years. Economists surveyed by Bloomberg project 2015 will show a 220,000 average, according to a poll conducted July 2-8.
The unemployment rate is fast approaching the 5-to-5.2 percent range that Fed policy makers have defined as full employment. The rate dropped to 5.3 percent in June, the lowest since April 2008.
“The labor market continued to improve, with solid job gains and declining unemployment,” Fed policy makers said in a statement Wednesday at the conclusion of their two-day meeting in Washington. “On balance, a range of labor market indicators suggests that underutilization of labor resources has diminished since early this year.”
QIII 2015 Perspectives
Recent data, Fed comments makes us think that US rate hike in September will not lead to the real cycle and consequences of rising rates. Based on the comments, it seems that Fed mostly worries on hurting fragile economy growth rather than scares inflation. We see other signs that support this view. Thus, despite outstanding measures in different countries to increase pace of economy growth – world economy slows down. This is point on continuation of low rates environment. Simultaneously we should point on contradiction between political decisions and economic forces and nature.
That’s being said now we see massive measures to make economy hotter. First is QE is US. Now we see the same program in Japan and EU. But all these countries right now meet intrinsic problems. EU has problems with building of single currency, while Japan has frozen economy growth after rising VAT in 2014. China right now turns in turbulence and we see deterioration as in fundamentals as on financial markets and economy. As a result, such indicators of Globe economy as Copper, Iron Ore and Crude oil continue to decrease.
At first glance situation in US becomes better, but in reality middle class has got just modest benefit from improvements in economy situation. In recent 3-5 years US GDP shows stable growth 2-3% and looks like everything is OK. But we have to understand that this grows stands in environment of growing public debt, exceptional QE program and exacerbation of social inequalities, undermining its sustainability. Fed measures have led to improving situation – public debt starts to grow, job market is improving, low interest rates let people to refinance former debt and reconstituting their savings. At the same time, when these sources mostly were utilized, further domestic consumption growth will be possible only due wage increasing. And this is particularly what we do not see right now. If wages will not start to grow, hardly we will see GDP growth above 3%. That’s why Fed every time attracts attention to this subject.
Another primary condition for stable US economy growth is investment expenditure. Theoretically US companies should invest much due Fed zero rate program. Although expenditures have increased recently but they have not reached yet the top of 2000 year. Companies right now prefer to generate earnings on shares buyback rather than widening of investment programs and activity. Other words, current growth mostly seems artificial that is based on unsustainable fiscal policy but not on real booming of investment activity.
In the eurozone, the single currency’s weakness prompted a slight improvement in economic activity at the start of the year. Despite the rising trend of the last two years,GDP growth is barely 1%, illustrating the structural difficulties facing Europe. The escalation of the Greek crisis demonstrates the inherent contradictions in the construction of the euro. By giving the same currency to countries with widely diverging levels of competitiveness, without providing for a transfer of resources from the most competitive countries to the least competitive countries, the public authorities have created a system which, sooner or later, will become unstable. The least competitive countries are accumulating budgetary and trade deficits that are leading to excessive debt levels. As European citizens are not ready for fiscal union and the political authorities do not want to give up on the euro, Europe is in danger of being wedged in a dilemma that will impede economic growth.
Speaking on inflation we should point that it stands mostly anemic and we do not see real hazard right now. Commodities prices are falling across the board, In the UnitedStates, the consumption price deflator (excluding food and energy), which is the Federal Reserve’s preferred price indicator, remains well below the 2% target. Until wages start to rise
significantly, inflationary pressures will be minimal.
Despite the return of volatility in the second quarter, the fundamentals of the financial markets have not changed. Excessive debt in industrialized countries means that the bases for a strong and sustainable economic recovery are not present. The central banks will therefore continue to pursue very expansive monetary policies and use unconventional means such as quantitative easing. As long as they can keep control of the situation, interest rates will remain very low, especially as
it would be hard for the global economy to support higher interest rates.
Company profits, the second key factor for rising stock markets, are reasonable but not exceptional. While sales have
been impacted by the weak global economic context, profits have fared better thanks to good cost control. The situation is even better when it comes to earnings per share thanks to the share buybacks that many companies have conducted, especially in Anglo- Saxon countries. In the United States, over 80% of recorded earnings have been used to buy back shares or increase the dividend. These financial operations shore up share prices in the short term although the resulting low level of productive investment is a concern for the long term.
Speaking on US and EU monetary policies, USD will stand in favor is we will take a look at US bonds yields, rate hiking expectation and Greece problems and other imbalances between rich and poor EU countries. At the same time, capital flows underpinning the dollar’s strength are mainly short term. By contrast, the respective base balance (current account balance + direct investments) favours the euro.
Last week CFTC data does not show big changes. Shorts-to-All speculative positions still stands around 70% and keeps door open as for rally as for further drop. Thus, we again will rely mostly on technical analysis. Still, data shows while short positions slightly have decreased – long ones vice versa have crept slightly higher. So may be our hopes on deeper upside retracement are not desperate.
Open Interest:
Technicals
Monthly
Trend is bearish on monthly chart, July action does not bring any additional information by far and does not clarify further direction. Based on character of recent activity on the market – recent 3-4 months are definitely a retracement, but it could develop differently. For example, market could return back to lows and then form DRPO Buy and trigger upside retracement or, say, it could move directly to 1.18 right now and form B&B “Sell”. Both scenarios are possible yet.
As we have estimated previously 1.05 is 1.27 extension of huge upside swing in 2005-2008 that also has created large & wide butterfly pattern. Recent action does not quite look like normal butterfly wing, but extension is valid and 1.05 is precisely 1.27 ratio. At the same time we have here another supportive targets, as most recent AB=CD, oversold and 1.27 of recent butterfly.
April has closed and confirmed nicely looking bullish engulfing pattern. We know that most probable target of this pattern is length of the bars counted upside. This will give us approximately 3/8 Fib resistance 1.1810 area. This retracement should be mostly tactical. We continue to expect downward continuation in long-term perspective.
Now about our recent talk on possible B&B or DRPO here. We’ve said that B&B seems more probable. We’ve got close above 3x3 DMA in June, but this barely has happened. July action stands flat and this is not sufficient to get B&B “Sell”. So chances on its appearing are melting as time is passing by. Still we will keep watching for DiNapoli directional patterns but probably they will appear not as fast as we have expected.
Despite whether upside retracement will happen or not our next long-term target stands the same – parity as 1.618 completion point of recent butterfly. Currently we should treat possible bounce up, even to 1.18 area, only as retracement within bear trend.
Weekly
Right now weekly chart is most important for us, since it has major patterns that could become driving factors medium-term perspective. Once we’ve said that if EUR will take 1.08 lows it will erase chance on upside butterfly, and this has happened. At the same time take a look at the picture – market has created nothing but “222” Buy pattern. Now recall puny W&R on daily chart two days ago. When I saw it I thought why it is so small. Now we understand – market just has completed downward AB=CD. As soon as it has done it – it has turned up.
Second issue is MPS1. Price has held above it. It means that bullish trend on weekly chart is still valid. And finally – last week we’ve got bullish grabber again, second one in a row. Also market has perfectly completed our setup on long entry by meaningful retracement inside the body of first grabber. Both grabbers are valid right now. Minimum target that market should reach based on this pattern is former highs around 1.1450 level. If we suggest possible upside AB=CD then our monthly scenario with B&B pattern @ 1.18 does not look as impossible as previously.
Last week we’ve said - don’t ask me how this should happen in current fundamental background. And again – it were fundamentals as last week. Miserable drop in ECI index has pushed EUR 100+ higher and setup has worked perfectly.
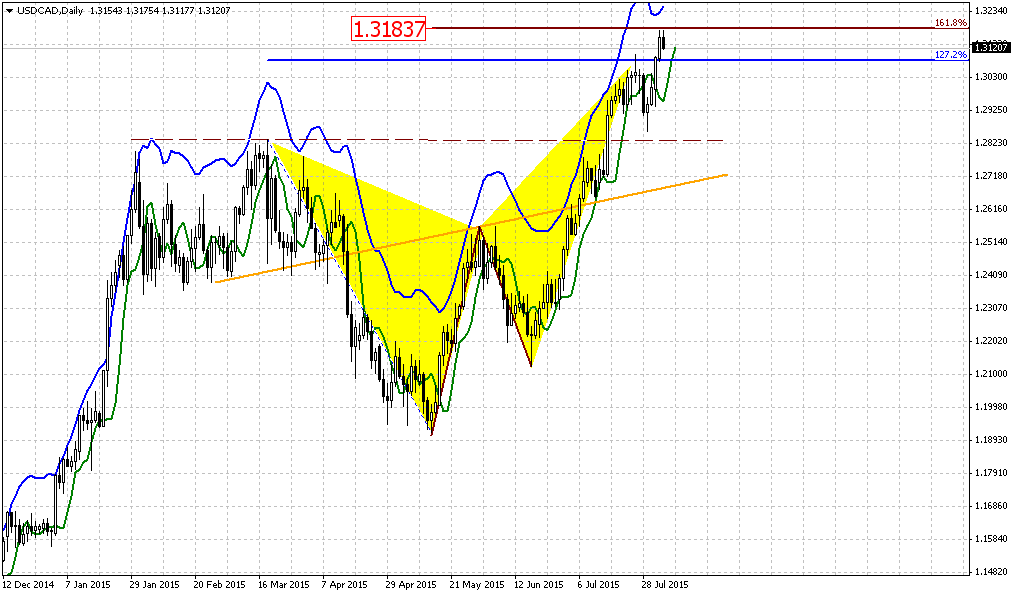
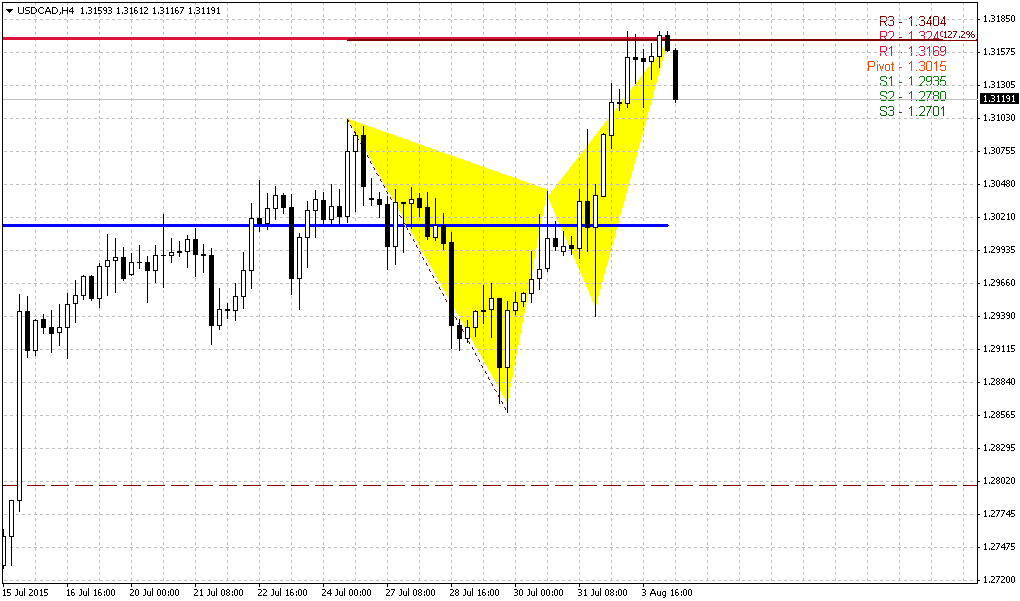
Last week when we’ve said that CAD should reach 1.30 there also were a lot of doubts. But Bank of Canada surprisingly cut the rate and target has been achieved. May be we also will get some event that will make possible to reach the target.
Conversely, any setup could fail, and grabber is not an exception. Failure also will eliminate any concerns on “how EUR will reach 1.18” answer will be nohow. But as soon as setup is still valid we will work with it. It gives us important information that our invalidation point is 1.08 lows. If market will break them – our setup will be destroyed.
Daily
Daily picture does not give us any new inputs by far, but at the same time it does not contradict other time frames as well. Mostly it stands neutral. Here we do not see any patterns, but at the same time trend still holds bullish here. EUR was not able to move higher at the first challenge but it does not mean that upside scenario has failed totally. Probably we will get final clarity on coming week, may be ADP and NFP reports will play their role to become a driving factors. Also here I plot new August pivots.
4-Hour
Since there is nothing special on daily, let’s see what we have on 4-hour chart. First of all take a look at WPP. On coming week it coincides !!! with monthly one right at 1.10 level. So moving above this area will be bullish sign and EUR will open on Monday right around it.
Trend has turned bullish here with strong crossing angle on MACD. Pattern that we will monitor on coming week is reverse H&S pattern. I hope guys, that if you have followed our analysis and entered long, you already have moved your stops to breakeven…
To better understand what will be unnatural behavior for the market, let’s turn to mechanics. Upward action of the head was a reaction on strong support of daily/weekly area that has led to appearing of bullish grabber on weekly chart. Upside action was strong that is typical for right side of the H&S pattern where bulls should control the market. Last week market mostly has spent in retracement where we’ve taken long position and on Friday EUR has skyrocketed. So, H&S looks nice. If market really has intention to go up further, probably it should keep the bottom of right shoulder and definitely should keep the bottom of the head. But, as we know, if market fails at shoulder – almost every time it lead to total failure of H&S, drop below head and as consequence – to the failure of weekly bullish setup. If this will happen, then market will clarify that grabber candle is just reaction on support, minor bounce but not reversal. Hence, probably we will get clarity on next week.
If market is really bullish it has no necessity to return back to the lows, since it already has shown 5/8 retracement after initial swing up. As retracement already has happened, next step should be upside development and challenging of neckline + WPR1 resistance area.
Target of H&S approximately coincides with bullish grabber and stands around 1.1450 area.
Conclusion:
Despite strong bearish background and fundamentals market shows signs of possible upside retracement, initially to 1.1450, potentially to 1.18 area. Still, this retracement will be mostly tactical and not break long-term bearish trend and our expectation of parity.
In short-term perspective our major pattern is weekly grabber. If it will fail – then upside action probably will not happen and market will continue move down but currently we just can’t ignore this setup.
The technical portion of Sive's analysis owes a great deal to Joe DiNapoli's methods, and uses a number of Joe's proprietary indicators. Please note that Sive's analysis is his own view of the market and is not endorsed by Joe DiNapoli or any related companies.
")