Sive Morten
Special Consultant to the FPA
- Messages
- 18,760
Monthly
The dollar fell against the euro on Friday after weak U.S. housing data stoked concerns about the American economy, but notched its first week of broad gains against a basket of major currencies in three weeks. The greenback also rose to to a three-week high versus the yen. The National Association of Realtors said that home sales dropped 5.1 percent to an annual rate of 4.62 million units in January, an 18-month low. The data added to recent weak U.S. economic data on retail sales and homebuilder confidence. "Today's housing data supports the idea of weaker growth," said John Rutledge, chief investment strategist at Safanad, a New York-based private investment firm. The euro hit a high of $1.3759 against the dollar and was last trading up 0.2 percent at $1.3746, marking the dollar's third weekly loss versus the euro. An EU-mediated peace deal between opposition leaders in Ukraine and President Viktor Yanukovich on Friday also supported the euro's gains against the dollar by removing a source of risk for European trade, Rutledge of Safanad said.
Despite its slight decline on the day, the dollar index posted its first weekly gain in three weeks, largely on minutes from the U.S. Federal Reserve's January policy meeting released Wednesday showing that the U.S. central bank's plan to reduce its monthly asset purchases remained intact. Traders had feared that the Fed could slow the pace of its reduction in monthly asset purchases after weak U.S. economic data on hiring, retail sales, and housing. The minutes showed several policymakers wanted to emphasize that their bond-buying program would be trimmed in predictable, $10 billion steps unless the economy's performance surprises them. "Even with the soft U.S. economic data, it's unlikely that we'll see the Fed's taper trajectory change," said Scott Smith, senior corporate foreign exchange trader at Cambridge Mercantile Group in Calgary, Canada.
Against the yen, the dollar edged up 0.29 percent to 102.565 yen, moving away from Thursday's intraday low of 101.67 yen. It hit a peak of 102.83 yen, its strongest level since late January. A jump in the Nikkei index weighed on the safe-haven yen and gave the dollar an additional boost. The Fed's path of cutting its bond-buying program and the Bank of Japan's decision to extend three special loan facilities by one year on Tuesday have strengthened the dollar against the yen, said Rutledge of Safanad. Japan still has the fire hose turned on for quantitative easing, while the Fed is shutting off," he said. The BOJ's extension of the programs, done in an effort to buoy economic growth, signaled the country's resolve to maintain its expansionary monetary policy.
Traders are watching for developments from this weekend's Group of 20 meeting of finance ministers and central bank chiefs in Sydney, where global growth and recent turmoil in emerging markets are expected to be in focus. Emerging market officials are pushing for a discussion of the impact of the Fed's stimulus withdrawal on their economies, a top Russian central banker said on Friday. But the Fed's focus is likely to remain on U.S. economic conditions rather than the implications of tapering on emerging markets, analysts said. "The Fed will not be moved from its path based on what is discussed at this meeting," said Lane Newman, director of foreign exchange at ING Capital Markets in New York.
B]Technical[/B]
Trend holds bullish on monthly time frame and price has played back all January decline. Recent price action confirms our suggestion that until market stands above 1.33 and coiling around current levels – nothing clear about possible direction. As upward breakout as downward reversal could happen. Fundamental data of previous week does not suggest drastical changing of long-term sentiment and does not clarify absolutely possible direction. Even analysts’ opinion are not unique on recent NFP and other data. Although it was worse than expected, but there was low-key negative reaction,
As we’ve noted in our previous EUR research, YPP will play it’s role sooner or later, and that has happened. Take a look, that upward bounce has started precisely from 1.3475 level. Now the major question stands as follows – whether this upward action is a confirmation of long-term bullish sentiment or just a respect of YPP first touch.
If we will follow to market mechanics, we’ll see that currently market should not show any solid retracement down. Any move of this kind should be treated as market weakness and it will increase probability of reversal down. Take a look that as market has hit minor 0.618 AB-CD extension target right at rock hard resistance – Fib level and Agreement and former yearly PR1, it has shown reasonable bounce down to 1.33. As retracement after 0.618 target already has happened, it is unlogical and unreasonable to see another deep bounce and if it will happen - it will look suspicious. Right now market still stands on the edge here. From one point of view price has failed to break up in 2013, but from another one – it still stands very close to previous highs. Now we have additional detail here – market is forming flag consolidation right under significant resistance. In most cases this suggests attempt of upper breakout and EUR just accumulates energy for it. Second moment – if this was true revresal down from AB-CD 0.618 target market should not return right back up to it and particularly should not form any bullish consolidation right below it. Thus, coiling around resistance could mean that market is preparing for challenging it. Another sign is that price has held above YPP. This tells that sentiment is still bullish here and currently overall situation on monthly chart has more bullish spirit rather than bearish.

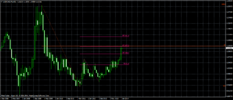
Weekly
Weekly chart now shows greater odds in favor of upward continuation, depsite how extended it will be. We will focus on nearest butterfly target – 1.27 around 1.3960 area. Although situation remains tricky and here is enough different issues that make overall context difficult.
Here what we have – Butterfly “Sell” is forming right around major monthly resistance, price still can’t pass through it. Current AB-CD pattern has reached minor 0.618 target, but CD leg is much flatter than AB and this is the sign of weakness. Usually this leads to reversal at final AB=CD point. Trend stands bearish and we’ve got bearish divergence here right at monthly resistance.
From bearish perspective our ideal criteria of reversal was to see butterfly completion and then – move below 1.33 lows. In this case we will get reversal swing on weekly chart that could become at least something that could confirm downward ambitions.
Speaking about bullish signs, we can point on some moments. Although we’ve got bearish patterns, say, engulfing, divergence, but market does not follow it as usual. Yes, price has shown minor retracement down, but this also could be due AB=CD 1.618 inner butterfly extension and monthly resistance. Here former MPR1 stand as well. Second – recall what we’ve said in Dec-Jan:
“To speak about upward continuation o big scale, we need to get fulfilling of two conditions as well – market should coil around previous tops without significant retracement...”
And this is what we have right now. Market has bounced up from YPP, moved above MPP. Althuogh trend has turned bearish we see tight consolidation that takes the shape of flag right below resistance area. In January price has held above MPS1 and this also could be an indication that long-term bullish trend is still valid. That’s being said, although we have some contradictive moments here, I would suggest that bullish signs have more value right now, mostly because they prevent further development of bearish patterns. They are not just opposite patterns that have been formed side-by-side. It looks like most recent bullish signs a kind of vanishing and preventing normal development of earlier bearish patterns. And now we also see upward breakout of flag consolidation. Actually price shows upward action at bearish MACD trend and this could be a bullish dynamic pressure that suggests at least reaching of previous highs
Speaking about more extended action, if upward continuation will be long term – we need to see move above 1.3980 – butterfly 1.27 target first. In this case next target will be right around 1.43-1.44 – weekly AB-CD, Yearly PR1 and butterfly 1.618.

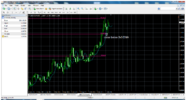
Daily
Trend is bullish on daily chart, market is not at oversold. Upward action looks very nice. As you can see EUR finally has completed first reversal swing that is greater than previous swing down. Right now I just want remind you our previous thought that recent action since mid December does not look like reversal. When market was not able to pass through 1.3850 highs for second time and has formed W&R we could count on real reversal down, but current action hardly to call as long-term reversal action. It is more look like preparation for upward jump. We already have mentioned downward channel (or flag) on weekly chart. Trend here has turned bullish and market jumped out from Yearly PP. This is also solid Fib support around YPP.
Thus, first stage of our trading plan (we’ve discussed it in our research on 10th of February) that has suggested appearing of reversal swing was completed. Another important moment here is 0.618 target of AB-CD – now it stands below daily overbought and can be reached. Our next step is to choose right area for long entry

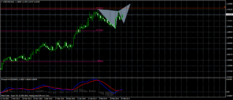
4-hour
As you can see, in short-term perspective market has completed AB=CD pattern and has turned to retracement down. Currently there is a high probability that this will be 2-leg AB=CD move down. First is because this is first reversal swing and AB=CD target, that suggests solid reaction. And second - because we’ve got two side-by-side bearish grabbers. They assume taking out of 1.3690 lows. If this will happen, then market probably will continue move to AB=CD downward target. This level, in turn almost coincide with 4-hour K-support area around 1.3640-1.3660 and creates an Agreement. This makes this level solid resistance and this is our first level to watch for long entry on EUR.

Conclusion:
On long-term charts price still coiling around edge point and currently chances exist as for upward breakout as for downward reversal. To rely on direction whatever it will be, we need to get clear patterns that could confirm it and point extended targets for us. But we do not have them yet, although recent weeks show some action that could inspire bulls a bit.
In shorter-term, EUR shows not bad upward action that has nearest target around 1.3850. As soon as market will give as downward retracement – we will search for possibility to buy.
The technical portion of Sive's analysis owes a great deal to Joe DiNapoli's methods, and uses a number of Joe's proprietary indicators. Please note that Sive's analysis is his own view of the market and is not endorsed by Joe DiNapoli or any related companies.
The dollar fell against the euro on Friday after weak U.S. housing data stoked concerns about the American economy, but notched its first week of broad gains against a basket of major currencies in three weeks. The greenback also rose to to a three-week high versus the yen. The National Association of Realtors said that home sales dropped 5.1 percent to an annual rate of 4.62 million units in January, an 18-month low. The data added to recent weak U.S. economic data on retail sales and homebuilder confidence. "Today's housing data supports the idea of weaker growth," said John Rutledge, chief investment strategist at Safanad, a New York-based private investment firm. The euro hit a high of $1.3759 against the dollar and was last trading up 0.2 percent at $1.3746, marking the dollar's third weekly loss versus the euro. An EU-mediated peace deal between opposition leaders in Ukraine and President Viktor Yanukovich on Friday also supported the euro's gains against the dollar by removing a source of risk for European trade, Rutledge of Safanad said.
Despite its slight decline on the day, the dollar index posted its first weekly gain in three weeks, largely on minutes from the U.S. Federal Reserve's January policy meeting released Wednesday showing that the U.S. central bank's plan to reduce its monthly asset purchases remained intact. Traders had feared that the Fed could slow the pace of its reduction in monthly asset purchases after weak U.S. economic data on hiring, retail sales, and housing. The minutes showed several policymakers wanted to emphasize that their bond-buying program would be trimmed in predictable, $10 billion steps unless the economy's performance surprises them. "Even with the soft U.S. economic data, it's unlikely that we'll see the Fed's taper trajectory change," said Scott Smith, senior corporate foreign exchange trader at Cambridge Mercantile Group in Calgary, Canada.
Against the yen, the dollar edged up 0.29 percent to 102.565 yen, moving away from Thursday's intraday low of 101.67 yen. It hit a peak of 102.83 yen, its strongest level since late January. A jump in the Nikkei index weighed on the safe-haven yen and gave the dollar an additional boost. The Fed's path of cutting its bond-buying program and the Bank of Japan's decision to extend three special loan facilities by one year on Tuesday have strengthened the dollar against the yen, said Rutledge of Safanad. Japan still has the fire hose turned on for quantitative easing, while the Fed is shutting off," he said. The BOJ's extension of the programs, done in an effort to buoy economic growth, signaled the country's resolve to maintain its expansionary monetary policy.
Traders are watching for developments from this weekend's Group of 20 meeting of finance ministers and central bank chiefs in Sydney, where global growth and recent turmoil in emerging markets are expected to be in focus. Emerging market officials are pushing for a discussion of the impact of the Fed's stimulus withdrawal on their economies, a top Russian central banker said on Friday. But the Fed's focus is likely to remain on U.S. economic conditions rather than the implications of tapering on emerging markets, analysts said. "The Fed will not be moved from its path based on what is discussed at this meeting," said Lane Newman, director of foreign exchange at ING Capital Markets in New York.
B]Technical[/B]
Trend holds bullish on monthly time frame and price has played back all January decline. Recent price action confirms our suggestion that until market stands above 1.33 and coiling around current levels – nothing clear about possible direction. As upward breakout as downward reversal could happen. Fundamental data of previous week does not suggest drastical changing of long-term sentiment and does not clarify absolutely possible direction. Even analysts’ opinion are not unique on recent NFP and other data. Although it was worse than expected, but there was low-key negative reaction,
As we’ve noted in our previous EUR research, YPP will play it’s role sooner or later, and that has happened. Take a look, that upward bounce has started precisely from 1.3475 level. Now the major question stands as follows – whether this upward action is a confirmation of long-term bullish sentiment or just a respect of YPP first touch.
If we will follow to market mechanics, we’ll see that currently market should not show any solid retracement down. Any move of this kind should be treated as market weakness and it will increase probability of reversal down. Take a look that as market has hit minor 0.618 AB-CD extension target right at rock hard resistance – Fib level and Agreement and former yearly PR1, it has shown reasonable bounce down to 1.33. As retracement after 0.618 target already has happened, it is unlogical and unreasonable to see another deep bounce and if it will happen - it will look suspicious. Right now market still stands on the edge here. From one point of view price has failed to break up in 2013, but from another one – it still stands very close to previous highs. Now we have additional detail here – market is forming flag consolidation right under significant resistance. In most cases this suggests attempt of upper breakout and EUR just accumulates energy for it. Second moment – if this was true revresal down from AB-CD 0.618 target market should not return right back up to it and particularly should not form any bullish consolidation right below it. Thus, coiling around resistance could mean that market is preparing for challenging it. Another sign is that price has held above YPP. This tells that sentiment is still bullish here and currently overall situation on monthly chart has more bullish spirit rather than bearish.
Weekly
Weekly chart now shows greater odds in favor of upward continuation, depsite how extended it will be. We will focus on nearest butterfly target – 1.27 around 1.3960 area. Although situation remains tricky and here is enough different issues that make overall context difficult.
Here what we have – Butterfly “Sell” is forming right around major monthly resistance, price still can’t pass through it. Current AB-CD pattern has reached minor 0.618 target, but CD leg is much flatter than AB and this is the sign of weakness. Usually this leads to reversal at final AB=CD point. Trend stands bearish and we’ve got bearish divergence here right at monthly resistance.
From bearish perspective our ideal criteria of reversal was to see butterfly completion and then – move below 1.33 lows. In this case we will get reversal swing on weekly chart that could become at least something that could confirm downward ambitions.
Speaking about bullish signs, we can point on some moments. Although we’ve got bearish patterns, say, engulfing, divergence, but market does not follow it as usual. Yes, price has shown minor retracement down, but this also could be due AB=CD 1.618 inner butterfly extension and monthly resistance. Here former MPR1 stand as well. Second – recall what we’ve said in Dec-Jan:
“To speak about upward continuation o big scale, we need to get fulfilling of two conditions as well – market should coil around previous tops without significant retracement...”
And this is what we have right now. Market has bounced up from YPP, moved above MPP. Althuogh trend has turned bearish we see tight consolidation that takes the shape of flag right below resistance area. In January price has held above MPS1 and this also could be an indication that long-term bullish trend is still valid. That’s being said, although we have some contradictive moments here, I would suggest that bullish signs have more value right now, mostly because they prevent further development of bearish patterns. They are not just opposite patterns that have been formed side-by-side. It looks like most recent bullish signs a kind of vanishing and preventing normal development of earlier bearish patterns. And now we also see upward breakout of flag consolidation. Actually price shows upward action at bearish MACD trend and this could be a bullish dynamic pressure that suggests at least reaching of previous highs
Speaking about more extended action, if upward continuation will be long term – we need to see move above 1.3980 – butterfly 1.27 target first. In this case next target will be right around 1.43-1.44 – weekly AB-CD, Yearly PR1 and butterfly 1.618.
Daily
Trend is bullish on daily chart, market is not at oversold. Upward action looks very nice. As you can see EUR finally has completed first reversal swing that is greater than previous swing down. Right now I just want remind you our previous thought that recent action since mid December does not look like reversal. When market was not able to pass through 1.3850 highs for second time and has formed W&R we could count on real reversal down, but current action hardly to call as long-term reversal action. It is more look like preparation for upward jump. We already have mentioned downward channel (or flag) on weekly chart. Trend here has turned bullish and market jumped out from Yearly PP. This is also solid Fib support around YPP.
Thus, first stage of our trading plan (we’ve discussed it in our research on 10th of February) that has suggested appearing of reversal swing was completed. Another important moment here is 0.618 target of AB-CD – now it stands below daily overbought and can be reached. Our next step is to choose right area for long entry
4-hour
As you can see, in short-term perspective market has completed AB=CD pattern and has turned to retracement down. Currently there is a high probability that this will be 2-leg AB=CD move down. First is because this is first reversal swing and AB=CD target, that suggests solid reaction. And second - because we’ve got two side-by-side bearish grabbers. They assume taking out of 1.3690 lows. If this will happen, then market probably will continue move to AB=CD downward target. This level, in turn almost coincide with 4-hour K-support area around 1.3640-1.3660 and creates an Agreement. This makes this level solid resistance and this is our first level to watch for long entry on EUR.
Conclusion:
On long-term charts price still coiling around edge point and currently chances exist as for upward breakout as for downward reversal. To rely on direction whatever it will be, we need to get clear patterns that could confirm it and point extended targets for us. But we do not have them yet, although recent weeks show some action that could inspire bulls a bit.
In shorter-term, EUR shows not bad upward action that has nearest target around 1.3850. As soon as market will give as downward retracement – we will search for possibility to buy.
The technical portion of Sive's analysis owes a great deal to Joe DiNapoli's methods, and uses a number of Joe's proprietary indicators. Please note that Sive's analysis is his own view of the market and is not endorsed by Joe DiNapoli or any related companies.