Sive Morten
Special Consultant to the FPA
- Messages
- 18,819
Fundamentals
This week was relatively quiet, the whole market and EUR in particular spends time in very tight range. If somewhere we had some setups - they were mostly short-term and tactical. Low volatility on the FX market is not something new - it is dropping since the last year, and now it becomes the factor that investors pay more and more attention to.
It is needless to say that silence on the market was due lack of important statistics and mass expectation of G20 results and news. Definitely there is a lot of new information ahead. Personally for me the shock news is that V. Putin takes tea in its own thermos mug. This is silent scandal, just imagine what does it mean and what shadow this incident puts on Japan as invite side. It is serious reasons stands behind and promise nothing good to them.
But official news - is restarting of US/Sino tariffs negotiations. Our soap opera continues. Anyway, restarting of conversation doesn't mean the deal. Negotiations between the world’s two largest economies have been fraught, however, and traders and analysts caution that a resolution at the G20 summit is far from certain.
“I’m personally quite pessimistic on any deal being made,” said Jordan Rochester, G10 forex strategist at Nomura. However, any falls in the dollar are unlikely to become sustained and so “the euro at $1.14 is a sell,” Rochester said.
This story gradually turns to some backstage noise as it shows no visible impact on US economy, working more like a theoretical factor, but somehow everybody sure that it definitely makes negative impact. Thus, it seems that the line of US dollar bearish factors becomes thinner. And now we have just two of them - Iran turmoil and Fed dovish policy. Iran topic is done - as we've said nothing happens. Eliminating of US/China tension should bring some relief as on Gold market as theoretically on EUR, because it was rising as well on a background of potential weakness of US economy due tariffs . At least this is how investors were treating this.
Friday PCE data was in a row with expectations but markets still take it as confirmation of rate cut in July.
The core U.S. personal consumption expenditure price index rose 0.2% in May, as expected, reinforcing investor expectations that the Federal Reserve will cut rates by 25 basis points to 2.25% at the next meeting.
“In the big themes today, the data doesn’t change the July cut,” said Kenneth Broux, head of corporate research at Societe Generale.
While inflation expectations in the United States and Europe have declined in recent weeks, as measured by forward-starting swaps, U.S. gauges have stabilised after the Federal Reserve opened the door to rate cuts last week.
In comparison, policy interest rates in Europe are already in negative territory and Europe’s most widely watched measure of inflation expectations - the five-year, five-year forward rate - has started declining again.
“The elbow-room for the ECB to ease policy is far more limited than the (U.S.) Fed and that is weighing on the euro,” said Esther Reichelt, FX strategist at Commerzbank.
Now is about volatility - take a look the chart first. FX market volatility stands at record lows.
Currency volatility near 4-1/2 year lows
Some trading veterans said it reminded them of conditions before the 2008 global financial crisis erupted.
Deutsche Bank’s Currency Volatility Index has declined since 2017 to its lowest in 4-1/2 years and currently stands at about two-thirds its levels of early 2019 and less than half the peaks of three years ago.
Low ‘vol’, shorthand for implied volatility gauges embedded in options markets, reflects relative order in exchange rates — markets without the big pricing gaps that offer money-making opportunities and increase demand for hedging products.
Just how resistant currency markets are to shake-ups was evident on June 18, the day European Central Bank President Mario Draghi shocked markets by signalling more rate cuts may be coming. He sent 10-year German bond yields to record lows, while French borrowing costs fell below 0% for the first time and European shares jumped 2%.
But the euro? It slipped 0.4%, a tiny move by historical standards and only its fourth-largest daily change in June.
Euro/dollar, the world’s biggest currency pair, has not traded below $1.10 or above $1.16 since October, a range of little more than 4%, even with trade war and recession threats and the U.S. Federal Reserve’s U-turn on interest rates.
In contrast, volatility in U.S. Treasuries has surged to its highest since April 2017, while the equity market “fear” index VIX remains above multi-year lows plumbed in 2017.
“The Fed is totally in play and rates are moving drastically and there’s no translation to FX. It’s odd to see,” said Russell LaScala, Deutsche Bank’s co-head of foreign exchange. “It’s become this very sleepy asset class.”
One question is whether this unusual calm could end in panic, as in March 2008 when Deutsche’s volatility index rocketed to over 12, after spending most of 2007 stuck below 7.
Options show little sign of that. One-year implied euro-dollar vol has slumped to 6, from nearly 8 in January.
But while there’s no shortage of political and economic uncertainties arguing for a volatility resurgence, the change of market behaviour could sow the seeds of its eventual end. Mostly low vol leads to decrease volumes of hedge trades, increasing "sell" options strategies to earn the options's premiums while market stands in predefined range.
Low volatility has been bad for bank earnings. Daily average currency trading volumes have been down about 10% annual from last year in recent months on platforms such as CLS.
“You can’t make any money out of something that doesn’t move. Low volatility is fine but very low volatility is not,” said Richard Benson, head of portfolio investments at asset manager Millennium Global.
With investors on the sidelines, traders are spending more time at client lunches and less time transacting.
James, an FX trader for a British bank who asked for his surname not to be used, sometimes listens to music at his desk.
“Looking at these stubbornly stable prices on my screen ... It’s like watching paint dry,” he lamented.
Despite that vol is dropping for considerable time already - we suggest that this is temporal moment. US is coming to elections and any result - as D. Trump win ( as we sure will happen) as D. Trump loss should make a lot of political noise and volatility will rise. Closer to the end of 2nd term of D. Trump presidency we expect big collapse on US Dollar and shake for the global currency system, so keep an eye on Gold...
CFTC data puts the doubt under recent EUR rally as net short position has increased slightly this week. Actually short position has not dropped too much, even on recent upside rally. It means that investors are skeptical on upside reversal and doubt on the term of this rally. This data doesn't let us to conclude on positive mood on the market.

Source: cftc.gov
Charting by Investing.com
Finally, fresh comments on recent ECB decision from the Fathom Consulting.
Fathom’s Economic Sentiment Indicators (ESIs) distill GDP numerous measures of economic confidence into a single composite indicator for each economy. In May, the euro area ESI rose to 0.5%, up from 0.3% in the previous month, although the indicator remains some way below the levels we saw through 2017 and the early part of last year.
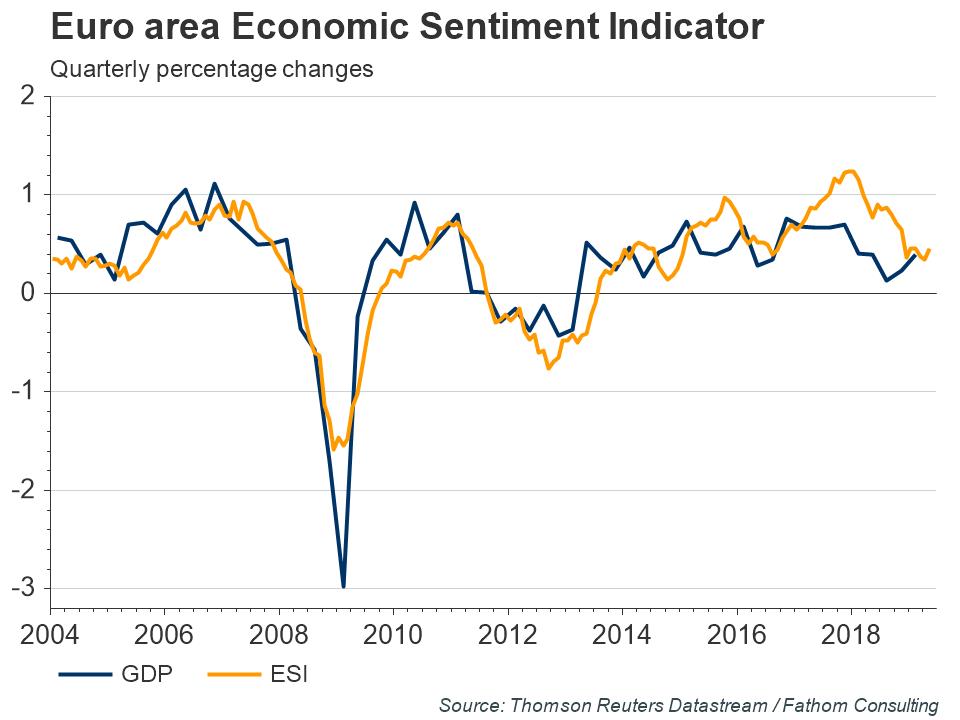
Encouragingly, the ESIs for the currency bloc’s four largest economies all firmed last month; the indicator for Italy rose 0.3 percentage points and climbed out of negative territory for the first time since January.
Euro area GDP growth rebounded to 0.4% in the first quarter of this year and, while the currency bloc may struggle to maintain this rate for the remainder of the year, there are signs that growth has stabilised, and that the expansion is likely to continue.
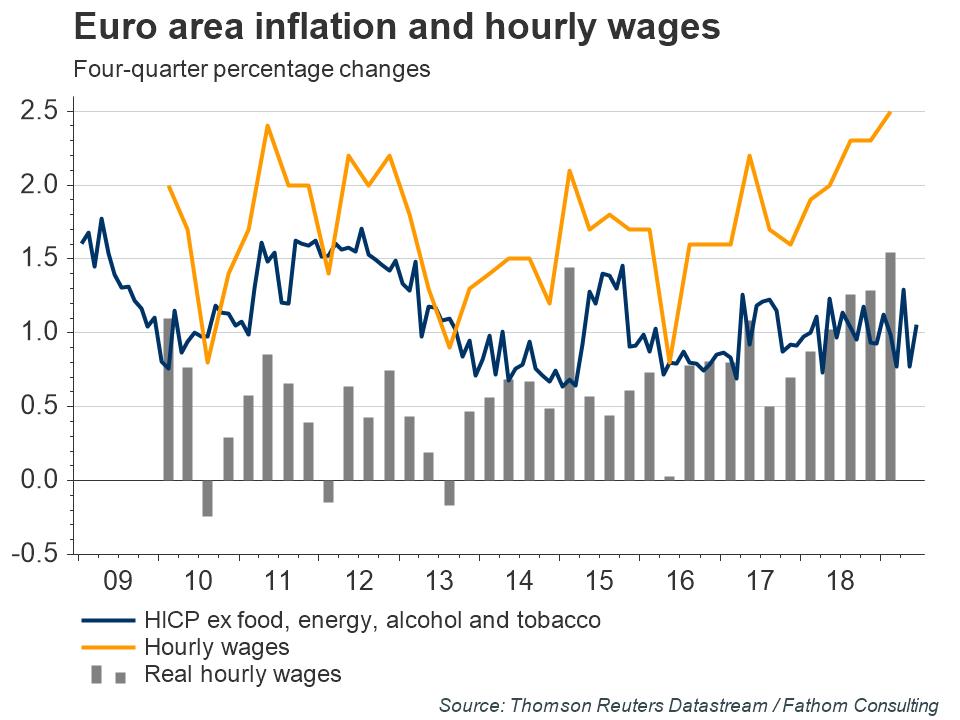
Nevertheless, core inflation remains weak and continues to hover around 1%. This weakness looks to have pushed the ECB towards action and in a dovish speech last week, the central bank’s President Mario Draghi signalled a potential change in policy stance. While previous forward guidance had suggested that the central bank would act if the outlook deteriorated, Mr Draghi stressed a need to act unless inflation rises. Following his remarks, bond yields fell across the currency bloc.
While rising wages and tight labour markets suggest that underlying inflation will eventually firm, it is likely to remain substantially below target in the near term and Fathom now expects the central bank to act sooner rather than later.
If the central bank does to choose to ease, then it retains a number of options ranging from pushing out the expected timeline for future rate hikes, to cutting the deposit rate further, or even bolder moves such as restarting asset purchases or cutting the main refinancing and marginal lending rates.
Technicals
Monthly
As you understand, quiet standing brings nothing new to our technical view, especially on longer-term charts. We hope that coming NFP data, IIQ GDP in July and Fed meeting will shake the market a bit.
Monthly chart creates no new range and stands inside one that was formed in the beginning of the month. So the intrigue still stands around major support where price stands right now.
Our nearest culmination point is Fed July meeting which should clarify whether we right or wrong in our hypothesis. Our plan (according to fundamental issues) tends to idea of downside breakout.
As we've said last week, changes are still look insignificant, trend stands bearish. Monthly chart is rather large and any upside action will have retracement feature, until 1.26 area breakout. The first meaningful resistance here stands around YPP of 1.1740 area, which approximately agrees with 3/8 Fib resistance.

Weekly
Just take a look at the range of this week and everything becomes clear, nothing new we could say on weekly chart as well.
Price still stands around nearest Fib resistance level on 1.1376
As investors hew to Fed policy, we keep scenario with potential bullish reversal pattern on weekly chart, first time we introduced few weeks ago. This is reverse H&S pattern. As road to the head's bottom was choppy as upside road to neckline also could be choppy.
Weekly trend stands bullish and market hits our first Fib resistance level of 1.1376. Still, major upside target is neckline around 1.16 K-resistance area.
The specific of H&S pattern is its dual character. It keeps door open for both scenarios. Upside scenario is based on reverse H&S while downside scenario could be confirmed by its failure, which happens around Right arm bottom. But now we're on the way to the neckline.

Daily
Daily chart shows bore picture at first glance. Flat standing for the whole week, forming inside sessions. Still, what we really could get from this? First is, standing in tight range means contraction, the process of energy building which sooner rather than later should lead to expansion - energy relief. It means that stand at the eve of breakout. in fact, the shape of the flag tells the same. Besides, all candles inside the flag are high waves.
Second - too weak reaction on strong daily resistance. Market has not reached even 1.1320 area, which is not too deep and absolutely natural comfortable support in current situation. We were waiting for the whole week when market shows this final downside swing, but this has not happened.
Although we've applied 3-period rule and called to not keep any shorts anymore, but current situation mostly tells on indecision or waiting for something. Speculative short positions were increased this week. This is the game till the breakout as market will follow in the same direction. Standing inside the flag gives us no suggestion on direction. It means that we will have to act right in the moment of breakout or when it already will happen. July Pivot stands at 1.1313

Intraday
It is very difficult to offer something here. "222" Sell pattern, which was formed is almost done as minimal target has been hit. I keep OP @ 1.1325 for some case, if AB=CD pattern still will be formed. Overall situation leads us to following conclusion - conservative approach suggests do nothing until breakout. For active traders we see only one way. As we do not have any patterns inside the flag, stop entry orders could be used outside its border. Thus, "Buy Stop" order could be placed slightly below A point, while "Stop Sell" - around "B" point. That should led to step in during breakout.
Alternatively, as overall technical picture doesn't look very attractive on EUR, you could search more transparent setups on other currencies.

Conclusion:
EUR/USD situation now is more interesting in long-term perspective, while in short-term perspective it doesn't show any clear setup yet. As a result, our today's report is mostly dedicated to fundamental issues.
The technical portion of Sive's analysis owes a great deal to Joe DiNapoli's methods, and uses a number of Joe's proprietary indicators. Please note that Sive's analysis is his own view of the market and is not endorsed by Joe DiNapoli or any related companies.
This week was relatively quiet, the whole market and EUR in particular spends time in very tight range. If somewhere we had some setups - they were mostly short-term and tactical. Low volatility on the FX market is not something new - it is dropping since the last year, and now it becomes the factor that investors pay more and more attention to.
It is needless to say that silence on the market was due lack of important statistics and mass expectation of G20 results and news. Definitely there is a lot of new information ahead. Personally for me the shock news is that V. Putin takes tea in its own thermos mug. This is silent scandal, just imagine what does it mean and what shadow this incident puts on Japan as invite side. It is serious reasons stands behind and promise nothing good to them.
But official news - is restarting of US/Sino tariffs negotiations. Our soap opera continues. Anyway, restarting of conversation doesn't mean the deal. Negotiations between the world’s two largest economies have been fraught, however, and traders and analysts caution that a resolution at the G20 summit is far from certain.
“I’m personally quite pessimistic on any deal being made,” said Jordan Rochester, G10 forex strategist at Nomura. However, any falls in the dollar are unlikely to become sustained and so “the euro at $1.14 is a sell,” Rochester said.
This story gradually turns to some backstage noise as it shows no visible impact on US economy, working more like a theoretical factor, but somehow everybody sure that it definitely makes negative impact. Thus, it seems that the line of US dollar bearish factors becomes thinner. And now we have just two of them - Iran turmoil and Fed dovish policy. Iran topic is done - as we've said nothing happens. Eliminating of US/China tension should bring some relief as on Gold market as theoretically on EUR, because it was rising as well on a background of potential weakness of US economy due tariffs . At least this is how investors were treating this.
Friday PCE data was in a row with expectations but markets still take it as confirmation of rate cut in July.
The core U.S. personal consumption expenditure price index rose 0.2% in May, as expected, reinforcing investor expectations that the Federal Reserve will cut rates by 25 basis points to 2.25% at the next meeting.
“In the big themes today, the data doesn’t change the July cut,” said Kenneth Broux, head of corporate research at Societe Generale.
While inflation expectations in the United States and Europe have declined in recent weeks, as measured by forward-starting swaps, U.S. gauges have stabilised after the Federal Reserve opened the door to rate cuts last week.
In comparison, policy interest rates in Europe are already in negative territory and Europe’s most widely watched measure of inflation expectations - the five-year, five-year forward rate - has started declining again.
“The elbow-room for the ECB to ease policy is far more limited than the (U.S.) Fed and that is weighing on the euro,” said Esther Reichelt, FX strategist at Commerzbank.
Now is about volatility - take a look the chart first. FX market volatility stands at record lows.
Currency volatility near 4-1/2 year lows
Some trading veterans said it reminded them of conditions before the 2008 global financial crisis erupted.
Deutsche Bank’s Currency Volatility Index has declined since 2017 to its lowest in 4-1/2 years and currently stands at about two-thirds its levels of early 2019 and less than half the peaks of three years ago.
Low ‘vol’, shorthand for implied volatility gauges embedded in options markets, reflects relative order in exchange rates — markets without the big pricing gaps that offer money-making opportunities and increase demand for hedging products.
Just how resistant currency markets are to shake-ups was evident on June 18, the day European Central Bank President Mario Draghi shocked markets by signalling more rate cuts may be coming. He sent 10-year German bond yields to record lows, while French borrowing costs fell below 0% for the first time and European shares jumped 2%.
But the euro? It slipped 0.4%, a tiny move by historical standards and only its fourth-largest daily change in June.
Euro/dollar, the world’s biggest currency pair, has not traded below $1.10 or above $1.16 since October, a range of little more than 4%, even with trade war and recession threats and the U.S. Federal Reserve’s U-turn on interest rates.
In contrast, volatility in U.S. Treasuries has surged to its highest since April 2017, while the equity market “fear” index VIX remains above multi-year lows plumbed in 2017.
“The Fed is totally in play and rates are moving drastically and there’s no translation to FX. It’s odd to see,” said Russell LaScala, Deutsche Bank’s co-head of foreign exchange. “It’s become this very sleepy asset class.”
One question is whether this unusual calm could end in panic, as in March 2008 when Deutsche’s volatility index rocketed to over 12, after spending most of 2007 stuck below 7.
Options show little sign of that. One-year implied euro-dollar vol has slumped to 6, from nearly 8 in January.
But while there’s no shortage of political and economic uncertainties arguing for a volatility resurgence, the change of market behaviour could sow the seeds of its eventual end. Mostly low vol leads to decrease volumes of hedge trades, increasing "sell" options strategies to earn the options's premiums while market stands in predefined range.
Low volatility has been bad for bank earnings. Daily average currency trading volumes have been down about 10% annual from last year in recent months on platforms such as CLS.
“You can’t make any money out of something that doesn’t move. Low volatility is fine but very low volatility is not,” said Richard Benson, head of portfolio investments at asset manager Millennium Global.
With investors on the sidelines, traders are spending more time at client lunches and less time transacting.
James, an FX trader for a British bank who asked for his surname not to be used, sometimes listens to music at his desk.
“Looking at these stubbornly stable prices on my screen ... It’s like watching paint dry,” he lamented.
Despite that vol is dropping for considerable time already - we suggest that this is temporal moment. US is coming to elections and any result - as D. Trump win ( as we sure will happen) as D. Trump loss should make a lot of political noise and volatility will rise. Closer to the end of 2nd term of D. Trump presidency we expect big collapse on US Dollar and shake for the global currency system, so keep an eye on Gold...
CFTC data puts the doubt under recent EUR rally as net short position has increased slightly this week. Actually short position has not dropped too much, even on recent upside rally. It means that investors are skeptical on upside reversal and doubt on the term of this rally. This data doesn't let us to conclude on positive mood on the market.
Source: cftc.gov
Charting by Investing.com
Finally, fresh comments on recent ECB decision from the Fathom Consulting.
Fathom’s Economic Sentiment Indicators (ESIs) distill GDP numerous measures of economic confidence into a single composite indicator for each economy. In May, the euro area ESI rose to 0.5%, up from 0.3% in the previous month, although the indicator remains some way below the levels we saw through 2017 and the early part of last year.
Encouragingly, the ESIs for the currency bloc’s four largest economies all firmed last month; the indicator for Italy rose 0.3 percentage points and climbed out of negative territory for the first time since January.
Euro area GDP growth rebounded to 0.4% in the first quarter of this year and, while the currency bloc may struggle to maintain this rate for the remainder of the year, there are signs that growth has stabilised, and that the expansion is likely to continue.
Nevertheless, core inflation remains weak and continues to hover around 1%. This weakness looks to have pushed the ECB towards action and in a dovish speech last week, the central bank’s President Mario Draghi signalled a potential change in policy stance. While previous forward guidance had suggested that the central bank would act if the outlook deteriorated, Mr Draghi stressed a need to act unless inflation rises. Following his remarks, bond yields fell across the currency bloc.
While rising wages and tight labour markets suggest that underlying inflation will eventually firm, it is likely to remain substantially below target in the near term and Fathom now expects the central bank to act sooner rather than later.
If the central bank does to choose to ease, then it retains a number of options ranging from pushing out the expected timeline for future rate hikes, to cutting the deposit rate further, or even bolder moves such as restarting asset purchases or cutting the main refinancing and marginal lending rates.
Technicals
Monthly
As you understand, quiet standing brings nothing new to our technical view, especially on longer-term charts. We hope that coming NFP data, IIQ GDP in July and Fed meeting will shake the market a bit.
Monthly chart creates no new range and stands inside one that was formed in the beginning of the month. So the intrigue still stands around major support where price stands right now.
Our nearest culmination point is Fed July meeting which should clarify whether we right or wrong in our hypothesis. Our plan (according to fundamental issues) tends to idea of downside breakout.
As we've said last week, changes are still look insignificant, trend stands bearish. Monthly chart is rather large and any upside action will have retracement feature, until 1.26 area breakout. The first meaningful resistance here stands around YPP of 1.1740 area, which approximately agrees with 3/8 Fib resistance.
Weekly
Just take a look at the range of this week and everything becomes clear, nothing new we could say on weekly chart as well.
Price still stands around nearest Fib resistance level on 1.1376
As investors hew to Fed policy, we keep scenario with potential bullish reversal pattern on weekly chart, first time we introduced few weeks ago. This is reverse H&S pattern. As road to the head's bottom was choppy as upside road to neckline also could be choppy.
Weekly trend stands bullish and market hits our first Fib resistance level of 1.1376. Still, major upside target is neckline around 1.16 K-resistance area.
The specific of H&S pattern is its dual character. It keeps door open for both scenarios. Upside scenario is based on reverse H&S while downside scenario could be confirmed by its failure, which happens around Right arm bottom. But now we're on the way to the neckline.
Daily
Daily chart shows bore picture at first glance. Flat standing for the whole week, forming inside sessions. Still, what we really could get from this? First is, standing in tight range means contraction, the process of energy building which sooner rather than later should lead to expansion - energy relief. It means that stand at the eve of breakout. in fact, the shape of the flag tells the same. Besides, all candles inside the flag are high waves.
Second - too weak reaction on strong daily resistance. Market has not reached even 1.1320 area, which is not too deep and absolutely natural comfortable support in current situation. We were waiting for the whole week when market shows this final downside swing, but this has not happened.
Although we've applied 3-period rule and called to not keep any shorts anymore, but current situation mostly tells on indecision or waiting for something. Speculative short positions were increased this week. This is the game till the breakout as market will follow in the same direction. Standing inside the flag gives us no suggestion on direction. It means that we will have to act right in the moment of breakout or when it already will happen. July Pivot stands at 1.1313
Intraday
It is very difficult to offer something here. "222" Sell pattern, which was formed is almost done as minimal target has been hit. I keep OP @ 1.1325 for some case, if AB=CD pattern still will be formed. Overall situation leads us to following conclusion - conservative approach suggests do nothing until breakout. For active traders we see only one way. As we do not have any patterns inside the flag, stop entry orders could be used outside its border. Thus, "Buy Stop" order could be placed slightly below A point, while "Stop Sell" - around "B" point. That should led to step in during breakout.
Alternatively, as overall technical picture doesn't look very attractive on EUR, you could search more transparent setups on other currencies.
Conclusion:
EUR/USD situation now is more interesting in long-term perspective, while in short-term perspective it doesn't show any clear setup yet. As a result, our today's report is mostly dedicated to fundamental issues.
The technical portion of Sive's analysis owes a great deal to Joe DiNapoli's methods, and uses a number of Joe's proprietary indicators. Please note that Sive's analysis is his own view of the market and is not endorsed by Joe DiNapoli or any related companies.
Last edited: