Sive Morten
Special Consultant to the FPA
- Messages
- 18,869
It is a difficult choice of currency pair right now for analysis, mostly because sudden dollar drop in recent weeks has brought adjustments on trends that were existed before. Since this impact currently is not known clear and trend right now just have entered in adjustment, many currencies can't give us yet clear patterns or signals for trading. That's being said, CAD right now seems as most transparent issue.
Fundamentals
The Canadian dollar weakened against the greenback on Friday as an increase in the price of oil failed to convince investors to continue the recent rally in the commodity-sensitive currency.
The loonie, as Canada's currency is colloquially known, was up 0.2 percent on the week, helped by investor concerns that weak economic conditions will convince the U.S Federal Reserve not to raise rates this year.
Over the past year, the currency has been badly hit by the drop in the price of oil, a major export for Canada. But the Canadian dollar has not traded as closely with oil in recent sessions and is up 3 percent since the start of October.
"I personally think the rally was overextended and now it's a little bit of a return to reality," said Greg Anderson, global head of foreign exchange strategy at BMO Capital Markets in New York.
Anderson said the loonie is in the short-term over-valued compared to commodity prices and expects fundamental factors to cause it to weaken to C$1.31 by the middle of next week.
The loonie heads into next week with a number of potential risk factors, chiefly a federal election on Monday and a Bank of Canada interest rate decision on Wednesday.
In the last leg of the closely-fought election race, incumbent Conservative Prime Minister Stephen Harper is currently second in the polls, not far behind the Liberal party led by Justin Trudeau, son of a former prime minister.
"Transitions of government cause uncertainty," said Anderson. "For currencies with current account deficits that need to be funded by foreign investors, uncertainty is a net negative for the currency."
Two days after the election, the Bank of Canada is widely expected to hold interest rates at 0.50 percent. The central bank has cut rates twice this year to help buffer the impact of cheaper oil on the economy.
The Canadian economy probably rebounded from a mild recession last quarter, helped by solid U.S. demand for its exports, but the recovery is not seen as strong enough to warrant an interest rate rise until 2017, according to a Reuters poll.
After slumping in the first half from a plunge in the price of oil, one of Canada's biggest exports, the economy will grow at an annualized rate of 2.5 percent in the third quarter and 1.7 percent in the fourth quarter, the survey of nearly 50 economists showed.
Still, after the economy's unexpectedly poor performance in the first five months of the year, the outlook for 2015 was lowered to 1.2 percent from 1.3 percent seen in a Reuters poll in July. That is expected to pick up to 2.0 percent next year, also a notch lower than the 2.1 percent forecast in July.
"The worst is probably over for the Canadian economy and it is going to get pulled up a little bit now by the strengthening U.S. economy," said Mark Hopkins, senior economist at Moody's Analytics. "It just simply won't be as strong as we were thinking a year ago."
The Bank of Canada cut interest rates twice this year to offset the shock of cheaper oil. While the survey of nearly 50 analysts predicts the next move will be up, forecasters still put the probability the next move would be a cut at about one-in-three.
The bank was seen holding its benchmark interest rate at 0.50 percent at its next policy meeting on Oct. 21, according to 41 of the 42 economists questioned on monetary policy, while one of those polled forecast an interest rate cut.
Interest rate futures markets are currently pricing about a 90 percent probability of no rate change at the meeting.
Looking further ahead, the median forecast of the analysts was that the bank would hold rates through the end of 2016, with an increase coming in the first quarter of 2017.
Most also said Bank of Canada Governor Stephen Poloz was correct in expecting exports to pull the economy out of its slowdown, even if the improvement was gradual.
"It will be a very slow grind," said Charles St-Arnaud, senior economist at Nomura Securities International. "There are no other sectors that can take the lead."
Oil prices have fallen by more than half since the middle of last year, helping to drag the Canadian dollar down by more than 20 percent since then. Poloz has said the weaker currency should help certain sectors, including exports.
Still, the strength of the export recovery is still to be seen.
"Canadian exports even to this point have not quite responded the amount that one might think," said Hopkins.
In a separate Reuters poll, economists have also downgraded their growth projections for the United States, suggesting the optimism for a U.S.-led recovery in Canada may need to be reined in. [ECILT/US]
The U.S. economy will likely grow 2.6 percent in 2016, down from an earlier poll forecasting 2.7 percent.
If the Federal Reserve were to hike rates this year, Hopkins warned it could have an adverse effect on Canadian exports. "If it slows U.S. demand sufficiently, it could actually be a problem for Canadian growth."
With the household debt-to-income ratio at a record high, most forecasters said Canadian households were carrying too much debt and expressed some degree of concern that it could result in a correction in the housing market, where a major chunk of that debt is invested.
"The leveraging of the household sector is worrisome," said Jean-Paul Lam, associate professor at the University of Waterloo. "In most countries, we have seen severe corrections when household debt gets to the levels we are seeing here."
Canadian government bond prices were mostly lower across the maturity curve, although the two-year added half a Canadian cent to yield 0.535 percent, while the benchmark 10-year rose 25 Canadian cents to yield 1.469 percent.
CFTC CAD data shows decreasing of open interest since August. Long positions on CAD stands 3 times smaller compares to shorts and as we've mentioned last week - slightly higher than long-term low for speculative longs.

Last week Longs mostly stands the same:

While shorts again slightly has decreased:

Thus, if we could speak on some support of CAD growth, it is rather mild. As we could see from mentioned above comments, investors mostly do not see yet sufficient reasons for strong CAD appreciation. It means probably that if any CAD appreciation will happen - it will have technical nature.
Technicals
Monthly
Right now we see that market has hit our 1.34 long term target. In general this target is very strong resistance. Although market is not at overbought, but combination of AB=CD target and major 5/8 Fib level creates an Agreement resistance. If even market will continue move higher later, it should show respect to this resistance by at least minimal retracement, which is 3/8 Fib support @ 1.19 area.
That is our major assumption here. Currently it is difficult to imagine what could become a reason for further CAD weakness, if even crude will drop to 15-20$, hardly CAD will reach next 1.60 target. It probably will need some domestic problems. Anyway, currently we don't care. What is important for us - CAD at rock hard resistance and is starting show response. W&R here has little chance to happen, because major target already has been hit.
Loonie right now is approaching to border of consolidation that could provide some support in short-term perspective.

Weekly
Last week we've said:
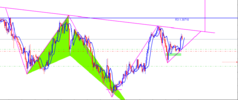
Here trend has turned bearish already. Market shows three important things here. First of all - it has finalized upward action and monthly AB=CD by reversal pattern - bearish 1.618 Butterfly. Second - market has dropped below MPS1. This moment tells that we're not in just retracement within bull trend. We're on a new bear trend. Third moment - market stands at oversold and very close to support area of 1.2870. This is not just Fib level, this is also previous top area.
As soon as market will reach it, we could get:
a) Completion of minimal butterfly target;
b) Bullish Stretch pattern which suggest upside retracement;
c) Possible B&B "Buy" pattern.
This gives us two major conclusions. First is we could trade weekly B&B "Buy" + Stretch setup on long side of the market. But major one - we should get upside rally that we will be able to Sell and take short position on our major setup on CAD
Now, as you can see our suggestion has been completed - market has reached Fib support area. Speaking on B&B "Buy", here we have used another Fib level - from whole upside action but not the low of B&B thrust (red circle). But this does not change overall conclusion, if you will draw Fib levels on most recent swing, you'll get the same B&B But Fib level will be not 3/8, but may be 50%.
That's being said, CAD has completed preliminary steps and now upside retracement should follow. Our second step is analyze daily and intraday charts for reversal patterns that justify possible long entry or at least confirm upward retracement.

Daily
Daily trend also stands bearish. Our suggestion of reaching natural support area and Fib level was correct. Also this was a WPS1 last week.
Here guys we use Fib extension tool, but in a bit different manner. We know that "C" point should stand between A and B when we estimate extension. Here we will use Fib extension tool, but "C" point stands slightly above "A". Application of this kind can't be use to estimate target, but it could be used to estimate support area when you do not have any other extension tools.
Right now on CAD we see the case of this kind. As you can see 1.618 extension creates another support area around the same level.

Hourly
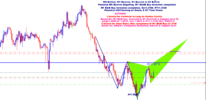
That's being said, hourly chart will be most interesting for us, especially because it is already has formed reversal pattern that could put foundation for upside retracement:

Right this is butterfly "Buy". Still, it is some uncertainty stands around. On the chart I've drawn only one scenario - how butterfly could become a part of reverse H&S pattern which could trigger B&B "Buy" action and upside retracement.
Another scenario - further drop to 1.168 extension around 1.2785 area and then upside reversal. Although higher time frames currently do not suggest big chances on this progress, it might still happen, taking in consideration a bit heavy and lazy upside action.
Following this logic it seems that most safe way to trade upside retracement is to take position on the bottom of right shoulder (if it will be formed), or at second butterfly target. Both these scenarios will give us less risk and closer stops.
Trying to take long position right now will oblige you to place initial stop below 1.618 butterfly target and it is not the fact that current entry point will be better.
Still, this is just additional trading setup here. Our major task is to get good short entry point on daily chart.
Conclusion:
Loonie right now shows logical action and gives us two setups of different scale. Long term scenario suggests downside reaction on reached important target and resistance on monthly chart, while short-term scenario mostly is focused on providing good opportunity for short entry as soon as it will be finished.
The technical portion of Sive's analysis owes a great deal to Joe DiNapoli's methods, and uses a number of Joe's proprietary indicators. Please note that Sive's analysis is his own view of the market and is not endorsed by Joe DiNapoli or any related companies.
Fundamentals
The Canadian dollar weakened against the greenback on Friday as an increase in the price of oil failed to convince investors to continue the recent rally in the commodity-sensitive currency.
The loonie, as Canada's currency is colloquially known, was up 0.2 percent on the week, helped by investor concerns that weak economic conditions will convince the U.S Federal Reserve not to raise rates this year.
Over the past year, the currency has been badly hit by the drop in the price of oil, a major export for Canada. But the Canadian dollar has not traded as closely with oil in recent sessions and is up 3 percent since the start of October.
"I personally think the rally was overextended and now it's a little bit of a return to reality," said Greg Anderson, global head of foreign exchange strategy at BMO Capital Markets in New York.
Anderson said the loonie is in the short-term over-valued compared to commodity prices and expects fundamental factors to cause it to weaken to C$1.31 by the middle of next week.
The loonie heads into next week with a number of potential risk factors, chiefly a federal election on Monday and a Bank of Canada interest rate decision on Wednesday.
In the last leg of the closely-fought election race, incumbent Conservative Prime Minister Stephen Harper is currently second in the polls, not far behind the Liberal party led by Justin Trudeau, son of a former prime minister.
"Transitions of government cause uncertainty," said Anderson. "For currencies with current account deficits that need to be funded by foreign investors, uncertainty is a net negative for the currency."
Two days after the election, the Bank of Canada is widely expected to hold interest rates at 0.50 percent. The central bank has cut rates twice this year to help buffer the impact of cheaper oil on the economy.
The Canadian economy probably rebounded from a mild recession last quarter, helped by solid U.S. demand for its exports, but the recovery is not seen as strong enough to warrant an interest rate rise until 2017, according to a Reuters poll.
After slumping in the first half from a plunge in the price of oil, one of Canada's biggest exports, the economy will grow at an annualized rate of 2.5 percent in the third quarter and 1.7 percent in the fourth quarter, the survey of nearly 50 economists showed.
Still, after the economy's unexpectedly poor performance in the first five months of the year, the outlook for 2015 was lowered to 1.2 percent from 1.3 percent seen in a Reuters poll in July. That is expected to pick up to 2.0 percent next year, also a notch lower than the 2.1 percent forecast in July.
"The worst is probably over for the Canadian economy and it is going to get pulled up a little bit now by the strengthening U.S. economy," said Mark Hopkins, senior economist at Moody's Analytics. "It just simply won't be as strong as we were thinking a year ago."
The Bank of Canada cut interest rates twice this year to offset the shock of cheaper oil. While the survey of nearly 50 analysts predicts the next move will be up, forecasters still put the probability the next move would be a cut at about one-in-three.
The bank was seen holding its benchmark interest rate at 0.50 percent at its next policy meeting on Oct. 21, according to 41 of the 42 economists questioned on monetary policy, while one of those polled forecast an interest rate cut.
Interest rate futures markets are currently pricing about a 90 percent probability of no rate change at the meeting.
Looking further ahead, the median forecast of the analysts was that the bank would hold rates through the end of 2016, with an increase coming in the first quarter of 2017.
Most also said Bank of Canada Governor Stephen Poloz was correct in expecting exports to pull the economy out of its slowdown, even if the improvement was gradual.
"It will be a very slow grind," said Charles St-Arnaud, senior economist at Nomura Securities International. "There are no other sectors that can take the lead."
Oil prices have fallen by more than half since the middle of last year, helping to drag the Canadian dollar down by more than 20 percent since then. Poloz has said the weaker currency should help certain sectors, including exports.
Still, the strength of the export recovery is still to be seen.
"Canadian exports even to this point have not quite responded the amount that one might think," said Hopkins.
In a separate Reuters poll, economists have also downgraded their growth projections for the United States, suggesting the optimism for a U.S.-led recovery in Canada may need to be reined in. [ECILT/US]
The U.S. economy will likely grow 2.6 percent in 2016, down from an earlier poll forecasting 2.7 percent.
If the Federal Reserve were to hike rates this year, Hopkins warned it could have an adverse effect on Canadian exports. "If it slows U.S. demand sufficiently, it could actually be a problem for Canadian growth."
With the household debt-to-income ratio at a record high, most forecasters said Canadian households were carrying too much debt and expressed some degree of concern that it could result in a correction in the housing market, where a major chunk of that debt is invested.
"The leveraging of the household sector is worrisome," said Jean-Paul Lam, associate professor at the University of Waterloo. "In most countries, we have seen severe corrections when household debt gets to the levels we are seeing here."
Canadian government bond prices were mostly lower across the maturity curve, although the two-year added half a Canadian cent to yield 0.535 percent, while the benchmark 10-year rose 25 Canadian cents to yield 1.469 percent.
CFTC CAD data shows decreasing of open interest since August. Long positions on CAD stands 3 times smaller compares to shorts and as we've mentioned last week - slightly higher than long-term low for speculative longs.
Last week Longs mostly stands the same:
While shorts again slightly has decreased:
Thus, if we could speak on some support of CAD growth, it is rather mild. As we could see from mentioned above comments, investors mostly do not see yet sufficient reasons for strong CAD appreciation. It means probably that if any CAD appreciation will happen - it will have technical nature.
Technicals
Monthly
Right now we see that market has hit our 1.34 long term target. In general this target is very strong resistance. Although market is not at overbought, but combination of AB=CD target and major 5/8 Fib level creates an Agreement resistance. If even market will continue move higher later, it should show respect to this resistance by at least minimal retracement, which is 3/8 Fib support @ 1.19 area.
That is our major assumption here. Currently it is difficult to imagine what could become a reason for further CAD weakness, if even crude will drop to 15-20$, hardly CAD will reach next 1.60 target. It probably will need some domestic problems. Anyway, currently we don't care. What is important for us - CAD at rock hard resistance and is starting show response. W&R here has little chance to happen, because major target already has been hit.
Loonie right now is approaching to border of consolidation that could provide some support in short-term perspective.
Weekly
Last week we've said:
Here trend has turned bearish already. Market shows three important things here. First of all - it has finalized upward action and monthly AB=CD by reversal pattern - bearish 1.618 Butterfly. Second - market has dropped below MPS1. This moment tells that we're not in just retracement within bull trend. We're on a new bear trend. Third moment - market stands at oversold and very close to support area of 1.2870. This is not just Fib level, this is also previous top area.
As soon as market will reach it, we could get:
a) Completion of minimal butterfly target;
b) Bullish Stretch pattern which suggest upside retracement;
c) Possible B&B "Buy" pattern.
This gives us two major conclusions. First is we could trade weekly B&B "Buy" + Stretch setup on long side of the market. But major one - we should get upside rally that we will be able to Sell and take short position on our major setup on CAD
Now, as you can see our suggestion has been completed - market has reached Fib support area. Speaking on B&B "Buy", here we have used another Fib level - from whole upside action but not the low of B&B thrust (red circle). But this does not change overall conclusion, if you will draw Fib levels on most recent swing, you'll get the same B&B But Fib level will be not 3/8, but may be 50%.
That's being said, CAD has completed preliminary steps and now upside retracement should follow. Our second step is analyze daily and intraday charts for reversal patterns that justify possible long entry or at least confirm upward retracement.
Daily
Daily trend also stands bearish. Our suggestion of reaching natural support area and Fib level was correct. Also this was a WPS1 last week.
Here guys we use Fib extension tool, but in a bit different manner. We know that "C" point should stand between A and B when we estimate extension. Here we will use Fib extension tool, but "C" point stands slightly above "A". Application of this kind can't be use to estimate target, but it could be used to estimate support area when you do not have any other extension tools.
Right now on CAD we see the case of this kind. As you can see 1.618 extension creates another support area around the same level.
Hourly
That's being said, hourly chart will be most interesting for us, especially because it is already has formed reversal pattern that could put foundation for upside retracement:
Right this is butterfly "Buy". Still, it is some uncertainty stands around. On the chart I've drawn only one scenario - how butterfly could become a part of reverse H&S pattern which could trigger B&B "Buy" action and upside retracement.
Another scenario - further drop to 1.168 extension around 1.2785 area and then upside reversal. Although higher time frames currently do not suggest big chances on this progress, it might still happen, taking in consideration a bit heavy and lazy upside action.
Following this logic it seems that most safe way to trade upside retracement is to take position on the bottom of right shoulder (if it will be formed), or at second butterfly target. Both these scenarios will give us less risk and closer stops.
Trying to take long position right now will oblige you to place initial stop below 1.618 butterfly target and it is not the fact that current entry point will be better.
Still, this is just additional trading setup here. Our major task is to get good short entry point on daily chart.
Conclusion:
Loonie right now shows logical action and gives us two setups of different scale. Long term scenario suggests downside reaction on reached important target and resistance on monthly chart, while short-term scenario mostly is focused on providing good opportunity for short entry as soon as it will be finished.
The technical portion of Sive's analysis owes a great deal to Joe DiNapoli's methods, and uses a number of Joe's proprietary indicators. Please note that Sive's analysis is his own view of the market and is not endorsed by Joe DiNapoli or any related companies.