• Please try to select the correct prefix when making a new thread in this folder.

    Discuss is for general discussions of a financial company or issues related to companies.

    Info is for things like "Has anyone heard of Company X?" or "Is Company X legit or not?"

    Compare is for things like "Which of these 2 (or more) companies is best?"

    Searching is for things like "Help me pick a broker" or "What's the best VPS out there for trading?"

    Problem is for reporting an issue with a company. Please don't just scream "CompanyX is a scam!" It is much more useful to say "I can't withdraw my money from Company X" or "Company Y is not honoring their refund guarantee" in the subject line.
    Keep Problem discussions civil and lay out the facts of your case. Your goal should be to get your problem resolved or reported to the regulators, not to see how many insults you can put into the thread.

    More info coming soon.

Discuss Fxcm.com

General discussions of a financial company
Breakout Strategies Favored on Euro Pairs

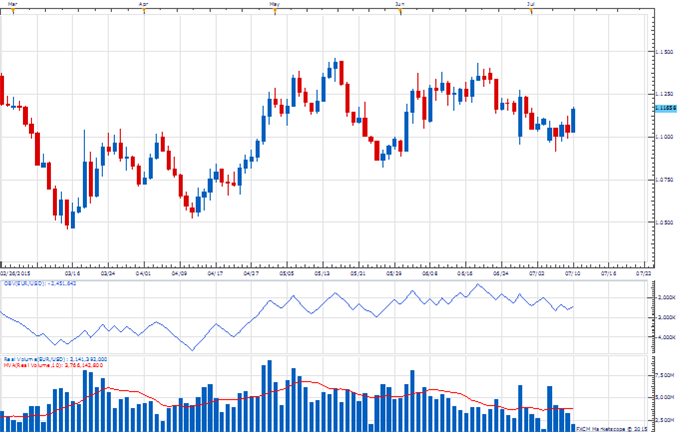
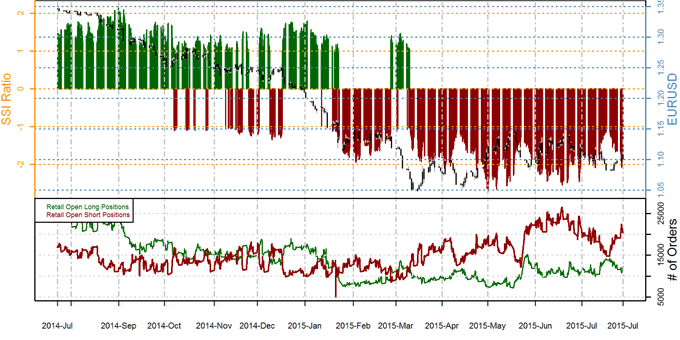
Volatility prices remain high as Greek voters rejected a Eurogroup bailout and raised the risks of a Greek exit from the Euro Zone.


forex-trading-for-the-week-ahead_body_Picture_4.png

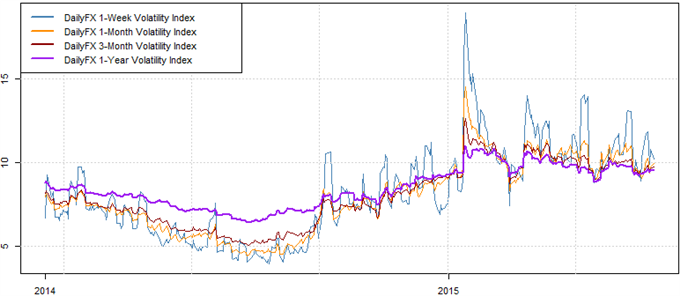
Data source: Bloomberg, DailyFX Calculations


Thus current market conditions may favor our Breakout2 trading strategy in most of the especially risk-sensitive currency pairs.


forex-trading-for-the-week-ahead_body_Picture_3.png


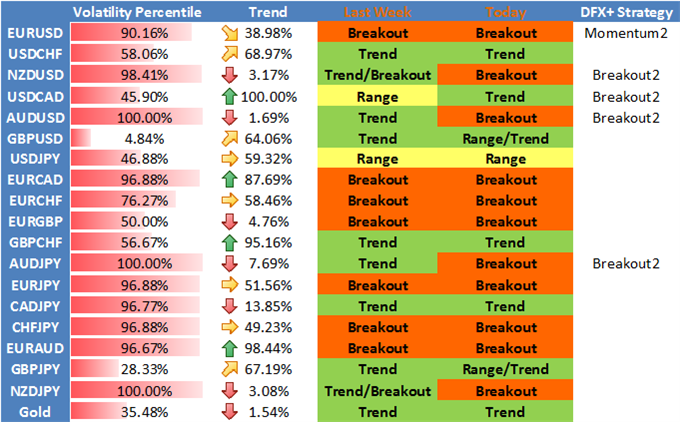
Quantitative strategist David Rodriguez explains the Breakout2 trading system in his article on DailyFX.com
 
US Dollar and Japanese Yen on Target to Hit these Price Levels

The US Dollar and Japanese Yen have broken sharply higher versus the Euro and British Pound. Here are the levels that quantitative strategist David Rodriguez is watching next.

EUR/USD
  • Total Buy Volume Executed, Total Sell Volume Executed, Net Volume Executed (Buy-Sell)
  • Length of bar indicates the sum of Buy and Sell volume
forex-trading-volume-at-price-levels_body_x0000_i1036.png

Chart source: The Weekly Volume at Price Report on DailyFX.com

The Euro has broken major levels of volume-based support and currently trades just above noteworthy congestion near $1.0900. A larger breakdown leaves little in the way of a test of $1.08, while former support is current resistance starting at $1.10 and extending through $1.12.

_


GBP/JPY
  • Total Buy Volume Executed, Total Sell Volume Executed, Net Volume Executed (Buy-Sell)
  • Length of bar indicates the sum of Buy and Sell volume
forex-trading-volume-at-price-levels_body_x0000_i1032.png

Chart source: The Weekly Volume at Price Report on DailyFX.com

The Sterling has traded below important congestion versus the Yen at the ¥190 level, and support is now seen at December, 2014 highs near ¥188—likewise an important volume-based congestion zone. Our focus remains to the downside, and former support turns to resistance starting near ¥190.
 
Volume & Sentiment Alignment on AUD/USD Favors Downside

Recently, China’s Shanghai Index has seen a 29% drop from mid-June highs taking it negative for the year and hurting regional sentiment. There is also risk-off sentiment due to concerns over Greece’s potential exit from the Eurozone and hard assets, such as Oil moving aggressively lower. Earlier today, the Thomson Reuters CRB Commodity Equity Index hit a 5-year low today. This risk-off environment has created a sell-off in AUD/USD.


AUDUSD-Volume-Sentiment-July-8_body_Traders_Continue_Selling_US_Dollars_into_Recent_Bounce.png

Screen capture from DailyFXPlus.com


In his article today on DailyFX.com, forex trading instructor Tyler Yell highlights how retail FX traders have aggressively and unsuccessfully fought this downtrend, as you see from the picture above. This fight has taken place as AUD/USD continued lower. Sentiment favors further downside as you can see when the client positioning is heavily leaning one direction, it often aligns with a strong trend that they’re hoping is about to reverse.


AUDUSD-Volume-Sentiment-July-8_body_Picture_3.png

Screen capture from DailyFXPlus.com


Additionally, you can see that Retail Open Long Positions have increased and are at their greatest exposure since the market peaked in spring of 2014. The changes in long and shorts show additionally that the long view is getting more aggressive. The increase in retail long positions are 23.7% above levels seen last week showing the fight is only accelerating.


AUDUSD-Volume-Sentiment-July-8_body_Picture_9.png.full.png

Real Volume from Marketscope 2.0 charts


You can see above that the recent break of support shown by white lines attracted a relatively large amount of volume. With an increasing amount of support or multitude of buyers, a sustained move below that 4-month support of 0.7550/0.7600 could develop.
 
US Dollar Remains in Position for Gains versus GBP, AUD, NZD

According to David Rodriguez's latest analysis of the Speculative Sentiment Index (SSI), the US Dollar and the Japanese Yen remain in position to hit fresh highs.

ssi_table_story_body_Picture_8.png


You can see the details of what he's watching in his Weekly SSI Report on DailyFX.com
 
The Weekly Volume Report: High Turnover Euro Capitulation

Talking Points
  • EUR/USD volume spikes again
  • USD/JPY turnover continues to decline

Daily Volume Chart: EUR/USD
volume_jul7_10_body_Picture_3.png

Charts Created using Marketscope – Prepared by Kristian Kerr


  • EUR/USD continues to trade in a sideways to lower range
  • Well above average volume spikes at recent lows warn of a possible near-term downside capitulation
  • The contraction in daily OBV suggests a directional spike is looming
  • A close back over 1.1240 on above average volume is needed to turn the outlook positive again on the euro
 
US Dollar Trades at Make or Break Levels versus the Euro, Yen

The US Dollar is at a potentially pivotal zone of support versus the Japanese Yen but eyes key resistance against the Euro. Here are the levels that quantitative strategist David Rodriguez is watching:

EUR/USD
  • Total Buy Volume Executed, Total Sell Volume Executed, Net Volume Executed (Buy-Sell)
  • Length of bar indicates the sum of Buy and Sell volume
forex-trading-volume-levels-for-euro-and-japanese-yen_body_x0000_i1033.png

Chart source: The Weekly Volume at Price Report on DailyFX.com


The Euro continues to hold below significant volume-based resistance starting at $1.12, and continued failure leaves our focus to the downside. Near-term support is the psychologically significant $1.10 mark, while a break below targets congestion and volume-based support near $1.09.

_


USD/JPY
  • Total Buy Volume Executed, Total Sell Volume Executed, Net Volume Executed (Buy-Sell)
  • Length of bar indicates the sum of Buy and Sell volume
forex-trading-volume-levels-for-euro-and-japanese-yen_body_x0000_i1031.png

Chart source: The Weekly Volume at Price Report on DailyFX.com


The US Dollar has recently failed near notable congestion and volume-based resistance versus the Yen starting at ¥123.50, and continued failure at these levels leaves support near comparable volume levels near ¥121.50.
 
Euro Forecast to Hit Further Lows on Major Sentiment Shift

Continued Euro tumbles have been met with aggressive retail FX crowd buying, and our trader sample shows that traders are close to flipping to net-long the EUR/USD for the first time since March. We typically use retail positioning as a contrarian indicator to price action; crowds remain net-short and as such we might call for Euro gains.

ssi_eur-usd_body_Picture_6.png

Yet the severity with which sentiment has flipped warns that the Euro may continue lower. The pair currently trades at congestion-based support near $1.0900, and a further breakdown targets the May low near $1.08 and eventually a return towards the year-to-date low near $1.0440.

See more analysis for other currencies in this week's Speculative Sentiment Index (SSI) report on DailyFX.com
 
New SSI Snapshots Indicator

According to the latest readings from our Speculative Sentiment Index (SSI), the ratio of long to short positions in the EUR/USD stands at -1.68. That means there are 1.68 short positions among FXCM's retail client base for each long position.

SSI_2015-07-28_66516851_body_Picture_13.png

In other words, only 37% of traders are long, while 63% are short. We use our SSI as a contrarian indicator to price action, and the fact that the majority of traders are short gives signal that the EUR/USD may continue higher.
_

For years, FXCM clients have been able to get SSI updates on DailyFXplus.com, but now you can also get real-time SSI data for up to 19 symbols directly on your charts.

xzJ2U8g.png

The SSI Snapshots indicator updates every second, so you have the most up-to-date info on the marketplace. And with convenient docking, you can position the indicator on any chart so it never gets in the way.
 
Back
Top