Sive Morten
Special Consultant to the FPA
- Messages
- 18,673
Fundamentals
Gold prices fell towards a second weekly loss on Friday after U.S. payrolls data failed to allay uncertainty over the prospect of a near-term interest rate hike from the Federal Reserve.
Data from the Labor Department on Friday showed that non-farm payrolls rose 173,000 last month, a slowdown from July's upwardly revised gain of 245,000.
However, a drop in the unemployment rate to a near 7-1/2-year low and an acceleration in wages kept alive prospects of a Federal Reserve interest rate increase later this month.
"Overall I think the payrolls were erring on the better side, even though the headline number was weaker, because of the lower unemployment rate, the higher hourly earnings, and the upward revisions," ABN Amro analyst Georgette Boele said.
A top Federal Reserve policymaker said the data on the U.S. jobs market was "good" and did not change the outlook for monetary policy.
Global equity markets tumbled and the dollar was mixed after the data.
Gold has come under pressure this year from expectations the Fed will hike rates for the first time in nearly a decade.
The Fed has already indicated that the timing of a hike is largely data-dependent.
The absence of Chinese buyers also weighed on gold, with markets in the major bullion consumer closed for public holidays. Monday will be a U.S. holiday.
Gold prices in India swung to a discount to the global benchmark this week for the first time since mid-July.
"Although August bullion imports were high, demand in India appears to have stalled," HSBC said in a note.
Capital Economics noted that weddings and festivals are viewed as auspicious times to buy gold in India.
"According to the Hindu calendar, the number of days ... considered propitious to get married is 30 percent lower in 2015 than in 2014," it said.
"Gold demand should recover in Q3 ahead of the big wedding and festival season in Q4."
In Australia, gold coin and minted bar sales at the Perth Mint dipped in August.
CFTC data shows solid drop in open interest (for 60K contracts), while net long positions remains the same. It tells that investors across the board have contracted their positions -as speculators as hedgers, as longs as shorts. They decreased participation rate in gold market. We could try to guess reasons for that, but hardly will know this definitely. May be coming Fed meeting, may be something else... But the fact is - investors partially have abandoned gold

This could become a reason (from sentiment point of view) why market was not able to continue upward action.
Technicals
Monthly
As we've said last week - it is difficult to make any far going conclusions yet and mostly right now started upside action looks like tactical bounce from strong support area. To get another status market should show significant upside action and form bullish reversal swing.
Also changes barely have touched monthly time frame, we've got very important detail here - the close of August candle. As a result, we've got bearish grabber on monthly chart that suggests moving below 1080 area. This is the answer on our questions - how far upside action could climb. In general market has reached not bad upside targets on lower time frames, completed daily DRPO "Buy" and in general this is enough to treat retracement as completed and sufficient.
When market has started explosive upside action two weeks ago, I was a bit confused, since we have very important targets around 1050 and I couldn't believe that gold just turn up, it would be too unnatural and untypical for gold, or even for any market. And appearing of the grabber explains everything.
We have just one long-term pattern in progress that has not achieved it’s target yet. This is VOB pattern. It suggests at least 0.618 AB-CD down. And this target is 1050$. Besides, in the same area we have 1.618 target of most recent butterfly pattern.
Last week we've discussed potential bullish engulfing, but we've got grabber instead. This drastically changes perspectives and replace deeper upside action with downward reversal probably.
If somehow gold will drop below 1050. Next destination will be 890-900$ area - major 5/8 Fib support and Agreement !!! with AB=CD pattern down, the same one that points VOB target.

Weekly
Our context on weekly chart drastically has changed. If last week we were guessing how far market could move up, and discussed 1220 K-area resistance, today we will be watching for downward signs, at least until monthly grabber is valid.
First of all - upside action was stopped by natural support/resistance area @ 1180. Right now trend has turned bullish, but second week in a row market is falling down. This could be a sign of bearish dynamic pressure.
As market has shown already sufficient bounce to respect 1.27 butterfly point - it could proceed down to 1.618 around 1022. Although it stands slightly below 1050 target on monthly chart - 30$ is not big difference for large scales.
Probably we will be able to talk on upside action again only if market will move above 1180 again and erase grabber. Until that will happen - our context will remain bearish.

Daily
On daily chart we've discussed grabber on Friday and that it has been completed as recent lows were taken out. It means that upside AB-CD pattern is not valid any more. Trend stands bearish here. We mostly will be interested in downward swing for taking short position.

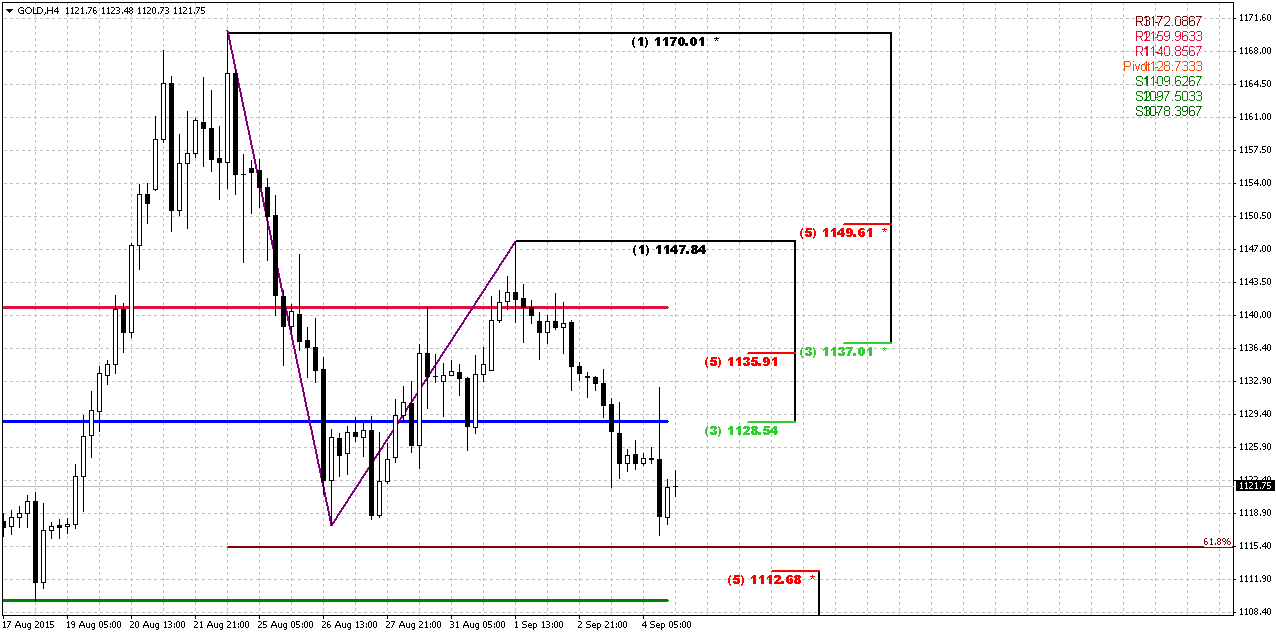
4-hour
Here we will wait for couple of issues. First one is reaching of target/support area around 1112. This is minor AB-CD 0.618 extension that stands very close to major Fib support and WPS1.
As soon as target will be hit we will be watching for upside bounce to one of mentioned levels - area around WPP and MPP (they coincides on coming week) and Fib level, or K-resistance around 1135.
Conclusion
Situation on gold market has changed drastically. Now patterns and recent action point on further drop on gold, even to 1050 area. Until market will stands below 1180 level this setup will be valid.
Thus, probably we should prepare for taking short position on gold market
The technical portion of Sive's analysis owes a great deal to Joe DiNapoli's methods, and uses a number of Joe's proprietary indicators. Please note that Sive's analysis is his own view of the market and is not endorsed by Joe DiNapoli or any related companies.
Gold prices fell towards a second weekly loss on Friday after U.S. payrolls data failed to allay uncertainty over the prospect of a near-term interest rate hike from the Federal Reserve.
Data from the Labor Department on Friday showed that non-farm payrolls rose 173,000 last month, a slowdown from July's upwardly revised gain of 245,000.
However, a drop in the unemployment rate to a near 7-1/2-year low and an acceleration in wages kept alive prospects of a Federal Reserve interest rate increase later this month.
"Overall I think the payrolls were erring on the better side, even though the headline number was weaker, because of the lower unemployment rate, the higher hourly earnings, and the upward revisions," ABN Amro analyst Georgette Boele said.
A top Federal Reserve policymaker said the data on the U.S. jobs market was "good" and did not change the outlook for monetary policy.
Global equity markets tumbled and the dollar was mixed after the data.
Gold has come under pressure this year from expectations the Fed will hike rates for the first time in nearly a decade.
The Fed has already indicated that the timing of a hike is largely data-dependent.
The absence of Chinese buyers also weighed on gold, with markets in the major bullion consumer closed for public holidays. Monday will be a U.S. holiday.
Gold prices in India swung to a discount to the global benchmark this week for the first time since mid-July.
"Although August bullion imports were high, demand in India appears to have stalled," HSBC said in a note.
Capital Economics noted that weddings and festivals are viewed as auspicious times to buy gold in India.
"According to the Hindu calendar, the number of days ... considered propitious to get married is 30 percent lower in 2015 than in 2014," it said.
"Gold demand should recover in Q3 ahead of the big wedding and festival season in Q4."
In Australia, gold coin and minted bar sales at the Perth Mint dipped in August.
CFTC data shows solid drop in open interest (for 60K contracts), while net long positions remains the same. It tells that investors across the board have contracted their positions -as speculators as hedgers, as longs as shorts. They decreased participation rate in gold market. We could try to guess reasons for that, but hardly will know this definitely. May be coming Fed meeting, may be something else... But the fact is - investors partially have abandoned gold
This could become a reason (from sentiment point of view) why market was not able to continue upward action.
Technicals
Monthly
As we've said last week - it is difficult to make any far going conclusions yet and mostly right now started upside action looks like tactical bounce from strong support area. To get another status market should show significant upside action and form bullish reversal swing.
Also changes barely have touched monthly time frame, we've got very important detail here - the close of August candle. As a result, we've got bearish grabber on monthly chart that suggests moving below 1080 area. This is the answer on our questions - how far upside action could climb. In general market has reached not bad upside targets on lower time frames, completed daily DRPO "Buy" and in general this is enough to treat retracement as completed and sufficient.
When market has started explosive upside action two weeks ago, I was a bit confused, since we have very important targets around 1050 and I couldn't believe that gold just turn up, it would be too unnatural and untypical for gold, or even for any market. And appearing of the grabber explains everything.
We have just one long-term pattern in progress that has not achieved it’s target yet. This is VOB pattern. It suggests at least 0.618 AB-CD down. And this target is 1050$. Besides, in the same area we have 1.618 target of most recent butterfly pattern.
Last week we've discussed potential bullish engulfing, but we've got grabber instead. This drastically changes perspectives and replace deeper upside action with downward reversal probably.
If somehow gold will drop below 1050. Next destination will be 890-900$ area - major 5/8 Fib support and Agreement !!! with AB=CD pattern down, the same one that points VOB target.
Weekly
Our context on weekly chart drastically has changed. If last week we were guessing how far market could move up, and discussed 1220 K-area resistance, today we will be watching for downward signs, at least until monthly grabber is valid.
First of all - upside action was stopped by natural support/resistance area @ 1180. Right now trend has turned bullish, but second week in a row market is falling down. This could be a sign of bearish dynamic pressure.
As market has shown already sufficient bounce to respect 1.27 butterfly point - it could proceed down to 1.618 around 1022. Although it stands slightly below 1050 target on monthly chart - 30$ is not big difference for large scales.
Probably we will be able to talk on upside action again only if market will move above 1180 again and erase grabber. Until that will happen - our context will remain bearish.
Daily
On daily chart we've discussed grabber on Friday and that it has been completed as recent lows were taken out. It means that upside AB-CD pattern is not valid any more. Trend stands bearish here. We mostly will be interested in downward swing for taking short position.
4-hour
Here we will wait for couple of issues. First one is reaching of target/support area around 1112. This is minor AB-CD 0.618 extension that stands very close to major Fib support and WPS1.
As soon as target will be hit we will be watching for upside bounce to one of mentioned levels - area around WPP and MPP (they coincides on coming week) and Fib level, or K-resistance around 1135.
Conclusion
Situation on gold market has changed drastically. Now patterns and recent action point on further drop on gold, even to 1050 area. Until market will stands below 1180 level this setup will be valid.
Thus, probably we should prepare for taking short position on gold market
The technical portion of Sive's analysis owes a great deal to Joe DiNapoli's methods, and uses a number of Joe's proprietary indicators. Please note that Sive's analysis is his own view of the market and is not endorsed by Joe DiNapoli or any related companies.