Sive Morten
Special Consultant to the FPA
- Messages
- 18,727
Fundamentals
On coming week there will be single major event that could significantly impact on level of gold prices. Hardly it will change sentiment from top to bottom, but could trigger significant move. Obviously I’m speaking about FOMC meeting. As some inflation shadowed hazard has appeared, as well as light decline of statistical data – gold has got supportive sentiment. Thus, U.S. data on Friday showed consumer sentiment edged off a six-year high in June, while manufacturing output picked up a bit last month after two straight months of declines, suggesting the economy remains on a moderate growth path. But what really was supportive is wholesale price jumped in May as gasoline and food prices rebounded. So, results of FOMC meeting will be thrilling and most economists expect the Fed to scale back the size of its bond purchases by year end, and several expect reduced buying as early as September, a Reuters poll showed. Current run in safe haven also partially was triggered by uncertainty as from the Fed as from BoJ. You can read about it in current Forex Pro Weekly Thread.
More fuel to the fire comes from geopolitical instability on Middle East. Traders said rising geopolitical tensions in the Middle East also boosted the metal's safe-haven appeal. Western diplomats said the United States is considering setting up a no-fly zone in Syria, which would represent its first intervention in that civil war. Still hardly this will be dominating factor. Middle East stands in the flame for considerable period of time already and on significantly more territory than just Syria. Egypt, Lebanon, Turkey, Tunisia, Iraq – never is a stable geopolitical situation. It’s just not new, but it’s there. Syria is a bit “new”, that’s why it attracts more attention.
So, if we will get something new from the Fed gold market could take part in pay-off with bond and bubble on stock markets that could blow off. There are two major driving forces on gold. First is periods of crisis and tragedy and another one is inflation. Until one of them will not appear, gold will remain under pressure, even if it will show some bounce based on money flow from equities.
Another relative confirmation of low activity with upward action is U.S. Comex gold futures for August delivery settled up $9.80 at $1,387.60. Turnover was very low as trading volume was under 100,000 lots versus its 30-day average of 220’000, preliminary Reuters data showed. Platinum and palladium have shown significant decline on past week as well.
And finally again – SPDR Fund declared outflow of 6.3 tonnes of gold on Thursday reversing gains earlier this week.
Despite on gold holding in tight range and even small appreciation, CFTC reports shows declining of net long speculative position, and take a look – increasing of Open Interest. This confirms that bear trend is still intact.
Thus, some gold appreciation is possible based on coming events in medium-term perspective, but mostly this appreciation will be temporal and related to possible money flow, but not to global changes in fundamental picture. Long term bearish trend on gold still intact.
Monthly
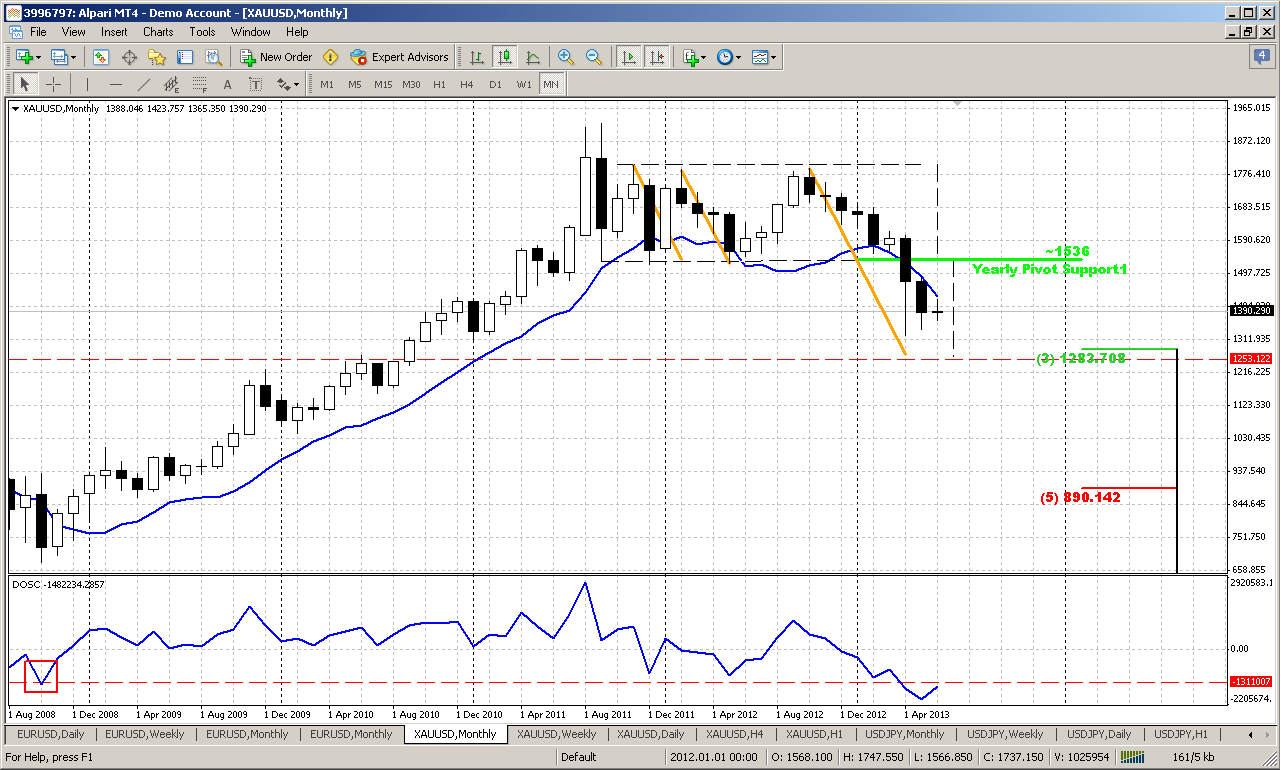
June candle is rather small and has not changed much on previous week, so I can’t add more comments on monthly time frame. In really big picture we’ve got Volatility Breakout (VOB) pattern on May. This pattern usually provides solid reliability, since it based not on some price averaging as other indicators but on statistical measure of standard deviation, i.e. on volatility. This is in fact the core of the market’s breath and if we can call it in this way – some statistical law that could lead to significant consequences.
Now we have VOB setup here. Market never was as oversold as it stands now. Take a look at DOSC indicator again – market now stands at all time extreme point that is lower than the previous extreme value in 2008. This gives us very significant conclusion that will be hard to overvalue. Usually when market forms VOB it leads to 2-leg downward move in some shape of AB-CD, but not necessary that AB should be equal to CD. The minimum target of VOB is 0.618 extension of AB-CD, where AB – initial swing down that has given VOB. Other words – now market is forming AB move. Then some retracement up should follow and then downward continuation, i.e. extension.
So two significant conclusions could be made here: whatever bounce market will show here – this probably will be just retracement but not a reversal – the same thought we’ve made based on fundamental picture analysis. Second – market probably will reach some deeper support level and closest one stands around 1200.
Weekly
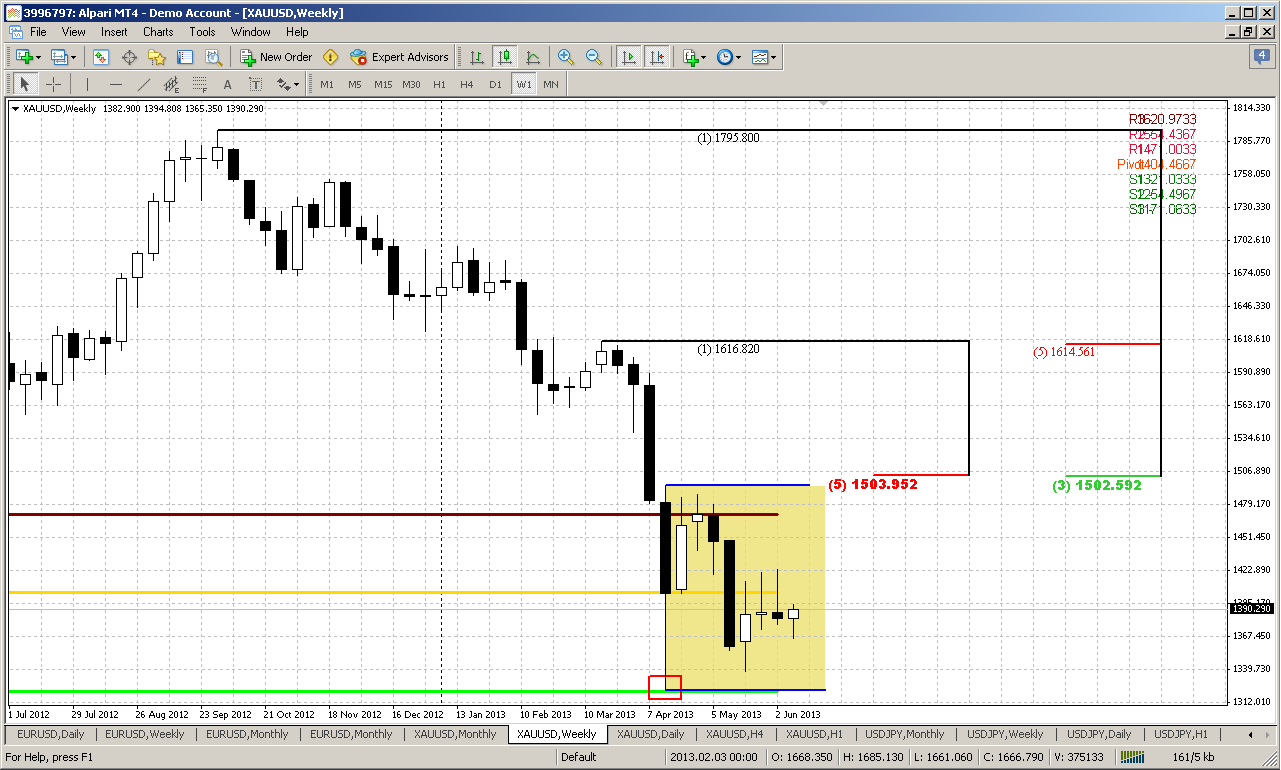
On weekly time frame you can see impact of oversold on monthly. Once we’ve said that if you even take short position on weekly – do not point the target below previous lows, since market extremely oversold. Thus, we can see here that price can’t move lower and stand in the range of April sell-off.
Very often such significant moves, as we’ve got on April forces market to stand in its range for some time. It looks like market accommodates for new range, trying to understand what is going on. Here we have particularly this case. Seven weeks in a row market stands in the range of April sell-off. Two previous weeks action was not impressive and market mostly was indecision and has formed candles with high upper shadow. Still market gives us one very significant moment. Price has tested MPP and moved below it. So, it confirms long-term bearish sentiment. Following pivot points application, market probably should start move to MPS1 that stands precisely at current lows. Thus it will be interesting what impact will follow after FOMC meeting. Whether market will re-test MPP with slightly higher high or start move down if no comment will follow concerning QE close…
In a bigger picture the most action should happen when market will pass through either upper border 1500 or lower one – 1320. But as we can see on monthly chart – gold can stand in consolidation rather long time. Besides, price hardly will easily pass through 1320 due oversold, as I said. There is only one way how it could happen. Fundamental factors that hunt gold in extreme oversold conditions – the same factors could continue to dominate over technical moments, but it is very difficult to predict. Currently it looks their impact gradually becomes lighter. So, most probable some kind of range behavior, at least within nearest 2-3 months due summer time and bearish seasonal trend. I can’t exclude that despite overall bearish context we might be interesting with searching possibility even for short-term long entry around 1320 with some short-term targets.
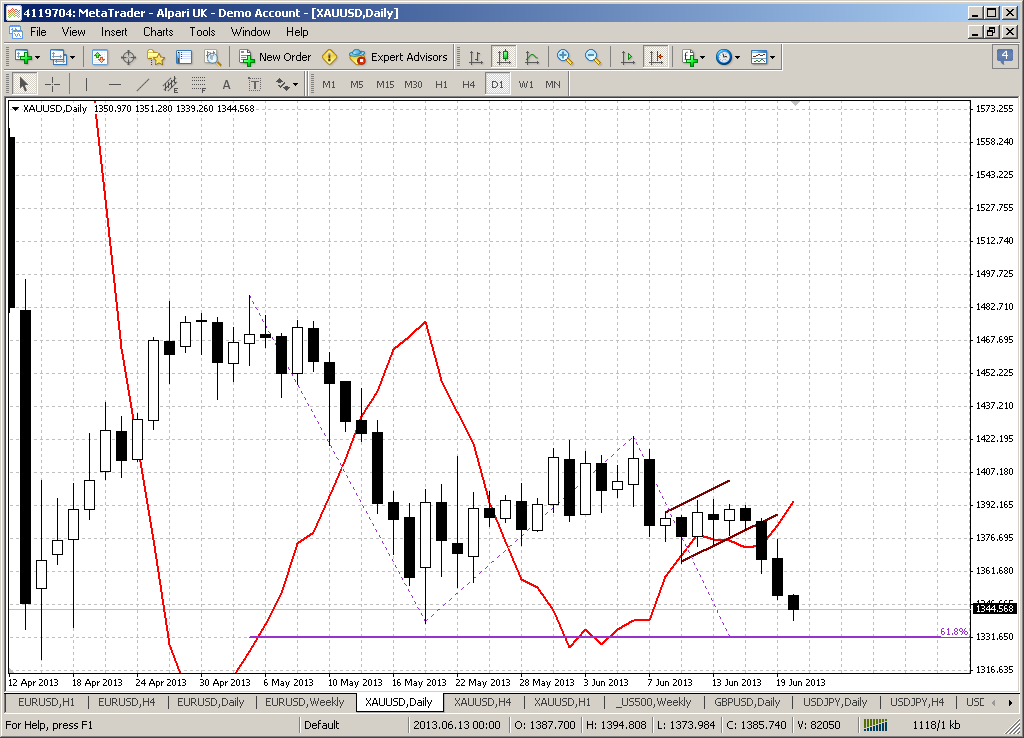
Daily
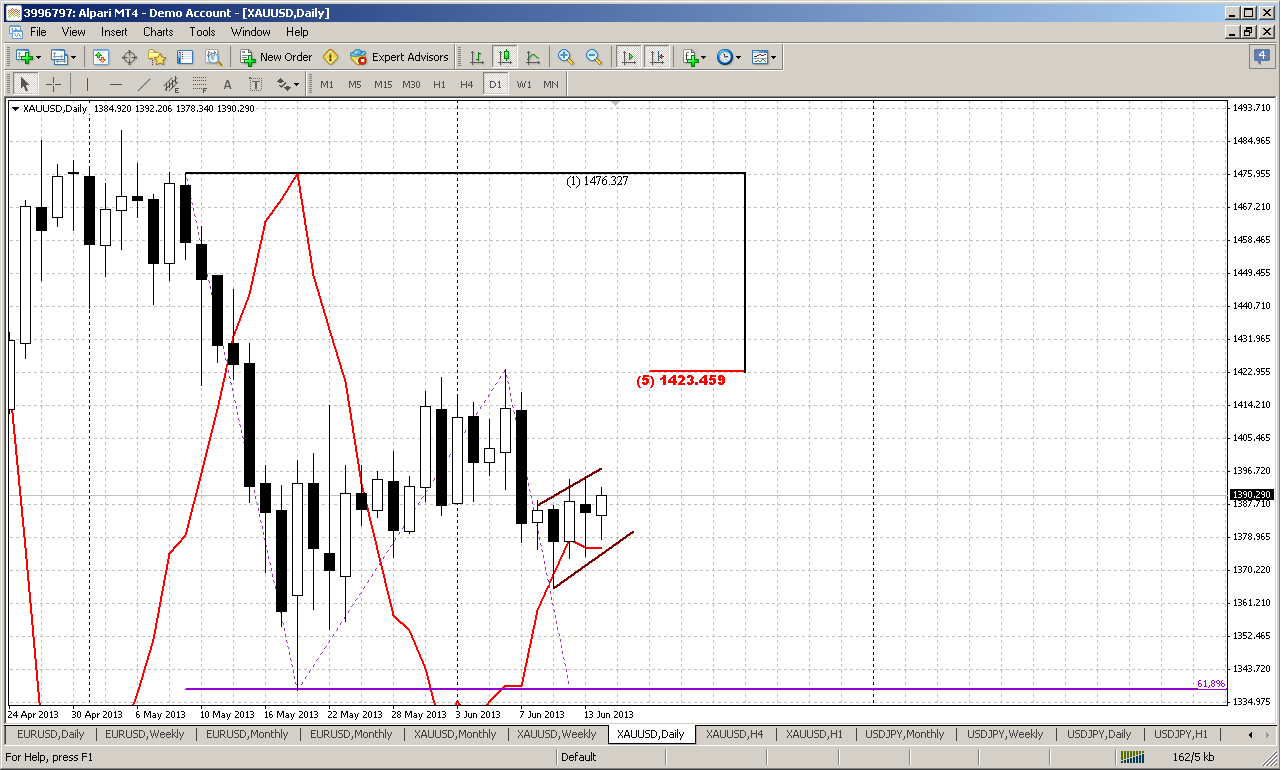
Now we are shifting to most interest part of analysis, since possible trades on coming week are based on daily patterns. Actually it’s all about the flag. We’ve talked previously that we have bullish trend here and 3 side-by-side bullish stop grabbers that has minimum target – high at 1423 area – it should be taken out. At the same time the invalidation point of these patterns are their lows. If market will take them out, these patterns will be vanished. That coincides with flag breakout direction. Theoretically it’s bearish, but since we have contradictive patterns we just can’t take short position right now. So, if you’re bearish – wait either upward action and then look how market will behave there around 1423 or downward breakout and then take short and nearest rally up.
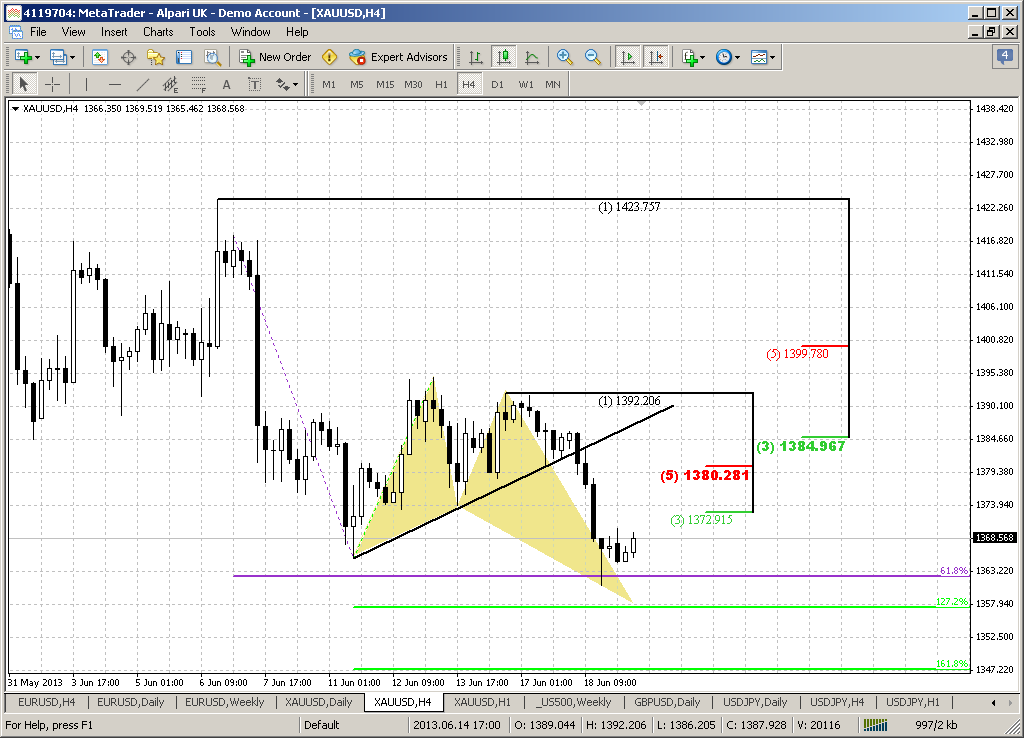
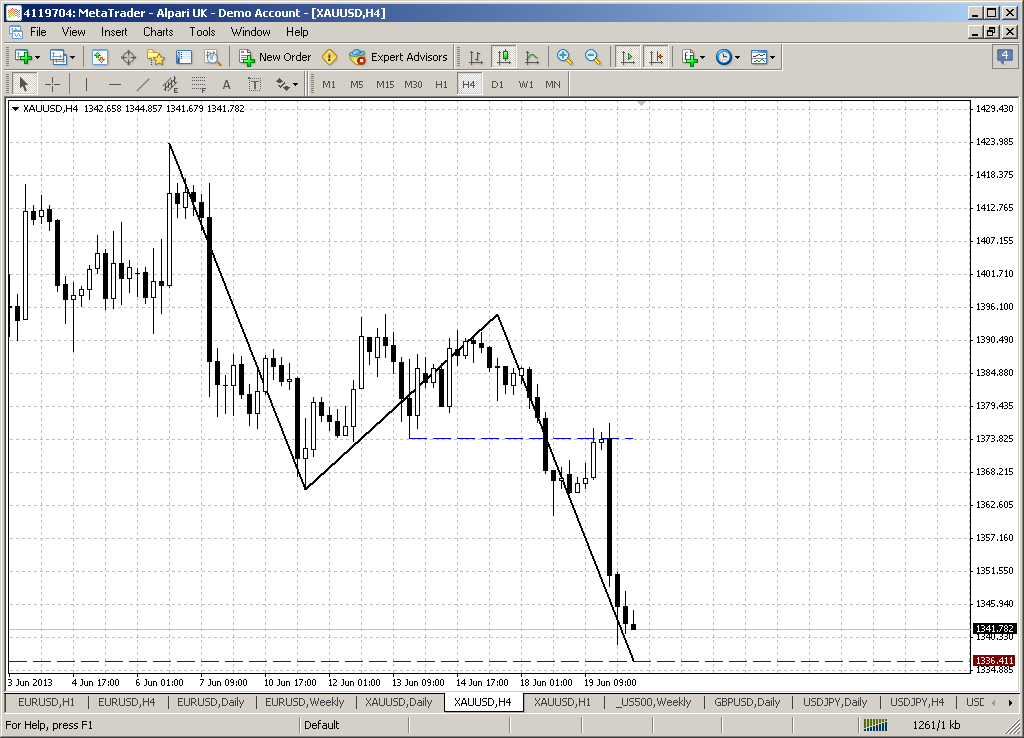
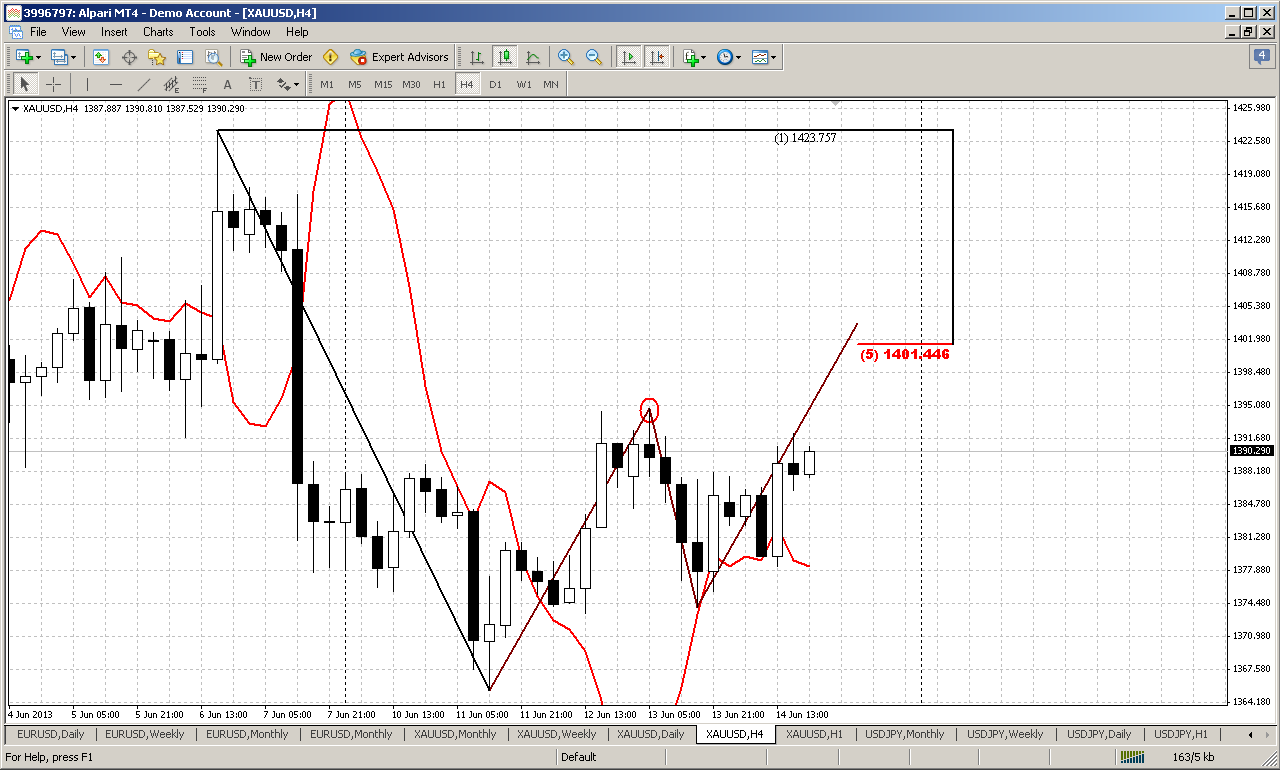
4-hour
Now we have to be extra careful, since start discussing of setup that could let us to take position with very small risk but potentially high return. It could be a bit sophisticated but follow me carefully. On Friday, if you remember, we’ve discused just the same pattern here. I hope that you’ve taken long based on our trading plan. In this case you will need nothing, just manage position as we will discuss further. If you have missed the enter – here is the last chance, I suppose, since we’ve got another stop grabber. You may try to take position on retracement if it will follow. These patterns have closer target – previous swing high on 4 hour chart around 1395. If we will lucky it could turn to AB=CD pattern right to 1401 agreement. Since possessing long term, based on daily stop grabbers is a bit tricky currently – we can take position on 4-hour stop grabbers, that probably will reach targets. This will allow us to move stop orders at breakeven and by this action take position on daily patterns without risk. That’s the plan. When FOMC meeting will start – that will not be a nervous period, we will just watch the movie what will happen. You even will probably could get some profit in your pocket by this time, if close half of position before FOMC.
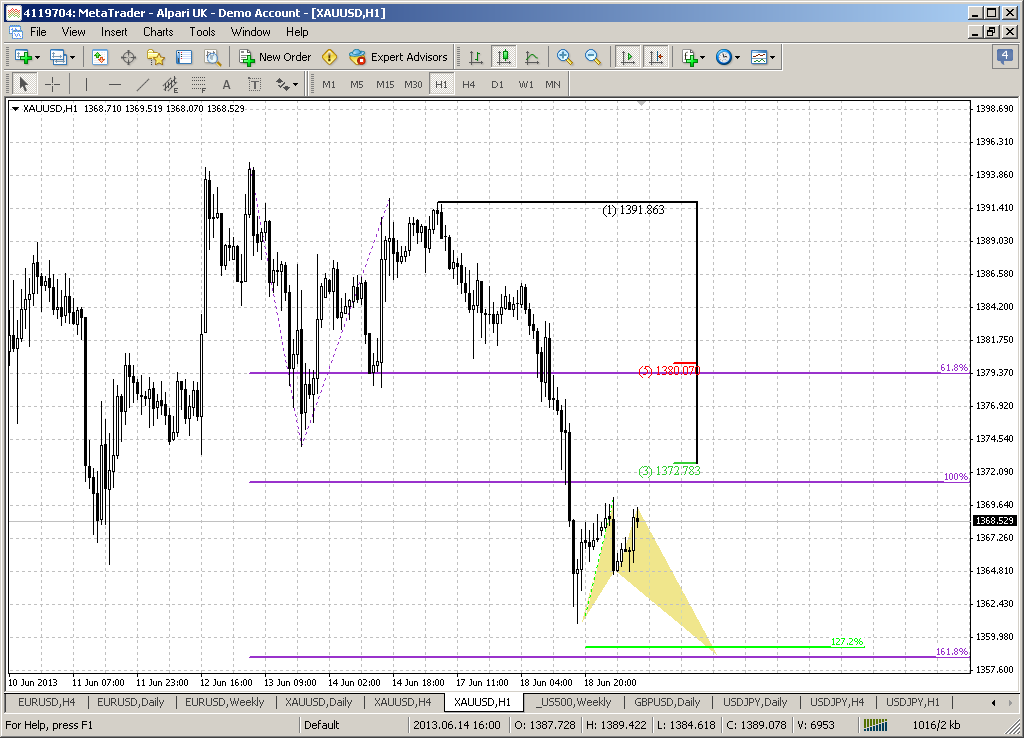
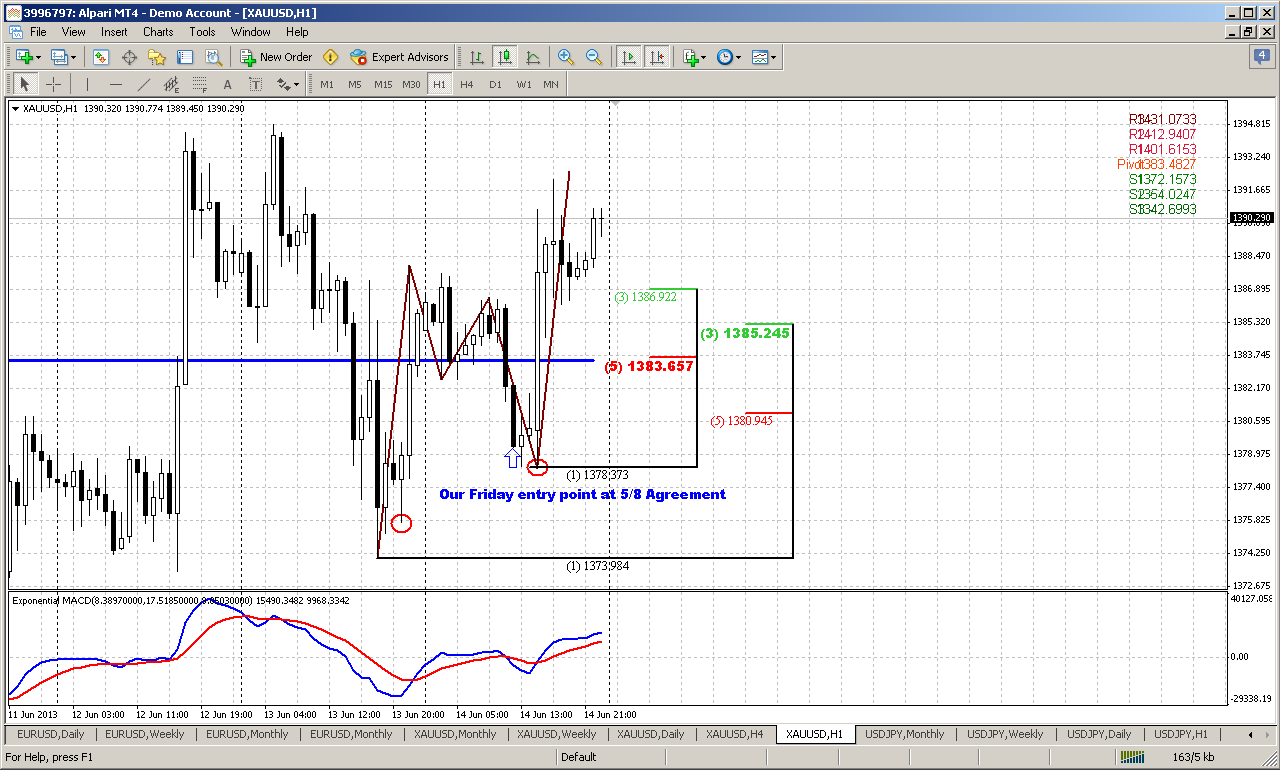
1-hour
So here how it will look like. Recall the tactic that we’ve applied on Friday. Our idea was to enter against stop grabber’s low at AB-CD retracement to Fib support. Market has passed slightly deeper than 5/8 support level, but stop grabber has survived and low remains intact. Now we can try to do the same. Market now has accomplished upward AB=CD move, hence it could show some retracement down. If it will happen – 1383-1385 level looks attractive, since this is Confluence support and WPP. Your risk with this entry will be 1378 low of stop grabber. Once we will take long position and if market will reach its 1395 target – we will be able shift this position to risk free by moving stops to breakeven. Partially position could be closed if you would like to guarantee real profit from this trade. By this procedure we will prepare for FOMC and will be possessed to the upside without risk.
But, guys, this plan only for those who would like to enter long. If you do not belong to them – wait, as we’ve said either end of upward bounce on daily time frame or downward breakout and erasing of current bullish context.
Conclusion:
Technically and fundamentally gold market stands in long-term bearish motion, but extreme oversold level on monthly time frame puts limitations on positions and targets that we can get on lower time frames. That’s why currently it is very dangerous trying to keep shorts significantly below current lows around 1320. By May close we’ve got VOB pattern that gives us forecast for long-term price behavior and promise compounded downward move in shape of some AB-CD.
On short-term charts and due FOMC meeting coming on current week – market could show upward bounce. We will try to apply a bit sophisticated method that is based on combining different time frame patterns to get position as low risk as possible. If you’re bearish, then you should wait either ending of upward bounce or downward breakout of daily flag pattern.
The technical portion of Sive's analysis owes a great deal to Joe DiNapoli's methods, and uses a number of Joe's proprietary indicators. Please note that Sive's analysis is his own view of the market and is not endorsed by Joe DiNapoli or any related companies.
On coming week there will be single major event that could significantly impact on level of gold prices. Hardly it will change sentiment from top to bottom, but could trigger significant move. Obviously I’m speaking about FOMC meeting. As some inflation shadowed hazard has appeared, as well as light decline of statistical data – gold has got supportive sentiment. Thus, U.S. data on Friday showed consumer sentiment edged off a six-year high in June, while manufacturing output picked up a bit last month after two straight months of declines, suggesting the economy remains on a moderate growth path. But what really was supportive is wholesale price jumped in May as gasoline and food prices rebounded. So, results of FOMC meeting will be thrilling and most economists expect the Fed to scale back the size of its bond purchases by year end, and several expect reduced buying as early as September, a Reuters poll showed. Current run in safe haven also partially was triggered by uncertainty as from the Fed as from BoJ. You can read about it in current Forex Pro Weekly Thread.
More fuel to the fire comes from geopolitical instability on Middle East. Traders said rising geopolitical tensions in the Middle East also boosted the metal's safe-haven appeal. Western diplomats said the United States is considering setting up a no-fly zone in Syria, which would represent its first intervention in that civil war. Still hardly this will be dominating factor. Middle East stands in the flame for considerable period of time already and on significantly more territory than just Syria. Egypt, Lebanon, Turkey, Tunisia, Iraq – never is a stable geopolitical situation. It’s just not new, but it’s there. Syria is a bit “new”, that’s why it attracts more attention.
So, if we will get something new from the Fed gold market could take part in pay-off with bond and bubble on stock markets that could blow off. There are two major driving forces on gold. First is periods of crisis and tragedy and another one is inflation. Until one of them will not appear, gold will remain under pressure, even if it will show some bounce based on money flow from equities.
Another relative confirmation of low activity with upward action is U.S. Comex gold futures for August delivery settled up $9.80 at $1,387.60. Turnover was very low as trading volume was under 100,000 lots versus its 30-day average of 220’000, preliminary Reuters data showed. Platinum and palladium have shown significant decline on past week as well.
And finally again – SPDR Fund declared outflow of 6.3 tonnes of gold on Thursday reversing gains earlier this week.
Despite on gold holding in tight range and even small appreciation, CFTC reports shows declining of net long speculative position, and take a look – increasing of Open Interest. This confirms that bear trend is still intact.
Thus, some gold appreciation is possible based on coming events in medium-term perspective, but mostly this appreciation will be temporal and related to possible money flow, but not to global changes in fundamental picture. Long term bearish trend on gold still intact.
Monthly
June candle is rather small and has not changed much on previous week, so I can’t add more comments on monthly time frame. In really big picture we’ve got Volatility Breakout (VOB) pattern on May. This pattern usually provides solid reliability, since it based not on some price averaging as other indicators but on statistical measure of standard deviation, i.e. on volatility. This is in fact the core of the market’s breath and if we can call it in this way – some statistical law that could lead to significant consequences.
Now we have VOB setup here. Market never was as oversold as it stands now. Take a look at DOSC indicator again – market now stands at all time extreme point that is lower than the previous extreme value in 2008. This gives us very significant conclusion that will be hard to overvalue. Usually when market forms VOB it leads to 2-leg downward move in some shape of AB-CD, but not necessary that AB should be equal to CD. The minimum target of VOB is 0.618 extension of AB-CD, where AB – initial swing down that has given VOB. Other words – now market is forming AB move. Then some retracement up should follow and then downward continuation, i.e. extension.
So two significant conclusions could be made here: whatever bounce market will show here – this probably will be just retracement but not a reversal – the same thought we’ve made based on fundamental picture analysis. Second – market probably will reach some deeper support level and closest one stands around 1200.
Weekly
On weekly time frame you can see impact of oversold on monthly. Once we’ve said that if you even take short position on weekly – do not point the target below previous lows, since market extremely oversold. Thus, we can see here that price can’t move lower and stand in the range of April sell-off.
Very often such significant moves, as we’ve got on April forces market to stand in its range for some time. It looks like market accommodates for new range, trying to understand what is going on. Here we have particularly this case. Seven weeks in a row market stands in the range of April sell-off. Two previous weeks action was not impressive and market mostly was indecision and has formed candles with high upper shadow. Still market gives us one very significant moment. Price has tested MPP and moved below it. So, it confirms long-term bearish sentiment. Following pivot points application, market probably should start move to MPS1 that stands precisely at current lows. Thus it will be interesting what impact will follow after FOMC meeting. Whether market will re-test MPP with slightly higher high or start move down if no comment will follow concerning QE close…
In a bigger picture the most action should happen when market will pass through either upper border 1500 or lower one – 1320. But as we can see on monthly chart – gold can stand in consolidation rather long time. Besides, price hardly will easily pass through 1320 due oversold, as I said. There is only one way how it could happen. Fundamental factors that hunt gold in extreme oversold conditions – the same factors could continue to dominate over technical moments, but it is very difficult to predict. Currently it looks their impact gradually becomes lighter. So, most probable some kind of range behavior, at least within nearest 2-3 months due summer time and bearish seasonal trend. I can’t exclude that despite overall bearish context we might be interesting with searching possibility even for short-term long entry around 1320 with some short-term targets.
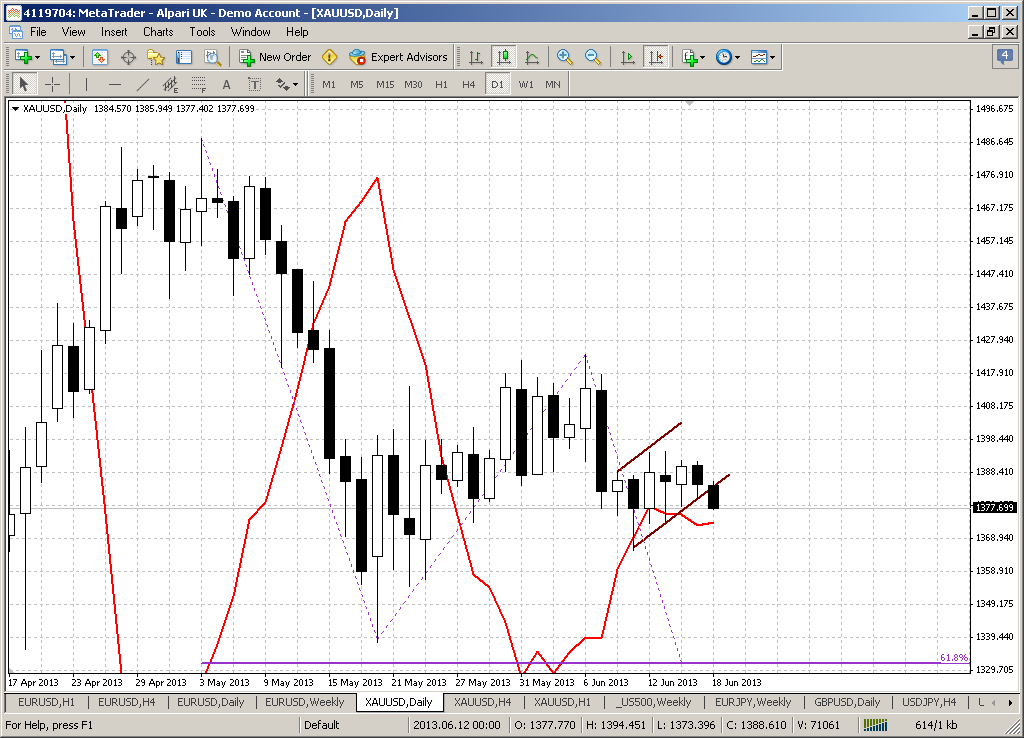
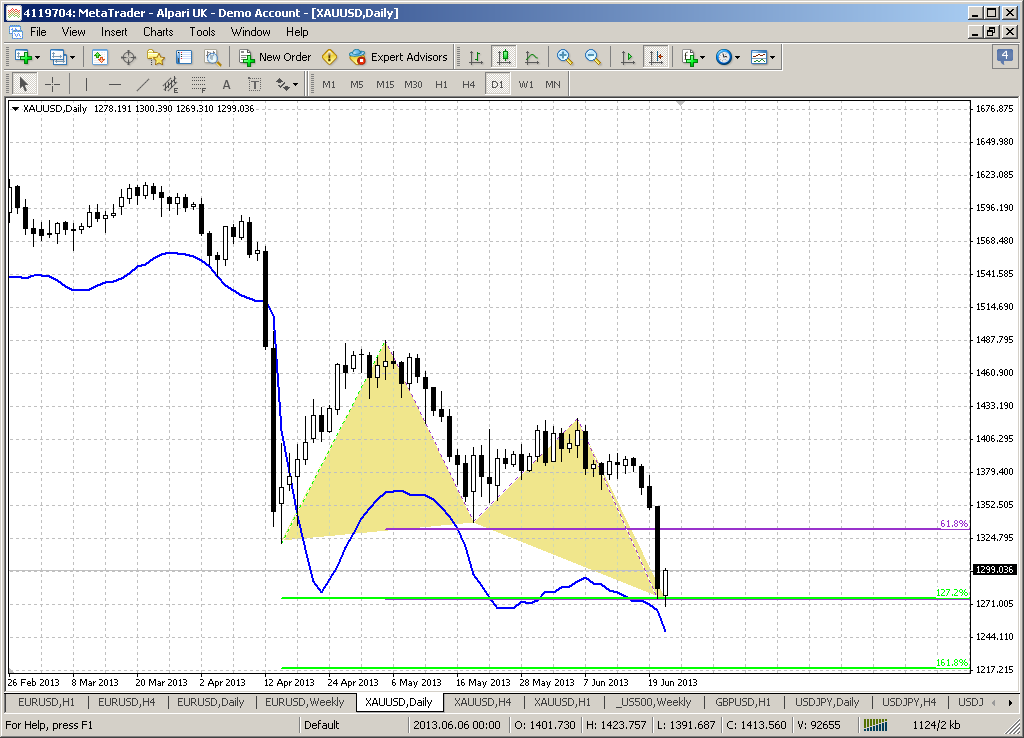
Daily
Now we are shifting to most interest part of analysis, since possible trades on coming week are based on daily patterns. Actually it’s all about the flag. We’ve talked previously that we have bullish trend here and 3 side-by-side bullish stop grabbers that has minimum target – high at 1423 area – it should be taken out. At the same time the invalidation point of these patterns are their lows. If market will take them out, these patterns will be vanished. That coincides with flag breakout direction. Theoretically it’s bearish, but since we have contradictive patterns we just can’t take short position right now. So, if you’re bearish – wait either upward action and then look how market will behave there around 1423 or downward breakout and then take short and nearest rally up.
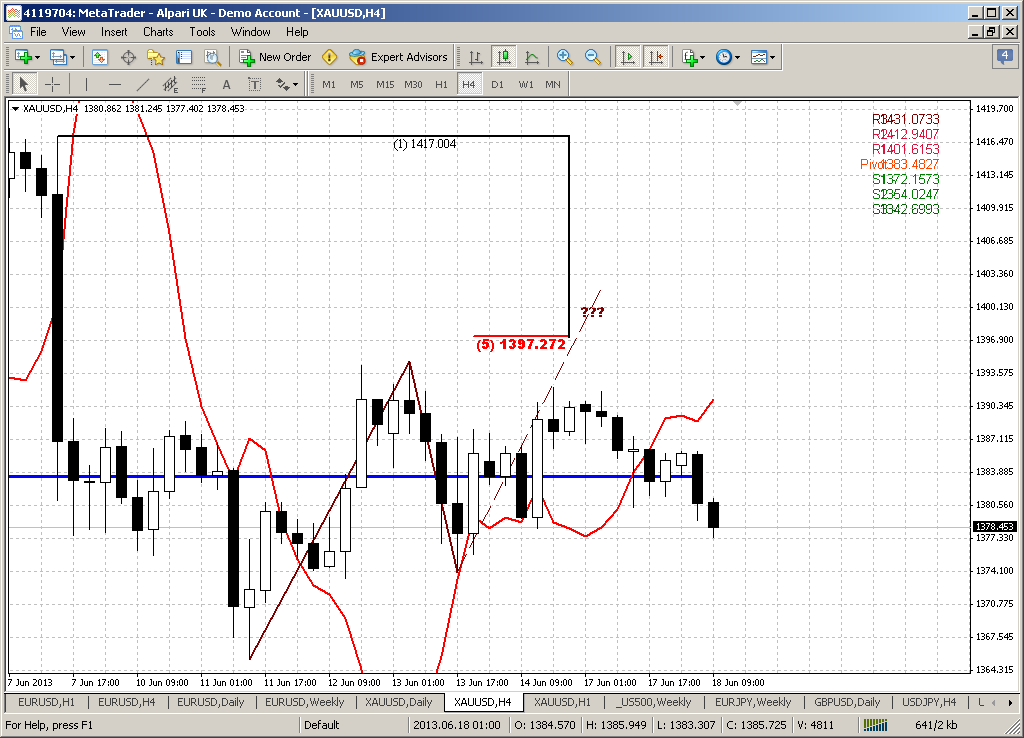
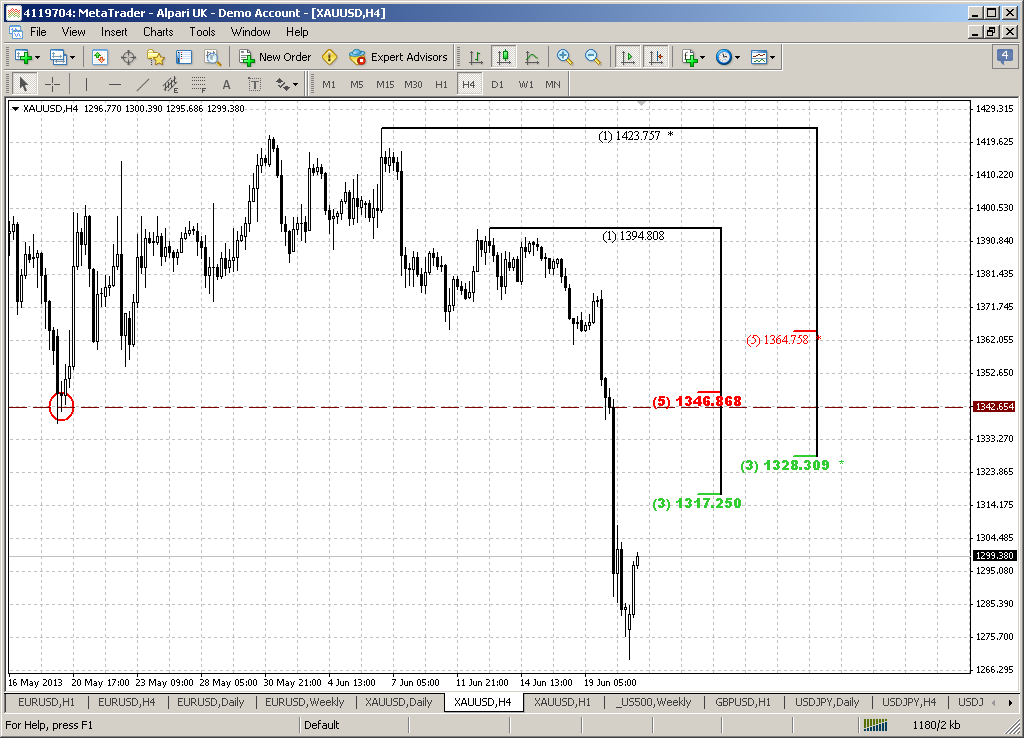
4-hour
Now we have to be extra careful, since start discussing of setup that could let us to take position with very small risk but potentially high return. It could be a bit sophisticated but follow me carefully. On Friday, if you remember, we’ve discused just the same pattern here. I hope that you’ve taken long based on our trading plan. In this case you will need nothing, just manage position as we will discuss further. If you have missed the enter – here is the last chance, I suppose, since we’ve got another stop grabber. You may try to take position on retracement if it will follow. These patterns have closer target – previous swing high on 4 hour chart around 1395. If we will lucky it could turn to AB=CD pattern right to 1401 agreement. Since possessing long term, based on daily stop grabbers is a bit tricky currently – we can take position on 4-hour stop grabbers, that probably will reach targets. This will allow us to move stop orders at breakeven and by this action take position on daily patterns without risk. That’s the plan. When FOMC meeting will start – that will not be a nervous period, we will just watch the movie what will happen. You even will probably could get some profit in your pocket by this time, if close half of position before FOMC.
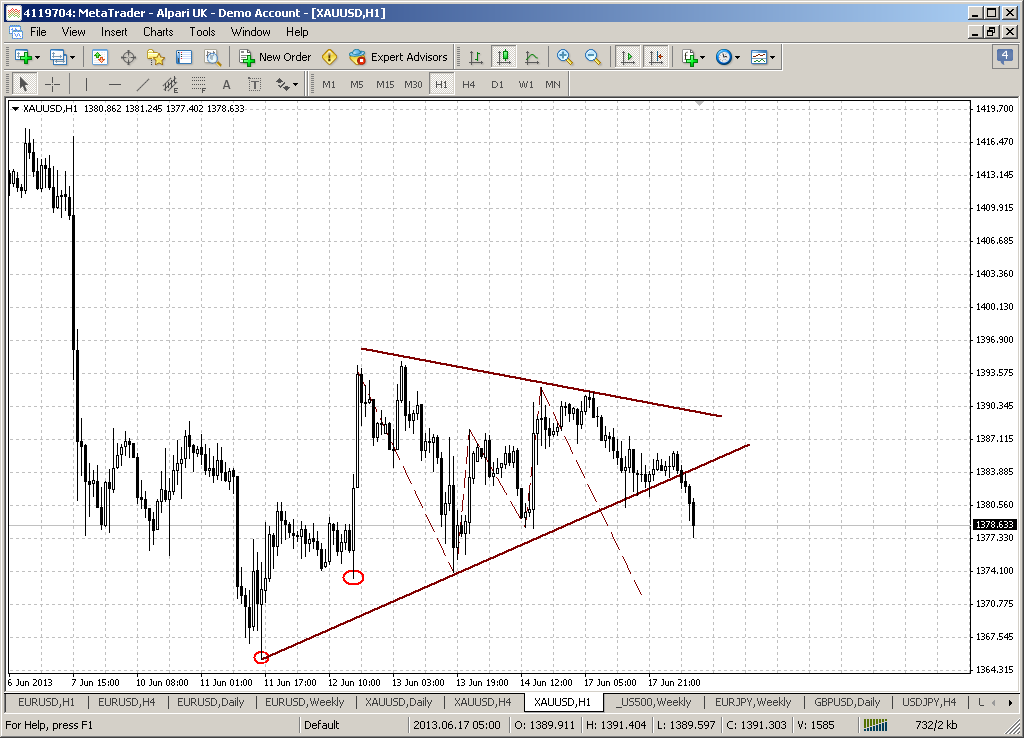
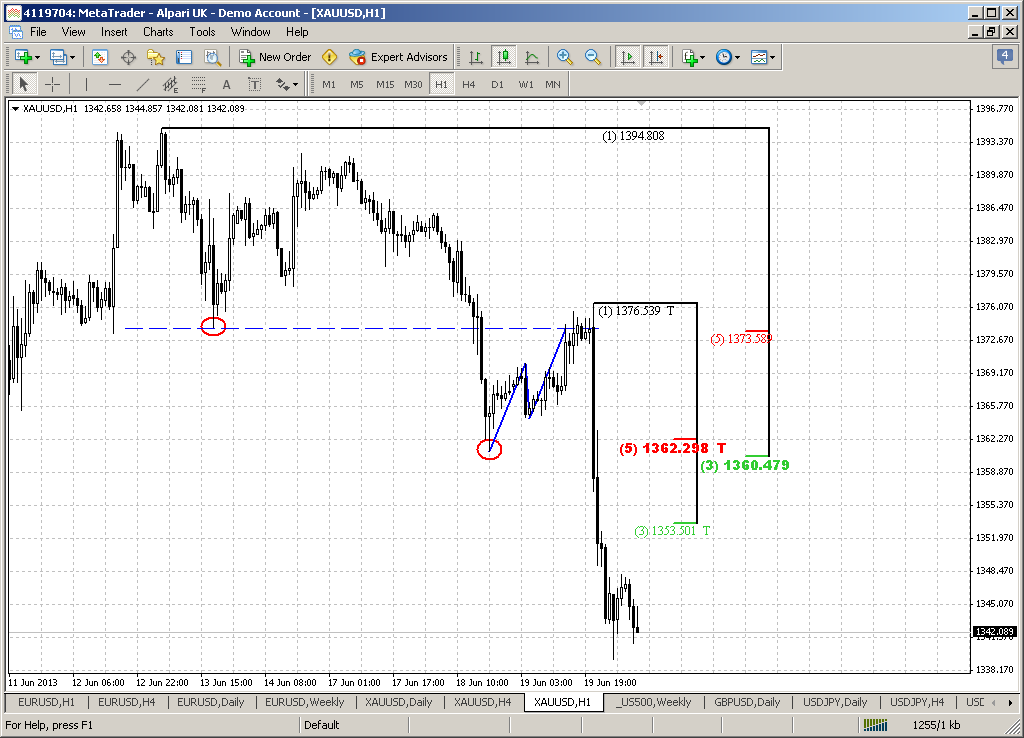
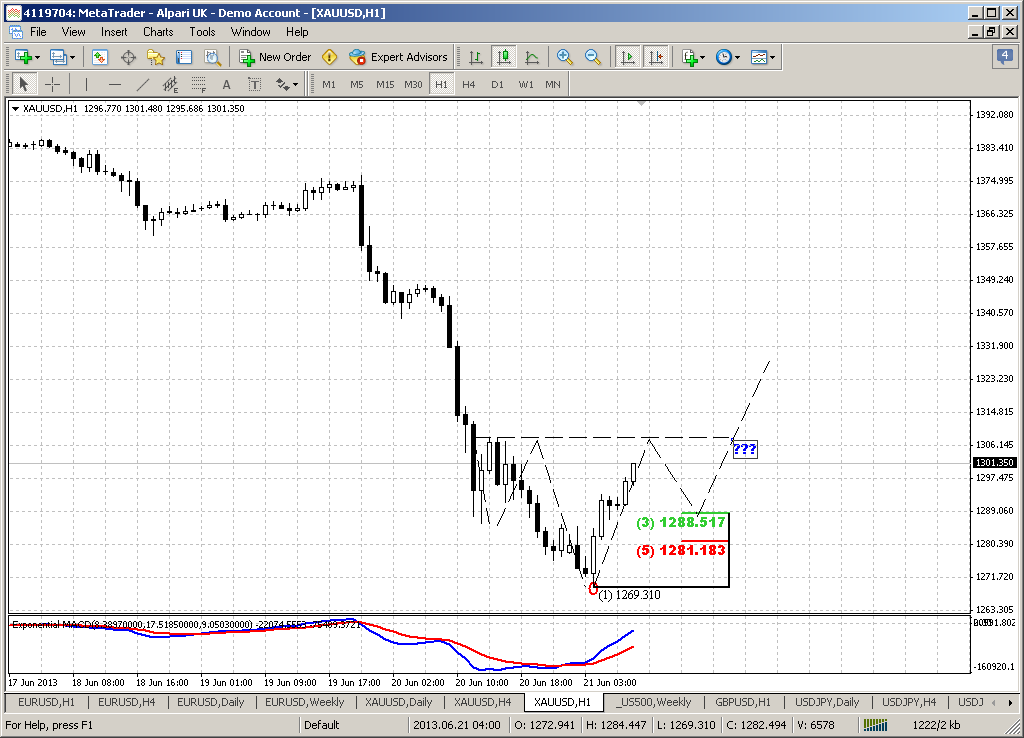
1-hour
So here how it will look like. Recall the tactic that we’ve applied on Friday. Our idea was to enter against stop grabber’s low at AB-CD retracement to Fib support. Market has passed slightly deeper than 5/8 support level, but stop grabber has survived and low remains intact. Now we can try to do the same. Market now has accomplished upward AB=CD move, hence it could show some retracement down. If it will happen – 1383-1385 level looks attractive, since this is Confluence support and WPP. Your risk with this entry will be 1378 low of stop grabber. Once we will take long position and if market will reach its 1395 target – we will be able shift this position to risk free by moving stops to breakeven. Partially position could be closed if you would like to guarantee real profit from this trade. By this procedure we will prepare for FOMC and will be possessed to the upside without risk.
But, guys, this plan only for those who would like to enter long. If you do not belong to them – wait, as we’ve said either end of upward bounce on daily time frame or downward breakout and erasing of current bullish context.
Conclusion:
Technically and fundamentally gold market stands in long-term bearish motion, but extreme oversold level on monthly time frame puts limitations on positions and targets that we can get on lower time frames. That’s why currently it is very dangerous trying to keep shorts significantly below current lows around 1320. By May close we’ve got VOB pattern that gives us forecast for long-term price behavior and promise compounded downward move in shape of some AB-CD.
On short-term charts and due FOMC meeting coming on current week – market could show upward bounce. We will try to apply a bit sophisticated method that is based on combining different time frame patterns to get position as low risk as possible. If you’re bearish, then you should wait either ending of upward bounce or downward breakout of daily flag pattern.
The technical portion of Sive's analysis owes a great deal to Joe DiNapoli's methods, and uses a number of Joe's proprietary indicators. Please note that Sive's analysis is his own view of the market and is not endorsed by Joe DiNapoli or any related companies.