GOLD PRO Weekly October 07-11, 2013

Minimax, I am a really newbie. I mean REALLY. >< How did you manage to get the old data? I want to research for 30 years about anything. But I realized it was very difficult to obtain. Please share your ways that how? Thanks in advance ~

Hi Paul,

which you are interested in? Specify, please..

I find the best free end of day chartist ProRealTime, a lot of history, excellent tools, regret only Fractal indicator is not available and extremly bad solution is for making tempaltes or better - there is none, so I have to use more chartist.

The rest is Uncle Google, hehe... Good free history charts, for viewing only, are available at Chart R Us the rest is the matter of your time.

Good luck!
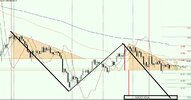
 
One more technical view on gold going down. Just my opinion, make sense?
gold-2013-10-09.jpg

P.S. Just noticed a possible bullish stop grabber on the daily chart, but I think even if it works, the triangle still stands
 
Hi guys!
I think of the scenario that Sive is sharing, the one in which there will be a sell off in equities and gold too. This scenario assumes that Fed will announce the beginning of the end. No more money flow on the market.
But what if there will be no announcement of that kind, neither in Oct. or Dec.? In this case I think the equities market will bubble till next year, because it already have digested the limitation of the QE and the money will keep coming.
G7 space is very favorable right now to the bubble in equities; there is plenty of money in US, Europe and Japan.
 
it could be and then again it might not. so since i have no clue how it's going to play out, that is the reason why i concentrate on intraday and only take signals on short TFs and ride 50 to 150 pips on moves that last up to 30 mins. if the market is really slow, then 2 hrs max. the faster out, the less risk exposure.
 
Back
Top