Sive Morten
Special Consultant to the FPA
- Messages
- 18,690
Fundamentals
(Reuters) - Gold held near its highest in more than a year on Friday as the U.S. dollar dropped and weak economic data lowered expectations of a December interest rate rise in the United States. The U.S. dollar hit a more than 2-1/2-year low against a basket of major rivals on reduced expectations for another Federal Reserve rate increase this year, while the euro hit multi-year highs after European Central Bank President Mario Draghi suggested that the ECB might begin tapering its massive stimulus program this fall.
A weaker dollar fuels demand for gold by making it cheaper for holders of other currencies, and lower bond yields reduce the opportunity cost of owning non-yielding bullion. Interest rate rises push up bond yields and boost the dollar.
Spot gold was down 0.1 percent at $1,347.8 by 3:43 p.m. EDT (1943 GMT) after hitting $1,357.54, its highest since August 2016. It was up 1.7 percent this week, notching a third consecutive weekly gain.
U.S. gold futures for December delivery settled at $1,351.2.
Julius Baer analyst Carsten Menke pinned the rise to the weak dollar and hopes that interest rate rises would be delayed. New York Federal Reserve President William Dudley in a speech on Thursday did not repeat an assertion three weeks ago that he expects to raise rates once more this year.
Demand for gold as a safe haven investment was strong as South Korea braced for a possible further missile test by North Korea when it marks its founding anniversary on Saturday. But high prices have weakened demand for physical gold in top consumer Asia.
"By its own account, the Chinese central bank (PBoC) bought no gold in August, either," Commerzbank said in a note. "This was already the tenth consecutive month in which the PBoC did not further increase its gold reserves."
Technical resistance was at $1,353, gold's peak last September, but upward momentum could lift it to the 2016 high of $1,375, ScotiaMocatta analysts said.
Goldman Sachs: North Korea tensions aren't pushing up gold prices — Trump is
by CNBC
Despite many claims to the contrary, North Korea tensions aren't actually what's driving the rally in gold, Goldman Sachs said in a Tuesday note.
Instead, the bank said, uncertainty inspired by President Donald Trump has boosted the yellow metal — but that's set to fade.
Spot gold has certainly rallied of late, climbing from levels under $1,212 an ounce in July to as high as $1,342.90 this week, touching its highest levels in around a year, according to Reuters data.
Gold, which traditionally acts as a safe-haven play when investors turn nervous, was at $1,338.50 an ounce at 9:41 a.m. HK/SIN on Wednesday.
Some of the metal's gains have coincided with increased tensions on the Korean Peninsula, including when North Korea claimed a successful hydrogen bomb test on Sunday.
Goldman, however, didn't think the gold rally was unrelated to the North Korean tensions, just that it only explained around $15 of the more than $100 rally.
"We find that the events in Washington over the past two months play a far larger role in the recent gold rally followed by a weaker dollar," it said, adding that's the reason the yellow metal likely wouldn't hold its gains.
Barring a "substantial" escalation of North Korean tensions, Goldman said it was sticking with an end-of-year gold forecast of $1,250 an ounce.
It said Trump's approval rating was a good proxy for Washington risks, correlating with both interest rates and gold prices. Together with a weaker dollar, that accounted for around 85 percent of gold's recent rally, it said.
Still, it added, that risk was set to fade.
"In coming months, the unfortunate aftermath of hurricane Harvey suggests that Washington is going to have to overcome their differences, pass spending bills, try harder to avoid a government shutdown and pursue infrastructure projects sooner than later," it said.
Goldman has lowered its estimate of the probability of a government shutdown to around 15 percent from 35 percent.
It added that gold can offer a good hedge against global risks when the event leads to a debasement of the dollar, but on average, it doesn't respond too much to geopolitics after controlling for macro variables.
That meant the situation on the Korean Peninsula wasn't likely to propel gold much, Goldman said.
North Korean tensions were "very serious," but the market wasn't adding much of a risk premium, suggesting it still viewed military escalation and disarmament as tail risks, the bank added.
"North Korea may not really have an incentive to launch an attack as this would likely lead to retaliation. But it is also unlikely to give up nuclear capabilities as it likely sees them as a guarantee of its safety," it said. "As a result, from game theory perspective, it is a stable equilibrium."
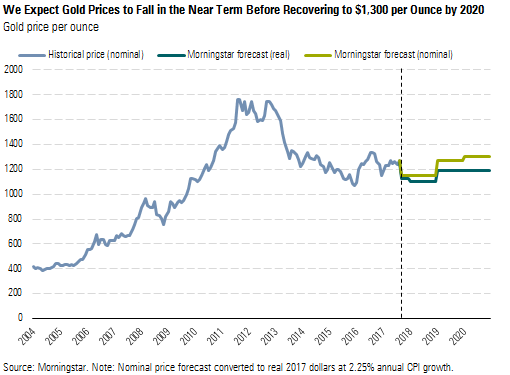
In recent research Morningstar.com analysts also think that gold price should drop in 2018-2019, while 1300 level will be re-established only closer to 2020:
Well, we think that investors mostly underestimate the strength of political shifts that now are going in the world. There are some reasons for that. First this has not happened since late 80's. Second - this shifts hurt mostly those who controls major mass media resources. That' why they keep reality faded but place in front either virtual reality or some secondary events, just to turn people mind out of major processes that right now stand in the world.
As a result, too many people think that nothing is changing right now and mostly world is the same, but it is not so. We think that geopolitical processes will be major driving factor for gold in nearest 3-5 years and they overrule any financial factors, although volatility could higher. That's why we do not agree with view that gold will drop to 1000-1200$ as it is followed from Goldman and Morningstar analysis.
I give you just one example from most recent events. Mr. Un rocket flied over Japan. This event was shadowed so strong in media that nobody has given it some exceptional status. This even has been put in a chain of "ordinary" events from N. Korea. But you just think - nuclear rocket flies over Japan. Is it normal?Is it OK, when nuclear rockets just fly here and there above your head? Why it was not put down by US anti-missile system? This is great chance to show to whole world efficiency and strength of US weapon. US tries do it at any case when they can - to show their high technology military systems and weapons. So, it makes me think that they couldn't do it (may be somebody just doesn't let to do this, i.e. Russia) , or it was too much risk to miss. Now, just think what conclusion has been made by EU, Japan, Middle East countries - US can't protect them from rocket strike, Igis doesn't work or non-efficient and unreliable. It's not needed to remind Syria events... Now I ask you - what international weight any country will have, if it can't protect its gepolitical interests by the power of its weapon?
This explains too warm Abe relation to Putin on recent meeting, this explains first steps of closing anti-Russian sanctions in EU and many other events. This was event of Global scale but it was mostly silenced in media just to not give people to understand this... And there were a lot of such events in recent 1-2 years. Just keep your eyes open and analyze this.")
COT Report
CFTC shows clear bullish sentiment on gold market. Strong growth stands as with net speculative long position as with open interest. There are also some room till extreme values, so gold doesn't stand at overbought here yet. That's why, from sentiment analysis point of view gold has no barriers to go up further yet:

Technical
Monthly
So our monthly view mostly stands the same as gold shows careful upside action in September. As market has shown strong close on August, we probably could put aside our bearish scenario for awhile. If gold will start to show strong bearish action again, we will return back to it. But right now upside scenario has more chances to happen.
On July and August we have tail close. Right now market has reached solid resistance area around 1330. It already has been tested once, but it is still valid. This is not just 3/8 major monthly Fib level. This is also Yearly Pivot Resistance 1 and 0.618 AB-CD target. Right now market still stands close to it.
Next major target will stand around 50% Fib level and Agreement, as it coincides with AB=CD objective point as well. Market could take the shape of butterfly to get there. 1.27 extension also stands in the same area:

Weekly
Weekly picture is very important as for bulls as for bears. So, market finally has broken through 1295 area that it was challenging since the beginning of the year. Trend stands bullish on weekly chart and price is not at overbought by far. In fact, guys, gold market doesn't have any significant resistance till the next 1380 target, which is strong monthly level.
Here we have two AB-CD patterns of different scale. First one is large monthly AB-CD that we've mentioned above and this is 0.618 target that has been hit at 1326$.
Second AB-CD is a minor one and it stands inside CD leg of larger one. Right now we hear a lot of forecasts on gold's weakness, some of the we've put above - it's an opinion of Goldman Sachs and Morningstar. But we also have here technical pattern that could encourage bears. This is possible large weekly "222" Sell that will be formed as soon as price will complete our smaller AB-CD pattern.

What does it mean for us? It means that bulls could be relatively calm until 1377 area. Hardly major reversal will start before this pattern will be completed. Bears should wait also till this moment, because this pattern is very comfortable for trading - it's entry point and invalidation point stands in the same area.
But, this pattern has important flaws. First of all, inner AB-CD target by dry calculation stands 2-3 bucks above previous top. And theoretically, this pattern has more chances to fail and to be not completed. Second, current pace of AB-CD action looks strong as CD leg is faster than AB. This also suggests more dividends to bulls rather than bears. Finally, we have our large AB-CD. When price will get to 1380 - it will be on a half way to 1450 target and far above 1326. Usually major reversals happen, after price meets key targets, but not between them.
That's why, although pattern looks very beautiful, it doesn't have much chances to work...
Daily
As market creeps higher, our Fib levels also change. Thus, nearest support stands around 1316, while K-area has moved to 1300. It seems that on coming week we have floor around it, as market Oversold level stands at 1306. As market has shown minor reaction to 1330 area and jumped for another 20 $, It is more probable that gradual upside action will continue, especially, because between 1330 and 1380 price has no strong resistance levels. Now price is testing the last one - MPR1 around 1347.
Trend is bullish on daily chart, on Thu we've got solid tail close and acceleration while on Fri gold has formed mostly indecision candle. This combination doesn't bring currently idea of solid retracement. Some harmonic pullback could be done, but mostly it should be small.

Intraday
On intraday charts, market has completed our Friday view, when we've suggested just minor retracement down, for re-testing of previous tops and this has been done. Also take a look, in fact - here we have B&B "Buy" pattern. Yes, it looks too small as previous rally was significant, but it matches to all necessary features of B&B - minimum 8 bars of upside action, reaching major Fib support within 2 closes below 3x3 DMA:

Thus, it means that Monday could start with upside action on gold market and B&B could give good chance to go long and take a positions on potential upside continuation with relatively small risk. On hourly chart price has formed nice bullish engulfing pattern at 50% support level:

Conclusion
Long term perspective of gold market becomes more bullish week by week. Although crucial price levels have not been broken yet, but overall performance looks good.
In shorter term perspective price already has passed through 1330 area that's why chances on retracement are melting day by day and upside continuation becomes more probable, especially because gold has no strong resistance above. Next target stands around 1380 area.
The technical portion of Sive's analysis owes a great deal to Joe DiNapoli's methods, and uses a number of Joe's proprietary indicators. Please note that Sive's analysis is his own view of the market and is not endorsed by Joe DiNapoli or any related companies.
(Reuters) - Gold held near its highest in more than a year on Friday as the U.S. dollar dropped and weak economic data lowered expectations of a December interest rate rise in the United States. The U.S. dollar hit a more than 2-1/2-year low against a basket of major rivals on reduced expectations for another Federal Reserve rate increase this year, while the euro hit multi-year highs after European Central Bank President Mario Draghi suggested that the ECB might begin tapering its massive stimulus program this fall.
A weaker dollar fuels demand for gold by making it cheaper for holders of other currencies, and lower bond yields reduce the opportunity cost of owning non-yielding bullion. Interest rate rises push up bond yields and boost the dollar.
Spot gold was down 0.1 percent at $1,347.8 by 3:43 p.m. EDT (1943 GMT) after hitting $1,357.54, its highest since August 2016. It was up 1.7 percent this week, notching a third consecutive weekly gain.
U.S. gold futures for December delivery settled at $1,351.2.
Julius Baer analyst Carsten Menke pinned the rise to the weak dollar and hopes that interest rate rises would be delayed. New York Federal Reserve President William Dudley in a speech on Thursday did not repeat an assertion three weeks ago that he expects to raise rates once more this year.
Demand for gold as a safe haven investment was strong as South Korea braced for a possible further missile test by North Korea when it marks its founding anniversary on Saturday. But high prices have weakened demand for physical gold in top consumer Asia.
"By its own account, the Chinese central bank (PBoC) bought no gold in August, either," Commerzbank said in a note. "This was already the tenth consecutive month in which the PBoC did not further increase its gold reserves."
Technical resistance was at $1,353, gold's peak last September, but upward momentum could lift it to the 2016 high of $1,375, ScotiaMocatta analysts said.
Goldman Sachs: North Korea tensions aren't pushing up gold prices — Trump is
by CNBC
Despite many claims to the contrary, North Korea tensions aren't actually what's driving the rally in gold, Goldman Sachs said in a Tuesday note.
Instead, the bank said, uncertainty inspired by President Donald Trump has boosted the yellow metal — but that's set to fade.
Spot gold has certainly rallied of late, climbing from levels under $1,212 an ounce in July to as high as $1,342.90 this week, touching its highest levels in around a year, according to Reuters data.
Gold, which traditionally acts as a safe-haven play when investors turn nervous, was at $1,338.50 an ounce at 9:41 a.m. HK/SIN on Wednesday.
Some of the metal's gains have coincided with increased tensions on the Korean Peninsula, including when North Korea claimed a successful hydrogen bomb test on Sunday.
Goldman, however, didn't think the gold rally was unrelated to the North Korean tensions, just that it only explained around $15 of the more than $100 rally.
"We find that the events in Washington over the past two months play a far larger role in the recent gold rally followed by a weaker dollar," it said, adding that's the reason the yellow metal likely wouldn't hold its gains.
Barring a "substantial" escalation of North Korean tensions, Goldman said it was sticking with an end-of-year gold forecast of $1,250 an ounce.
It said Trump's approval rating was a good proxy for Washington risks, correlating with both interest rates and gold prices. Together with a weaker dollar, that accounted for around 85 percent of gold's recent rally, it said.
Still, it added, that risk was set to fade.
"In coming months, the unfortunate aftermath of hurricane Harvey suggests that Washington is going to have to overcome their differences, pass spending bills, try harder to avoid a government shutdown and pursue infrastructure projects sooner than later," it said.
Goldman has lowered its estimate of the probability of a government shutdown to around 15 percent from 35 percent.
It added that gold can offer a good hedge against global risks when the event leads to a debasement of the dollar, but on average, it doesn't respond too much to geopolitics after controlling for macro variables.
That meant the situation on the Korean Peninsula wasn't likely to propel gold much, Goldman said.
North Korean tensions were "very serious," but the market wasn't adding much of a risk premium, suggesting it still viewed military escalation and disarmament as tail risks, the bank added.
"North Korea may not really have an incentive to launch an attack as this would likely lead to retaliation. But it is also unlikely to give up nuclear capabilities as it likely sees them as a guarantee of its safety," it said. "As a result, from game theory perspective, it is a stable equilibrium."
In recent research Morningstar.com analysts also think that gold price should drop in 2018-2019, while 1300 level will be re-established only closer to 2020:
Well, we think that investors mostly underestimate the strength of political shifts that now are going in the world. There are some reasons for that. First this has not happened since late 80's. Second - this shifts hurt mostly those who controls major mass media resources. That' why they keep reality faded but place in front either virtual reality or some secondary events, just to turn people mind out of major processes that right now stand in the world.
As a result, too many people think that nothing is changing right now and mostly world is the same, but it is not so. We think that geopolitical processes will be major driving factor for gold in nearest 3-5 years and they overrule any financial factors, although volatility could higher. That's why we do not agree with view that gold will drop to 1000-1200$ as it is followed from Goldman and Morningstar analysis.
I give you just one example from most recent events. Mr. Un rocket flied over Japan. This event was shadowed so strong in media that nobody has given it some exceptional status. This even has been put in a chain of "ordinary" events from N. Korea. But you just think - nuclear rocket flies over Japan. Is it normal?Is it OK, when nuclear rockets just fly here and there above your head? Why it was not put down by US anti-missile system? This is great chance to show to whole world efficiency and strength of US weapon. US tries do it at any case when they can - to show their high technology military systems and weapons. So, it makes me think that they couldn't do it (may be somebody just doesn't let to do this, i.e. Russia) , or it was too much risk to miss. Now, just think what conclusion has been made by EU, Japan, Middle East countries - US can't protect them from rocket strike, Igis doesn't work or non-efficient and unreliable. It's not needed to remind Syria events... Now I ask you - what international weight any country will have, if it can't protect its gepolitical interests by the power of its weapon?
This explains too warm Abe relation to Putin on recent meeting, this explains first steps of closing anti-Russian sanctions in EU and many other events. This was event of Global scale but it was mostly silenced in media just to not give people to understand this... And there were a lot of such events in recent 1-2 years. Just keep your eyes open and analyze this.
COT Report
CFTC shows clear bullish sentiment on gold market. Strong growth stands as with net speculative long position as with open interest. There are also some room till extreme values, so gold doesn't stand at overbought here yet. That's why, from sentiment analysis point of view gold has no barriers to go up further yet:
Technical
Monthly
So our monthly view mostly stands the same as gold shows careful upside action in September. As market has shown strong close on August, we probably could put aside our bearish scenario for awhile. If gold will start to show strong bearish action again, we will return back to it. But right now upside scenario has more chances to happen.
On July and August we have tail close. Right now market has reached solid resistance area around 1330. It already has been tested once, but it is still valid. This is not just 3/8 major monthly Fib level. This is also Yearly Pivot Resistance 1 and 0.618 AB-CD target. Right now market still stands close to it.
Next major target will stand around 50% Fib level and Agreement, as it coincides with AB=CD objective point as well. Market could take the shape of butterfly to get there. 1.27 extension also stands in the same area:
Weekly
Weekly picture is very important as for bulls as for bears. So, market finally has broken through 1295 area that it was challenging since the beginning of the year. Trend stands bullish on weekly chart and price is not at overbought by far. In fact, guys, gold market doesn't have any significant resistance till the next 1380 target, which is strong monthly level.
Here we have two AB-CD patterns of different scale. First one is large monthly AB-CD that we've mentioned above and this is 0.618 target that has been hit at 1326$.
Second AB-CD is a minor one and it stands inside CD leg of larger one. Right now we hear a lot of forecasts on gold's weakness, some of the we've put above - it's an opinion of Goldman Sachs and Morningstar. But we also have here technical pattern that could encourage bears. This is possible large weekly "222" Sell that will be formed as soon as price will complete our smaller AB-CD pattern.
What does it mean for us? It means that bulls could be relatively calm until 1377 area. Hardly major reversal will start before this pattern will be completed. Bears should wait also till this moment, because this pattern is very comfortable for trading - it's entry point and invalidation point stands in the same area.
But, this pattern has important flaws. First of all, inner AB-CD target by dry calculation stands 2-3 bucks above previous top. And theoretically, this pattern has more chances to fail and to be not completed. Second, current pace of AB-CD action looks strong as CD leg is faster than AB. This also suggests more dividends to bulls rather than bears. Finally, we have our large AB-CD. When price will get to 1380 - it will be on a half way to 1450 target and far above 1326. Usually major reversals happen, after price meets key targets, but not between them.
That's why, although pattern looks very beautiful, it doesn't have much chances to work...
Daily
As market creeps higher, our Fib levels also change. Thus, nearest support stands around 1316, while K-area has moved to 1300. It seems that on coming week we have floor around it, as market Oversold level stands at 1306. As market has shown minor reaction to 1330 area and jumped for another 20 $, It is more probable that gradual upside action will continue, especially, because between 1330 and 1380 price has no strong resistance levels. Now price is testing the last one - MPR1 around 1347.
Trend is bullish on daily chart, on Thu we've got solid tail close and acceleration while on Fri gold has formed mostly indecision candle. This combination doesn't bring currently idea of solid retracement. Some harmonic pullback could be done, but mostly it should be small.
Intraday
On intraday charts, market has completed our Friday view, when we've suggested just minor retracement down, for re-testing of previous tops and this has been done. Also take a look, in fact - here we have B&B "Buy" pattern. Yes, it looks too small as previous rally was significant, but it matches to all necessary features of B&B - minimum 8 bars of upside action, reaching major Fib support within 2 closes below 3x3 DMA:
Thus, it means that Monday could start with upside action on gold market and B&B could give good chance to go long and take a positions on potential upside continuation with relatively small risk. On hourly chart price has formed nice bullish engulfing pattern at 50% support level:
Conclusion
Long term perspective of gold market becomes more bullish week by week. Although crucial price levels have not been broken yet, but overall performance looks good.
In shorter term perspective price already has passed through 1330 area that's why chances on retracement are melting day by day and upside continuation becomes more probable, especially because gold has no strong resistance above. Next target stands around 1380 area.
The technical portion of Sive's analysis owes a great deal to Joe DiNapoli's methods, and uses a number of Joe's proprietary indicators. Please note that Sive's analysis is his own view of the market and is not endorsed by Joe DiNapoli or any related companies.