My personal FX pairs and XAUUSD analysis

Dollar Index (#DXY): Important Breakout

So the range, that we spotted earlier on Dollar Index, is finally broken.
The market successfully closed above that on a daily.

Now a further bullish continuation is expected.
Next target - 105.1
 

Attachments

  • DXY.jpg
    DXY.jpg
    89.2 KB · Views: 1
#CADJPY: Bullish Outlook Explained

CADJPY broke and closed above a wide horizontal supply zone on a daily.
The broken structure turned into a demand zone now.

Probabilities will be high that the price will bounce from that.
Next resistance - 100.95
 

Attachments

  • cadjpy.jpg
    cadjpy.jpg
    93.9 KB · Views: 1
Gold (#XAUUSD): Your Trading Plan For Next Week

⚠️Gold reached a solid horizontal key level this week.
The price formed a doji candle on that on Thursday and then a rejection candle was formed.

We see the attempt of buyers to push.
To catch a pullback, watch a falling parallel channel and a minor horizontal supply zone.
I would suggest waiting for a bullish breakout of these 2. It will most likely trigger the initiation of a correctional movement.
Let 4h candle close above the trend line and a yellow area to confirm the breakout.

Goal will be 1866.

I will monitor this trading setup and post an update later on.
 

Attachments

  • gold.jpg
    gold.jpg
    73.1 KB · Views: 1
EURNZD: Classic Bullish Setup

EURNZD broke and closed above a neckline of a huge ascending triangle formation on a daily.
Watch the underlined blue zone carefully. It is a contracting buy zone based on a trend line and a broken neckline.

I will expect a bullish wave from that.
Next resistance - 0.728
 

Attachments

  • eurnzd.jpg
    eurnzd.jpg
    100.6 KB · Views: 1
USDJPY: Key Levels to Watch This Week

Here is my fresh structure analysis for ⚠️USDJPY.

Resistance 1: 134.48 - 135.475 area
Resistance 2: 137.6 - 138.6 area

Support 1: 132.6 - 132.9 area
Support 2: 129.7 - 131.05 area
Support 3: 127.2 - 128.2 area

Consider these structures for pullback, breakout trading.
 

Attachments

  • usdjpy.jpg
    usdjpy.jpg
    63.2 KB · Views: 1
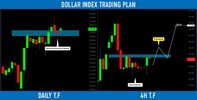
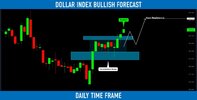
Dollar Index (#DXY): Your Detailed Trading Plan

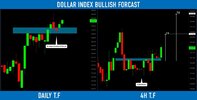
We have spotted earlier a confirmed structure breakout on Dollar Index.
The market is retesting that at the moment.

To catch a bullish move from that with a confirmation, watch a double-bottom pattern on the 4H time frame.

104.05 - 104.09 is its neckline.
Wait for its bullish breakout; we need a 4H candle close above that to confirm the violation.

A bullish continuation will be expected then to 104.55.

If the price sets a new lower low, the setup will become invalid.
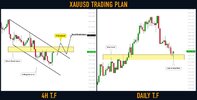
 

Attachments

  • dxy.jpg
    dxy.jpg
    100.7 KB · Views: 1
#CADJPY: Bullish Outlook Explained

CADJPY broke and closed above a solid horizontal supply zone on a daily.
The broken structure turned into a demand zone.

Probabilities are high that a bullish wave will initiate from that.
The goal for buyers - 101.0
 

Attachments

  • cadjpy.jpg
    cadjpy.jpg
    94.9 KB · Views: 1
#NZDJPY: Pullback From Key Level

NZDJPY is taking off from key support.
The price formed a double bottom on that and broke its neckline.

Goals: 84.35 / 84.8
 

Attachments

  • nzdjpy.jpg
    nzdjpy.jpg
    93.4 KB · Views: 1
#USDCAD: Important Breakout

USDCAD suddenly bounced yesterday.
The price formed a high momentum bullish candle, breaking a solid horizontal resistance and a primary falling trend line.

I believe that bulls may push the price much higher now.
Next goal - 1.366
 

Attachments

  • usdcad.jpg
    usdcad.jpg
    111.1 KB · Views: 1
DOLLAR INDEX (#DXY) Bullish Continuation

Update for my yesterday's post on Dollar Index.

The market successfully broke the neckline of a triple bottom pattern on 4H.
We see a positive bullish reaction after a retest.

A bullish continuation is expected now to 104.56 / 104.95
 

Attachments

  • dxy.jpg
    dxy.jpg
    100.6 KB · Views: 1
Back
Top