My personal FX pairs and XAUUSD analysis

[Here’s why you need proper risk management in trading]

Imagine:

There are two traders, John and Sally.

They both start with a $1,000 account
John is an aggressive trader and he risks $250 on each trade.

Sally is a conservative trader and she risks $20 on each trade.

Both adopt a trading strategy that wins 50% of the time with an average of 1:2 risk to reward.

Over the next 8 trades, the outcomes are Lose Lose Lose Lose Win Win Win Win.

Here’s the outcome for John:

-$250 -$250 -$250 -$250 = BLOW UP

Here’s the outcome for Sally:

-$20 -$20 -$20 -$20 +$40 +$40 +$40 +$40 = +$80

Do you see the power of risk management?

So here’s the deal:

As a trader, you’ll encounter losses regularly.

But with proper risk management, you can contain these losses till it feels like an “ant bite”.
 
GOLD (#XAUUSD): Update & The Thing to Watch

The market keeps coiling on a critical daily horizontal support.

Analyzing a 4H time frame, I spotted a potential inverted head & shoulders pattern.
The price has already completed the left shoulder and the head and currently, it is forming the right shoulder.

1842 - 1850 is its horizontal neckline.
The trigger to buy Gold will be its bullish breakout (4h candle close above).
A bullish continuation will be expected to 1866 / 1879 levels then.

If the price sets a new low, the pattern will become invalid though.
 

Attachments

  • gold.jpg
    gold.jpg
    101.5 KB · Views: 1
#CADJPY: Pullback From Key Level

CADJPY reached a solid horizontal key level yesterday.
The price formed an inverted head & shoulders pattern on that on 1H time frame.
Its neckline was broken then.

I expect a bullish move to 100.0 / 100.25
 

Attachments

  • cadjpy.jpg
    cadjpy.jpg
    103.2 KB · Views: 1
#GBPAUD: Important Breakout

GBPAUD was stuck for some time on 1.75 - 1.763 horizontal supply area.
That structure was finally broken this week.
It turned in a demand zone now.

I will expect a bullish wave from that at least to 1.788
15 Best Forex Breakout Strategies
 

Attachments

  • gbpaud.jpg
    gbpaud.jpg
    53.5 KB · Views: 1
#EURGBP: Time to Fall

EURGBP has nicely respected a wide 4H horizontal supply area.
The price formed a triple top pattern on that and broke its neckline then.

I expect a bearish move to 0.8798 / 0.8789
 

Attachments

  • eurgbp.jpg
    eurgbp.jpg
    58 KB · Views: 1
Nasdaq-100 Index (#US100) Short Trade Explained

Nasdaq Index is approaching a key daily structure resistance.
The price has formed a descending triangle formation on that on 1H time frame.
Its neckline was broken, and an hourly candle closed below that, confirming a highly probable coming bearish movement.

Next support: 12000
 

Attachments

  • nasdaq.jpg
    nasdaq.jpg
    105.4 KB · Views: 1
#USDJPY: Waiting For a Breakout

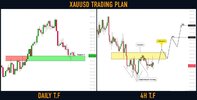
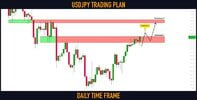
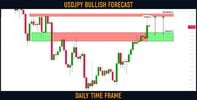
⚠️USDJPY is testing a solid horizontal daily resistance.
If the price breaks and closes above 134.5 - 135.5 area,
it will push the market much higher.

The next goal for buyers will be 137.6 level.
 

Attachments

  • usdjpy.jpg
    usdjpy.jpg
    97 KB · Views: 1
Gold (#XAUUSD): The Breakout!

So it turned out that Gold dropped again.
After the release of US fundamentals on Friday,
bears started to push.

The price managed to close below a key daily horizontal structure support cluster.
It turned into resistance now.

Probabilities are high, and the market will keep falling next week.
Next support - 1787
 

Attachments

  • gold.jpg
    gold.jpg
    61.5 KB · Views: 1
Dollar Index (#DXY): Key Levels to Watch

Here is my latest structure analysis for ⚠️Dollar Index.

Resistance 1: 105.3 - 105.8 area
Resistance 2: 106.8 - 107.2 area
Resistance 3: 107.80 - 108 area

Support 1: 103.6 - 103.95 area
Support 2: 102.25 - 103.2 area

Vertical Support 1: rising trend line

Consider these structures for pullback/breakout trading.
 

Attachments

  • dxy.jpg
    dxy.jpg
    67.8 KB · Views: 1
#USDJPY: Bulls May Push Higher

Update for my Friday's post on USDJPY.
The price managed to close above a solid resistance cluster.
It turned into a support now.

The bullish rally will most likely continue.
Next resistance - 137.8

Wait for an occasional retest of a broken structure for safer entries.
 

Attachments

  • usdjpy.jpg
    usdjpy.jpg
    100.3 KB · Views: 1
Back
Top