XTIUSD price analysis

Hello everyone, back again on Monday at the beginning of this week, I hope all members of the FPA community are healthy and happy.

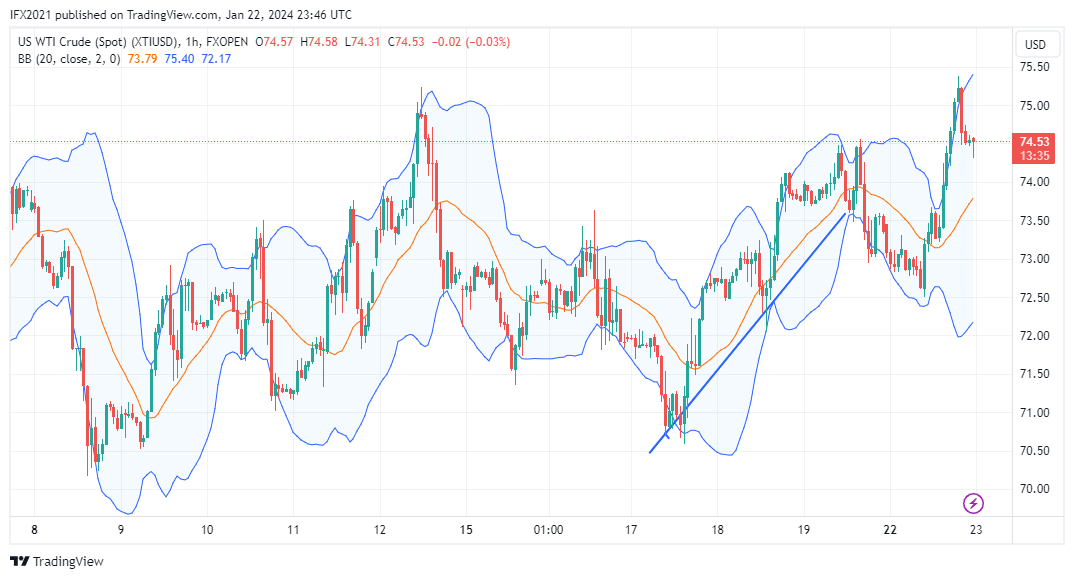
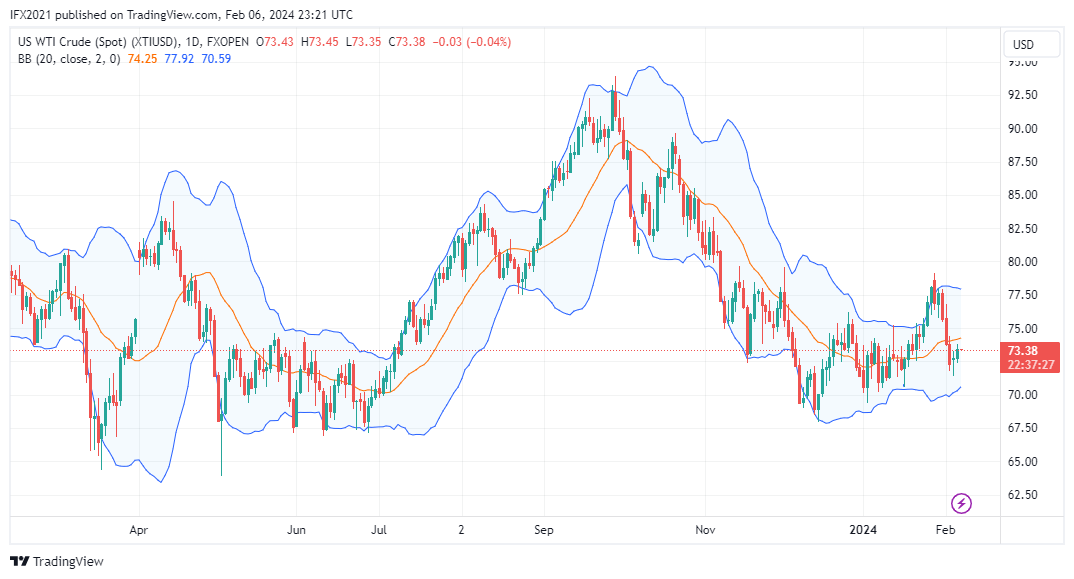
Back again to look at the oil market via the XTIUSD FXOpen chart on Tradingview. US Crude oil prices are currently trading at level 73.36, down 0.58%

Oil related news, from Oilprice, China takes advantage of falling oil prices to Build Inventories. With the drop in prices in the fourth quarter of 2023, China resumed the higher import levels and higher inventory builds.

Another article describes the US vs China battle in terms of clean energy supremacy. It seems that these two countries are still competing to become the country with the best global economy in many fields.

XTIUSD technical analysis

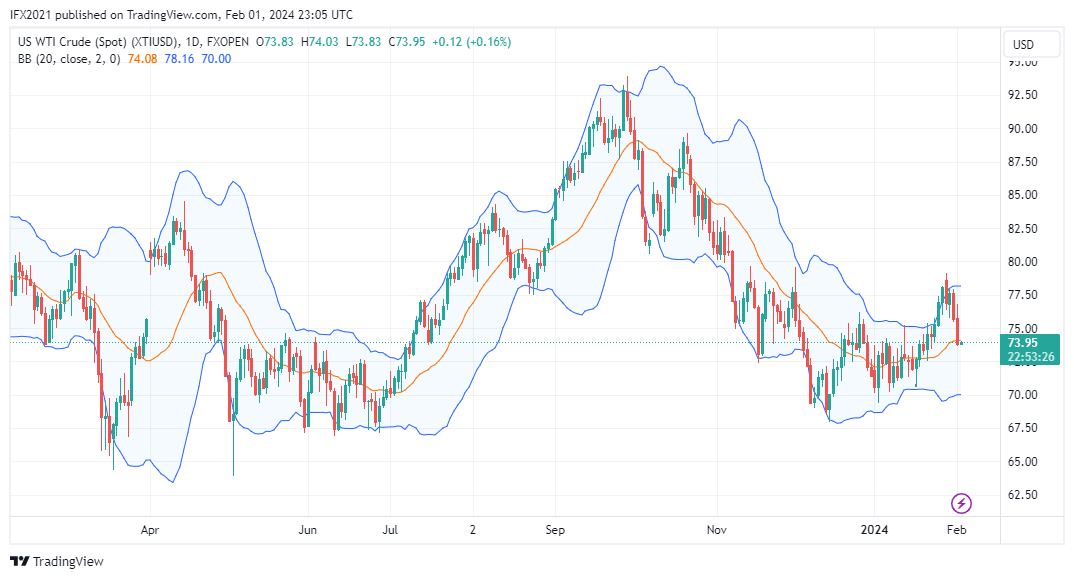
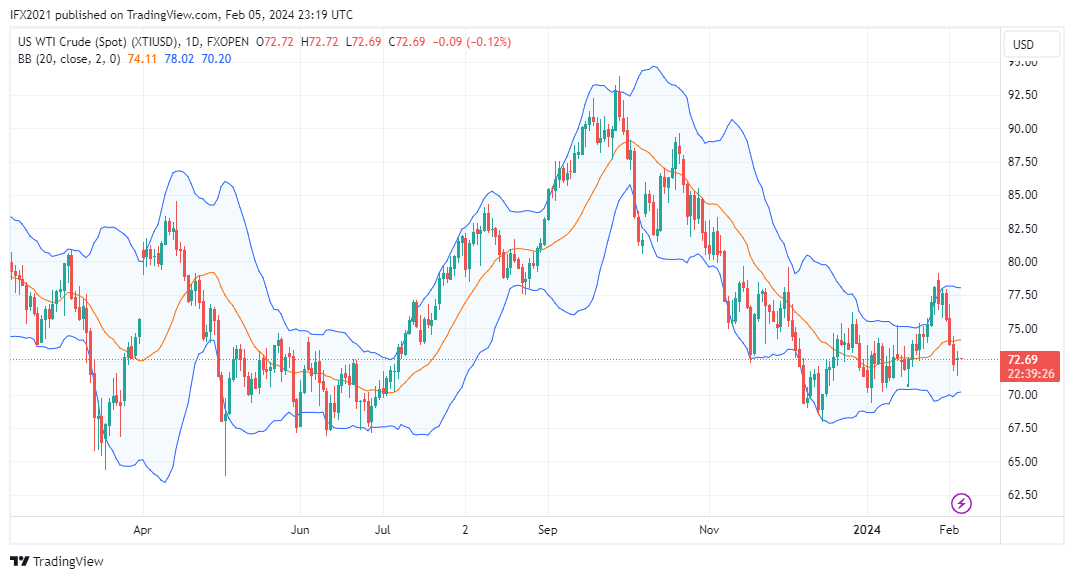
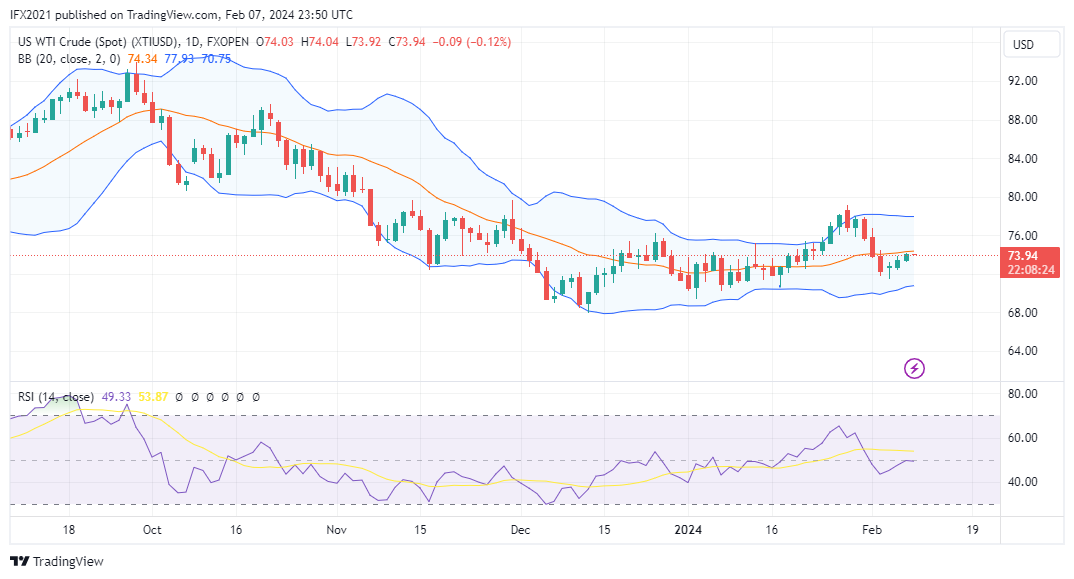
The current oil price on the daily timeframe shows the price moving between the upper band and middle band line. This means that the price is starting to try to rise above the middle band povit zone, the implication being that there is an increasing trend. However, here the 50 MA forms a flat channel near the price indicating a sideways market. Price is still moving at resistance level 75 and support 69. On the other hand, RSI shows level 52, meaning price is moving above the uptrend level.

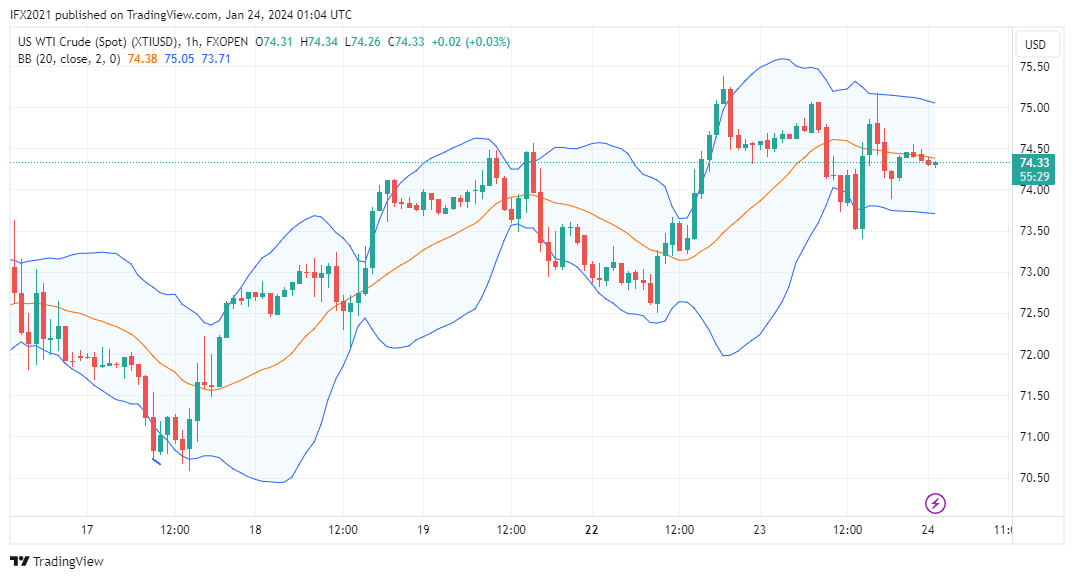
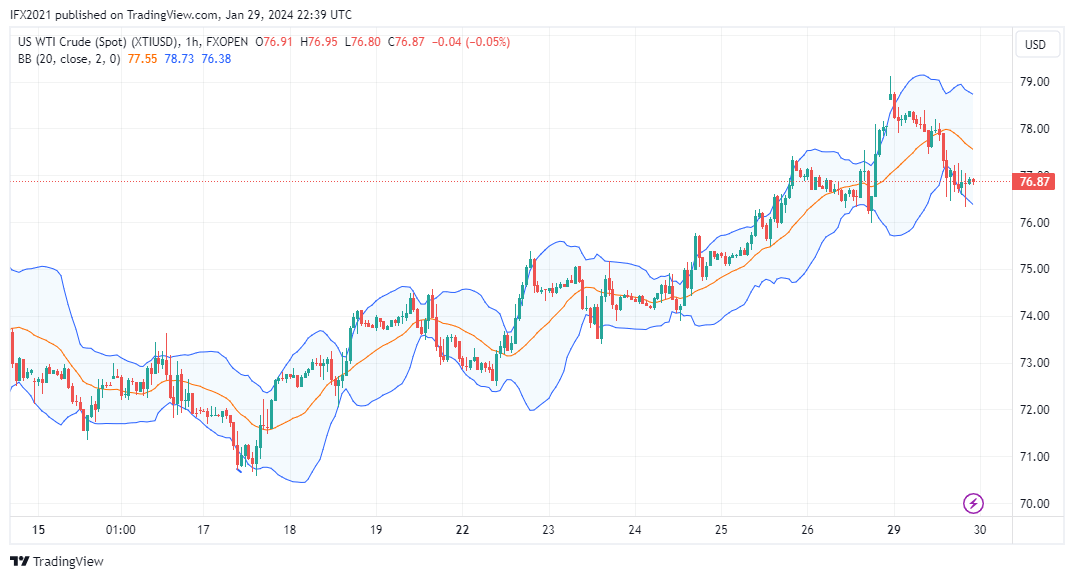
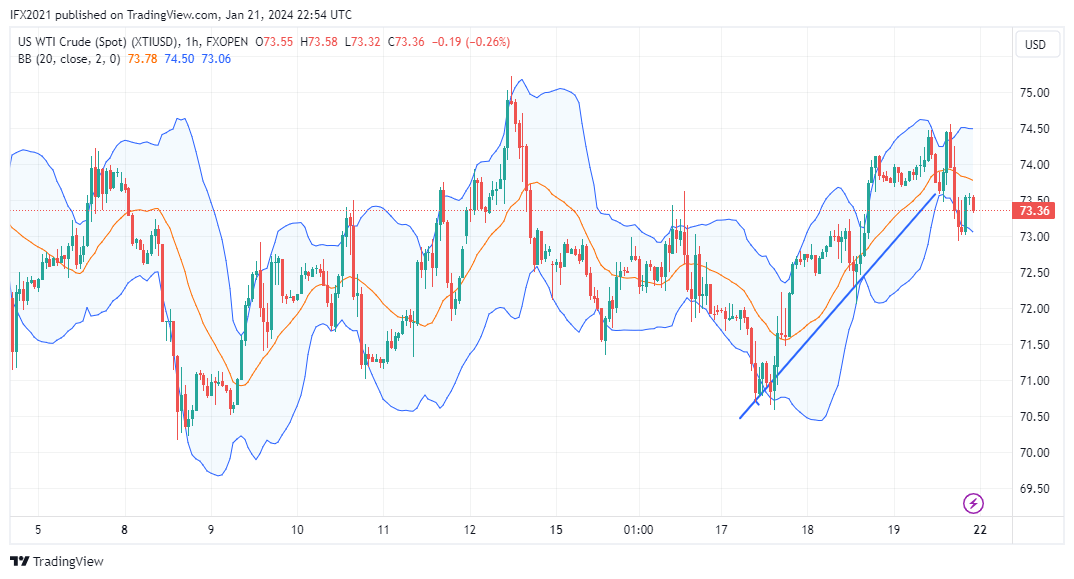
In the H1 timeframe, oil prices move near the lower band, here the price falls from the upper band to the lower band line. Meanwhile, the MA 50 is currently forming an upward channel above the price, meaning that the price has crossed the dynamic support of the MA 50, which makes it possible to look for next support. Bollinger bands appear to be expanding, implying an increase in market volatility. And the RSI shows level 42, meaning the price is below the downtrend level.

zmmW6MZy.png


Disclaimer: CFDs are complex instruments and come with a high risk of losing your money.
 
Hello everyone, have a nice day, there is still a lot of hope ahead, don't give up.

Monitor today's oil market changes. Oil price is now at 74.53 and forming a bullish candle indicating rising prices.

According to analysts from Oilprice, oil prices soared because geopolitical risks took over fundamentals.

Analysts say weak demand and slowing economic growth have prevented oil prices from soaring due to geopolitical developments. Wednesday's rise reflected the intensification of Israel's war on Gaza, rising tensions in the Middle East, new developments on the Russia-Ukraine battlefield, and continued attacks on shipping. in the Red Sea.

XTIUSD Technical analysis

Oil prices have formed a bullish candle yesterday. Prices seem to be starting to stretch and reach a high of 75.36 from a low of 72.50.

On the daily timeframe, we see that the price is now near the upper band line which is the resistance zone at this level. If there is an upward break above level 76, it is hoped that it will confirm the reversal pattern. Here the Bollinger bands still form a flat channel, an indication that price volatility tends to be stable. Meanwhile, the MA 50 forms a flat channel near the price indicating a sideways market. And the RSI shows level 56, which means the price is above the uptrend level.

In the H1 timeframe, the price moves near the upper band line, here a retracement pattern appears after the rally. MA 50 is near the middle band line forming an upward slope giving a weak uptrend signal. The Bollinger band itself is starting to appear expanding, an indication of high market volatility. On the other hand, the RSI shows level 59, which means the price is above the uptrend level.

J62NlUtm.png


Disclaimer: CFDs are complex instruments and come with a high risk of losing your money.
 
Hello everyone, it beautiful day, I hope all traders get an abundance of blessings today.

Monitoring the oil market again. Today US Crude oil is trading at 74.33 based on XTIUSD chart FXOpen on Tradingview. Yesterday oil prices moved within the previous range and formed a doji candle.

Analysts still link oil prices to oversupply, overshadowing the escalation of tensions in the Middle East. Oil prices continue to struggle for direction despite rising tensions in the Red Sea and Middle East region, as supplies remain insufficient.

XTIUSD Technical analysis

Oil prices are now near the upper band line on the daily timeframe. Here we see the Bollinger band line forming a flat channel indicating a sideways market. The price crossed the upper band yesterday but returned to the track.

MA 50 forms a flat channel near the middle band line indicating a flat market. Meanwhile, the RSI shows level 55 which means the price is above the uptrend level.

In the H1 timeframe, oil prices are consolidating near the middle band line after reaching the upper band line. Here the MA 50 is below the price forming a flat channel indicating a sideways market. On the other hand, the RSI shows level 50, which means the price is at a neutral level.

Ahe3EA8u.png


Disclaimer: CFDs are complex instruments and come with a high risk of losing your money.
 
Hello everyone, have a nice day, there is always a bright morning after a dark night.

Today, monitoring the oil market, it appears that oil prices are starting to rise and form a bullish candle and managed to cross the upper band line yesterday as if ending the downtrend phase.

According to the Oilprice's report, oil prices rose due to the US stock decline and increasing tensions in the Red Sea. US stock decline is triggered by freezing – when low temperatures freeze wells and other equipment,

XTIUSD technical analysis

Oil prices were observed to rise for US crude oil at 76.92 based on the XTIUSD chart FXOpen in Tradingview. Oil prices rose 0.01% today.

On the daily timeframe, we see that oil prices have crossed the upper band and ended the consolidation phase, the price has passed the resistance level of 75 and reached a high of 77.40. Here the Bollinger band starts to expand but the 50 MA near the middle band still forms a flat channel. On the other hand, the RSI indicator is at level 58, which means the price is above the uptrend level.

In the H1 timeframe, oil prices tend to rise, here the Bollinger band expands and forms an upward channel indicating an uptrend with high volatility. The MA 50 near the lower band forms an ascending channel in this time frame, and the RSI shows level 64 which means the price is above the uptrend level.

JJ909Kin.png


Disclaimer: CFDs are complex instruments and come with a high risk of losing your money.
 
Hello everyone, have a nice day, welcome today, hope everyone is healthy and always happy

It is clear that today there is a gap in oil prices, the open price is much higher than the close last Friday. The price of US crude oil or XTIUSD is up high at 78.71 at the time of writing.

Tensions in Red Sea seem to be starting to have an impact on oil prices recently. Other fundamental news: US sanctions on Russia caused it to stop 10 million barrels of Russian crude oil for weeks. The 10 million barrels of oil were carried by 14 tankers, came from the Sokol type from Sakhalin-1 and remained unsold due to Western sanctions and were stranded in South Korea

XTIUSD Technical analysis

US Crude oil prices began to form a bullish pattern after crossing the upper band line near the 75 price level. This may end the long-term decline that has been going on since September 2023.

On the daily timeframe, the price is outside the upper band, giving an indication that a strong price rally has occurred. This morning the gap was also visible on the daily timeframe where the open price of 78.63 was far above the close price of 78.01.

Meanwhile, the Bollinger band expands, indicating increasing market volatility. However, the MA 50 is near the middle band, still forming a flat channel, an indication of a sideways market. RSI shows level 68 which means the price is above the uptrend level.

In the H1 timeframe, the gap is very clear, the price even jumped above the upper band line. Here the Bollinger band expands, indicating increasing market volatility. The MA 50 below the price forms an upward channel, while the RSI shows level 72 which means the price has entered the overbought zone, which is a self-warning of possible rejection.

In conclusion, bullish sentiment currently dominates, but the possibility of rejection may be due to the RSI entering the overbought zone.

XGvslJOR.png


Disclaimer: CFDs are complex instruments and come with a high risk of losing your money.
 
US crude oil dropped back to the low after Monday there was a gap at the high of 79.12. Now oil forms a bearish candle with a long body above the middle band line.

The conflict in the Red Sea is getting hotter, where the Houthis and the US are attacking each other in those waters. Despite this, Saudi Aramco emphasized the manageable risks to its tankers when navigating the Red Sea despite the conflict. On the other hand, the Houthi group explicitly allows Chinese and Russian ships to pass safely, reflecting geopolitical alignment.

XTIUSD technical analysis

Analyzing the price of US Crude oil through XTUUSD chart FXOpen in Tradingview, even though it had risen to a high of 79.12, the price of oil was again under pressure and returned to 76.67. This may just be a profit-taking action on oil speculation.

D1 timeframe

Oil prices move below the upper band line forming a bearish candle. On Monday there was a wide gap but the price closed the gap again and formed a low of 76.33. Here the Bollinger band expands, indicating increasing market volatility. Meanwhile, the MA 50 is near the middle band forming a flat channel which allows indications of a sideways market. On the other hand, the RSI shows level 59 away from the overbought zone.

H1 timeframe

In this time frame, the price is consolidating near the lower band which is possible as a support zone in this area. Here the Bollinger band expands, indicating increasing market volatility. The 50 MA above the price forms a flat channel indicating a sideways market. And RSI shows level 39 which means the price is below the downtrend level.

p8XUIkiG.png


Disclaimer: CFDs are complex instruments and come with a high risk of losing your money.
 
Hello everyone, have a nice day, I hope all FPA members are always healthy and happy as always

Today's oil price was observed to decline at level 71.96 based on the XTIUSD chart FXOpen in Tradingview. Oil prices failed to climb higher after being stuck at level 79.12.

The latest news regarding oil citing to Oilprice, the Joint Ministerial Monitoring Committee (JMMC) Meeting of the OPEC+ group held a meeting via video conference on Thursday and did not recommend the entire OPEC+ group to take any action regarding crude oil production levels.

The JMMC, which monitors oil market developments and recommends action at ministerial meetings, on Thursday reviewed crude oil production data for November and December 2023 and noted high compliance with the cuts, OPEC said in a statement afterward. meeting.

OPEC+ members have collectively decided to voluntarily cut 2.2 million barrels per day from the group's output this quarter, although most of the cuts are already in effect, including a voluntary cut of 1 million barrels per day (bpd) in Saudi Arabia.

XTIUSD technical analysis

Oil prices appear to have formed a downtrend pattern since January 29. There are three bearish candles and one bullish candle with a tendency for prices to form lower lows.

In the daily timeframe, the price of US crude oil managed to cross the middle band line which became the first dynamic support. Price is now trying to reach the MA 50 which forms a flat channel in this area which may become the next dynamic support. Bollinger bands appear to be starting to form a flat channel, an indication of decreasing volatility. On the other hand, the RSI indicator shows level 49, which means the price is below the downtrend level.

In the H1 timeframe, oil prices moved near the lower band line, here the decline was corrected slightly upwards. The Bollinger band indicator still appears to be expanding, indicating increasing market volatility. MA 50 below the upper band line forms a downward channel, while RSI shows level 32 which means the price is below the downtrend level near the oversold zone level.

Xc1oSmPk.png


Final thought

Oil prices may remain under bearish pressure despite flare-ups in the Red Sea due to falling demand, despite OPEC's efforts to cut production to try to balance the market. The recent high volatility in oil prices has also allowed oil speculators to bet on oil.

Disclaimer: CFDs are complex instruments and come with a high risk of losing your money.
 
Hello everyone, back to the market today, hope all members in the FPA community are full of health and prosperity in their lives.

Oil prices fell to the price range of 72.69 after rising to a high of 79.12 for US Crude oil.

Reporting from Oilprice, Occidental CEO Vicki Hollub predicts an oil supply shortage in 2025 due to the global failure to replace crude oil reserves. Occidental Petroleum is backed by Warren Buffett. “We're in a situation now where in a few years we're going to be short of supply,” Occidental CEO Vicki Hollub told CNBC

XTIUSD technical analysis

After consecutive declines since January 29, gold prices are now facing resistance near the lower band line.

Price appears to form a Doji candle with a long wick at the bottom of the candle and a long wick at the top of the candle. Doji candle indicates market indecision while moving.

Here the MA 50 forms a flat channel below the price above the price indicating a sideways market. MA 50 measures the moving average of the past 50 days.

The Bollinger band indicator appears to form a flat channel with a fairly wide band, an indication of medium market volatility.

Meanwhile, the RSI, which is an oscillator indicator, shows level 44, which means the price is now below the downtrend level.

In the H1 timeframe, oil prices are moving near the middle band line which may be the current dynamic resistance. Prices are also below the 50 MA which forms a downward channel indicating a market downtrend. An upside breakout allows the price to rise towards 73. However, a downside breakout may allow the price to head towards the middle band line near 72.30.

Here the Bollinger bands form a flat channel with expanding bands indicating increasing market volatility. On the other hand, the RSI indicator shows level 51, which means the price is slightly above the uptrend level.

zWRq7QVF.png


Disclaimer: CFDs are complex instruments and come with a high risk of losing your money.

#oilprices #uscrudeoil #ticktrader #fxopenuk
 
Hello everyone, have a nice day, hope all traders in FPA community doing well today

Today's oil price for US Crude oil is at 73.38, the price rose from a low of 72.40 and formed a bull candle.

Reporting from Oilprice, OPEC General Haitham al-Ghais said the global oil market will require an investment of $14 trillion over the next 20 years if oil-producing countries hope to meet global energy demand by 2045. According to him, global energy demand will increase between now this and in 2045 it will be 23 percent

XTIUSD technical analysis

M2kHWfv5.png


The price of US crude oil is now moving between the middle and lower band lines near the MA 50. Here the MA 50 which measures the moving average for the past 50 days forms a flat channel indicating a sideways market.

Bollinger bands, which measure volatility, show that the indicator forms a flat channel with a wide band distance, indicating a sideways market with quite high market volatility.

On the other hand, the RSI shows level 46, which means the price is below the downtrend level.

In the H1 timeframe, the price of US crude oil moves near the upper band line. Here a Bollinger band squeeze appears with a bullish tendency in low volatility.

The 50 MA below the price forms a flat channel, an indication of a sideways market or perhaps a trend transition. Meanwhile, the RSI indicator shows level 55, which means the price is above the uptrend level.

Disclaimer: CFDs are complex instruments and come with a high risk of losing your money.

#oilprices #uscrudeoil #ticktrader #fxopenuk
 
Hello everyone, have a nice day, hope all traders doing well and full of happiness today

Still highlighting today's oil prices, it can be seen that the price for US Crude Oil is at 73.94 based on the XTIUSD chart FXOpen on Tradingview. Prices began to show signs of rising since February 5 by forming a reversal pattern with higher highs and lower highs.

Tensions in the Red Sea and Suez Canal still pose a serious threat to the West linked to Israel. Reporting from Oilprice Western Ships Linked to Israel Pay 50% Extra Insurance Premium for the Red Sea. Marcus Baker, Marsh's global head of marine and cargo, said "The ships that have so far experienced problems, almost all have some element of Israeli or US or British ownership."

On the other hand, Saudi Arabia has signaled a change in strategy towards oil. Saudi Ministry of Energy orders Aramco to maintain oil production at 12 million barrels per day, halting any expansion plans for domestic needs.

XTIUSD Technical analysis

tf6vGnjK.png


Oil prices appear to be starting to move up after reaching a low of 71.42 on February 5. Gradually the back price increased and has now reached a high of 74.19 at the time of writing for US Crude Oil.

On the daily timeframe, oil prices move across the MA 50 from the lower side, indicating that the price is above the rising line. Oil's upward movement appears to be still stuck at the middle band line. If a breakout occurs at this line, oil prices may rise higher.

Here the Bollinger band shows a flat band with a fairly wide band distance, an indication of high market volatility.

On the other hand, the RSI indicator, which is often used to measure oversold and overbought, shows level 48, which means the price is below the downtrend level.

In the H1 timeframe, it appears that oil price movements tend to be sideways with a weak bullish sentiment pattern.

Here a Bollinger band squeeze appears which indicates the market is moving in a narrow range waiting for a breakout, with a price range of 73.18 and 74.16.

The 50 MA near the lower band here forms an upward channel indicating a weak market uptrend. Meanwhile, the RSI indicator, which is a leading indicator, shows level 59, which means the price is above the uptrend level.

Conclusion

Oil prices may still be waiting for a breakout, prices are still moving in a narrow trading range within the Bollinger bands. This may be due to small volumes in the oil market. However, in the short term in the H1 timeframe, oil prices tend to have weak bullish sentiment.

Disclaimer: CFDs are complex instruments and come with a high risk of losing your money.

#oilprices #uscrudeoil #ticktrader #fxopenuk
 
Back
Top