fxoday
Recruit
- Messages
- 885
Hello everyone, have a nice day, hope today all FPA members community in full happiness as always.
XTIUSD climbed high at 76.43, a continuation of the previous bullish trend.
The Houthi threat in the Red Sea is still a concern for cargo ships, especially those linked to Israel. Recently chief executive A.P. Moller-Maersk Vincent Clerc told Bloomberg TV “We have not seen the threat level reach its peak, quite the opposite,”
It is estimated that security threats in the Red Sea will continue to increase for up to a year by several shipping giants.
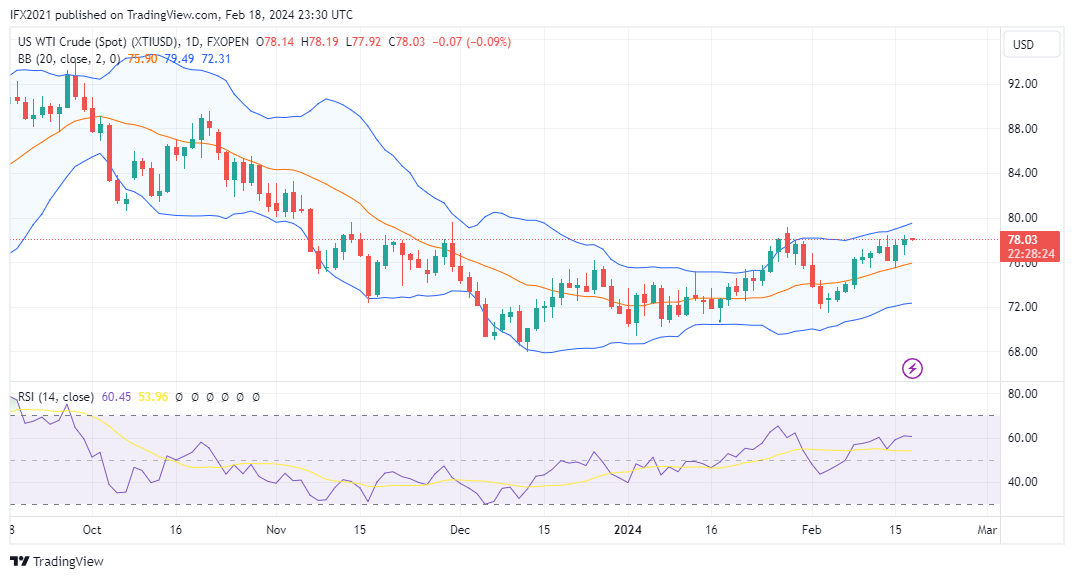
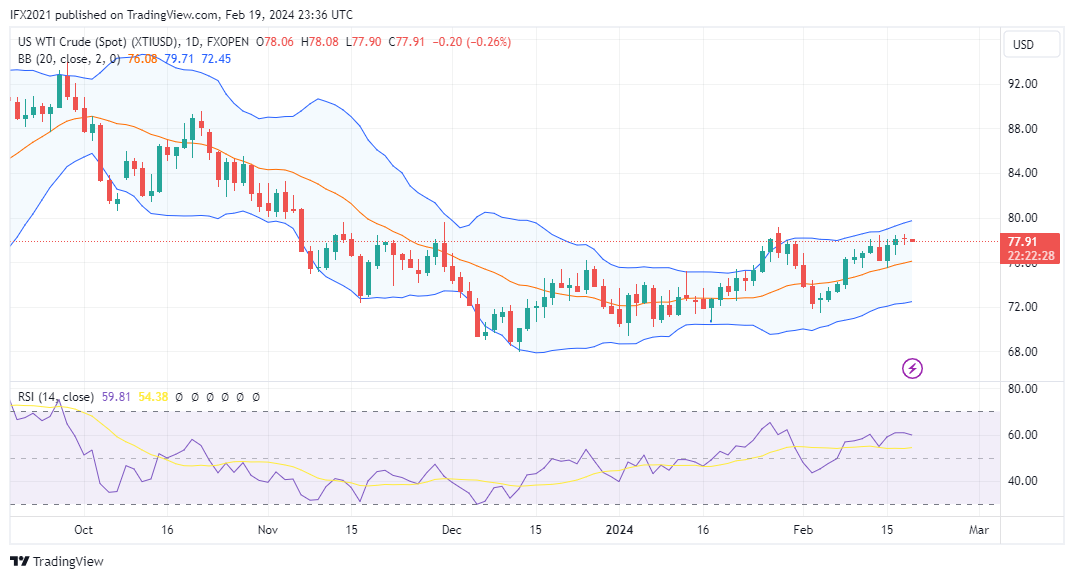
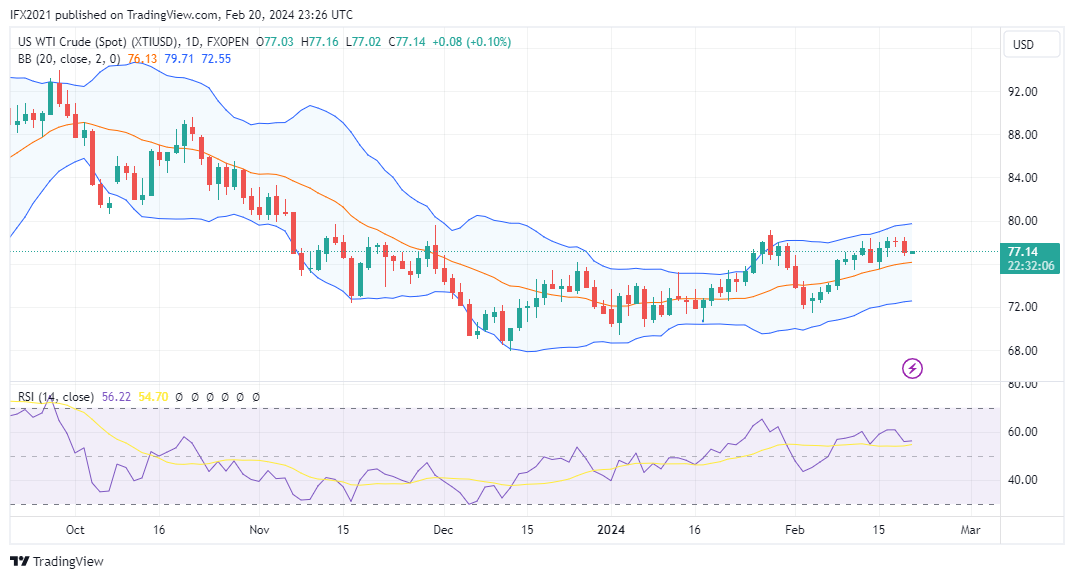
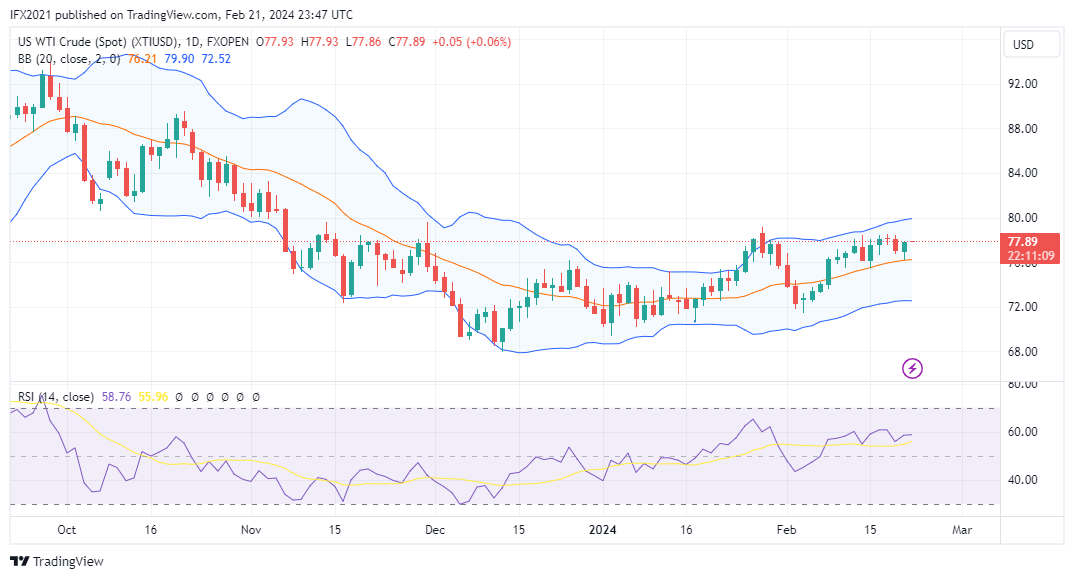
XTIUSD Technical analysis
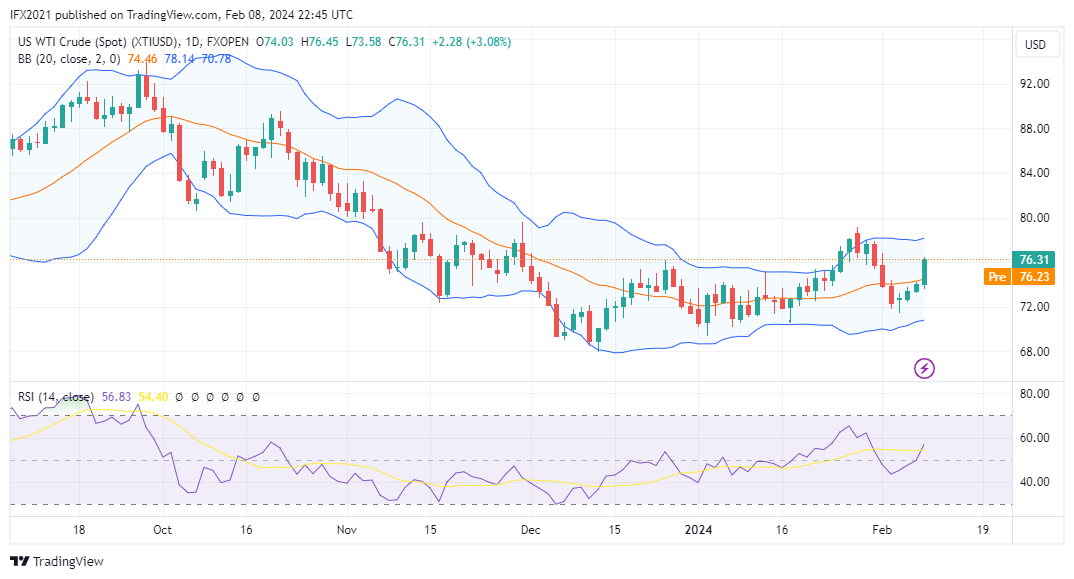
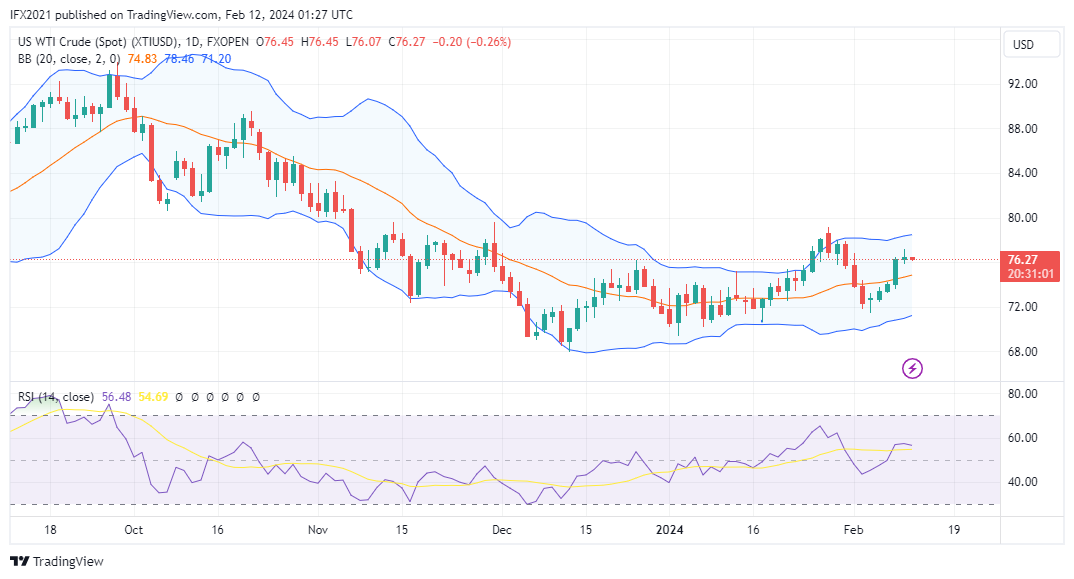
Oil prices appear to have formed a bull candle with a long body and managed to cross the middle band line from the downside.
In the D1 timeframe, we see that there is strong buyer pressure and it brings oil prices soaring from a low of 73.58 to a high of 76.45.
The next resistance target may be near the upper band line at the price range 78.54. If this important zone is broken, perhaps oil prices can continue to rise looking for new resistance.
Bollinger bands still form a wide band distance, an indication of high market volatility even though the MA 50 which measures the moving average for the past 50 days forms a flat channel below the price.
On the other hand, the RSI indicator used to measure the overbought and oversold zone shows level 57. If the RSI shows level 70, it means the price has entered the overbought zone.
In the H1 timeframe, oil prices experienced a strong rally after breaking the upper band line at 74.36, then the price climbed sharply in one day.
The expanding Bollinger band indicates increasing market volatility, while the MA 50 forms an upward channel below the middle band giving a bullish signal in this time frame. On the other hand, the RSI indicator shows level 76, which means the price is in the overbought zone. This gives an early warning of a possible reversal or retracement.
Disclaimer: CFDs are complex instruments and come with a high risk of losing your money.
#uscrudeoil #oilprice #redsea #ticktrader #fxopenuk
XTIUSD climbed high at 76.43, a continuation of the previous bullish trend.
The Houthi threat in the Red Sea is still a concern for cargo ships, especially those linked to Israel. Recently chief executive A.P. Moller-Maersk Vincent Clerc told Bloomberg TV “We have not seen the threat level reach its peak, quite the opposite,”
It is estimated that security threats in the Red Sea will continue to increase for up to a year by several shipping giants.
XTIUSD Technical analysis
Oil prices appear to have formed a bull candle with a long body and managed to cross the middle band line from the downside.
In the D1 timeframe, we see that there is strong buyer pressure and it brings oil prices soaring from a low of 73.58 to a high of 76.45.
The next resistance target may be near the upper band line at the price range 78.54. If this important zone is broken, perhaps oil prices can continue to rise looking for new resistance.
Bollinger bands still form a wide band distance, an indication of high market volatility even though the MA 50 which measures the moving average for the past 50 days forms a flat channel below the price.
On the other hand, the RSI indicator used to measure the overbought and oversold zone shows level 57. If the RSI shows level 70, it means the price has entered the overbought zone.
In the H1 timeframe, oil prices experienced a strong rally after breaking the upper band line at 74.36, then the price climbed sharply in one day.
The expanding Bollinger band indicates increasing market volatility, while the MA 50 forms an upward channel below the middle band giving a bullish signal in this time frame. On the other hand, the RSI indicator shows level 76, which means the price is in the overbought zone. This gives an early warning of a possible reversal or retracement.
Disclaimer: CFDs are complex instruments and come with a high risk of losing your money.
#uscrudeoil #oilprice #redsea #ticktrader #fxopenuk