AceTraderFx Jul 22: Weekly / Daily Technical Outlook & Trading Ideals on EUR/USD

AceTraderFx Dec 23: Daily Technical Outlook & Trading Ideals on EUR/USD

DAILY EUR/USD TECHNICAL OUTLOOK
Last Update At 22 Dec 2014 23:49GMT

Trend Daily Chart
Sideways

Daily Indicators
Bullish convergences

21 HR EMA
1.2242

55 HR EMA
1.2286

Trend Hourly Chart
Down

Hourly Indicators
Bullish convergences

13 HR RSI
45

14 HR DMI
-ve

Daily Analysis
Consolidation b4 MT decline resumes

Resistance
1.2347 - 50% r of 1.2474-1.2220
1.2302 - Last Fri's high
1.2272 - Y'day's high

Support
1.2216 - 61.8% proj. of 1.2474-1.2277 fm 1.2358
1.2174 - 61.8% proj. of 1.2888-1.2247 fm 1.2570
1.2146 - 61.8% proj. of 1.3700-1.2500 fm 1.2888

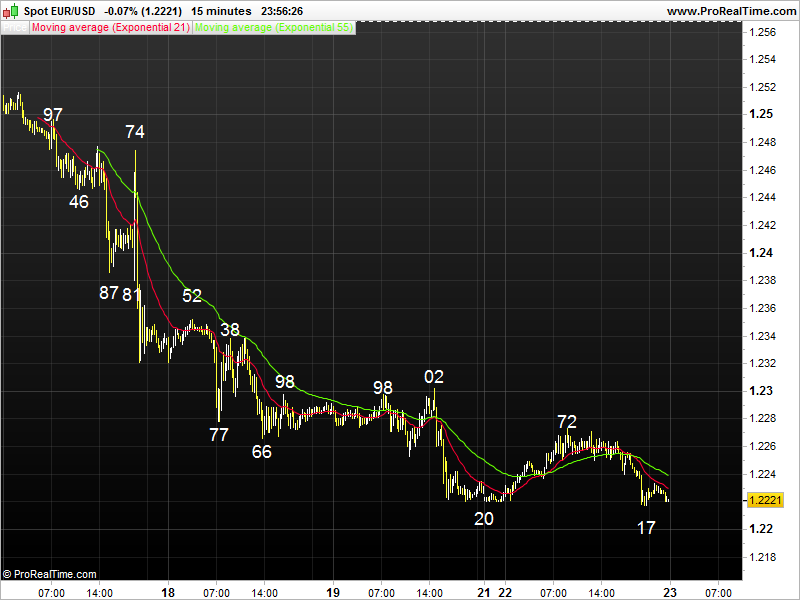
. EUR/USD - 1.2223... Euro gained a respite on Mon after failure to breach last Fri's fresh 27-mth trough at 1.2220. Price ratcheted higher fm NZ's low at 1.2220 in Asia n then climbed to 1.2272 in European morning. Later, euro briefly fell to 1.2250 in NY morning n fell to a session low at 1.2217 near NY close.

. Looking at the daily chart, as previously mentioned, euro's resumption of MT downtrend fm 2014 high at 1.3995 (May) to 1.2220 last Fri suggests initial downside bias remains for further weakness to 1.2146, this is 61.8% proj. of intermediate downtrend fm 1.3700 to 1.2500 measured fm 1.2888. Having said that, as daily technical indicators' readings wud display prominent bullish convergences on such a move, reckon 'psychological' sup at 1.2000 wud remain intact this month n early Jan 2015 n risk has increased for a much-needed correction to take place later. On the upside, only a daily close abv 1.2386 (prev. hourly sup, now res) wud signal a low is in place, then risk a correction twd 1.2570.

. Today, as long as 1.2272 res holds, downside bias remains for MT down-trend to extend to 1.2200 n 1.2174 (61.8% proj. of 1.2888-1.2247 fm 1.2570) but loss of momentum wud limit fall to 1.2146.
eur%28252%29.png
 
Last edited by a moderator:
AceTraderFx Jan 16: Daily Technical Outlook & Trading Ideals on EUR/USD

DAILY EUR/USD TECHNICAL OUTLOOK
Last Update At 16 Jan 2015 00:03GMT

Trend Daily Chart
Down

Daily Indicators
Falling

21 HR EMA
1.1667

55 HR EMA
1.1724

Trend Hourly Chart
Down

Hourly Indicators
Rising fm o/s

13 HR RSI
39

14 HR DMI
-ve

Daily Analysis
Consolidation b4 one more fall

Resistance
1.1846 - Wed's high
1.1774 - Hourly chart
1.1667 - Prev. hourly chart sup, now res

Support
1.1569 - Y'day's fresh 11-year low
1.1534 - 1.618 times extn of 1.2887-1.2247 fm 1.2570
1.1500 - Psychological sup

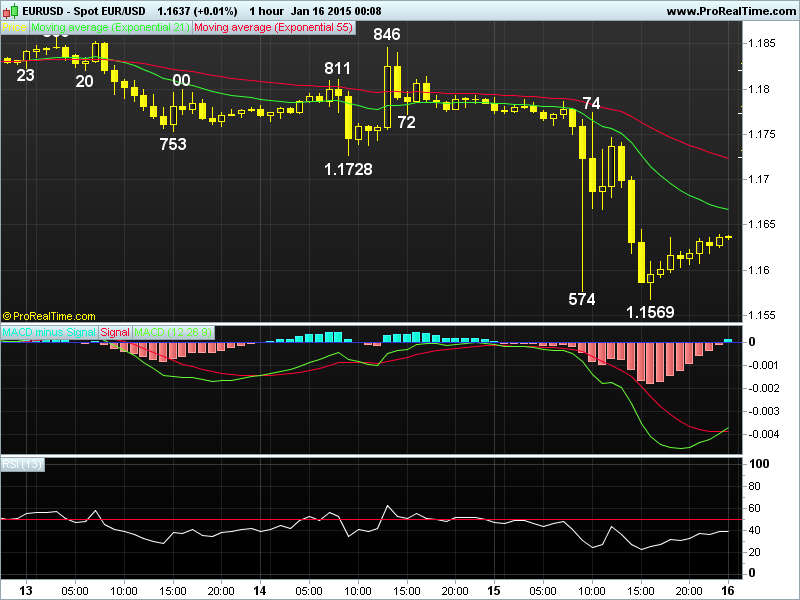
. EUR/USD - 1.1636... Despite euro's brief bounce to 1.1786 in Asia after intra-day retreat fm 1.1793 (AUS) to 1.1760, price nose-dived to a fresh 11-year low at 1.1574 in Europe due to free fall in eur/chf after SNB abandoned franc peg. Later, euro rebounded to 1.1774 but only to fall to 1.1569 in NY.

. Looking at the hourly n daily charts, y'day's firm breach n close below Wed's low at 1.1728 (now res) signals LT downtrend fm 1.6040 (2008 record high) to retrace the entire uptrend fm 0.8228 record low made in 2000 has once again resumed n downside bias remains for further weakness to 1.1534 n then 1.1500, being 1.618 times extension of intermediate fall of 1.2887-1.2247 measured fm 1.2570 n psychological lvl respectively, after consolidation. Looking ahead, price is en route twd 1.1212 in Q1, being the 'dynamic' 61.8% r of this move.

. Today, as price is currently trading below both 21-hr n 55-hr emas, suggesting selling euro on recovery for one more decline is recommended, however, as 'bullish convergences' wud display on hourly oscillators on next fall, reckon 1.1500 wud hold n yield minor correction early next week. Abv 1.1774 wud be 1st signal a temporary low is in place n risks retracement twd 1.1830/40.
EUR%20jan%2017.png
 
Last edited by a moderator:
AceTraderFx Jan 22: Daily Technical Outlook & Trading Ideals EUR/USD

PHP:
DAILY EUR/USD TECHNICAL OUTLOOK
Last Update At 21 Jan 2015 23:56GMT

Trend Daily Chart
Down

Daily Indicators
Falling

21 HR EMA
1.1590

55 HR EMA
1.1588

Trend Hourly Chart
Sideways

Hourly Indicators
Rising

13 HR RSI
60

14 HR DMI
+ve

Daily Analysis
Choppy trading to continue

Resistance
1.1774 - Last Thur's European high
1.1728 - Last Wed's low
1.1680 - Y'day's high

Support
1.1540 - Tue's low
1.1489 - Minor hourly sup
1.1460 - Last Fri's 11-year low

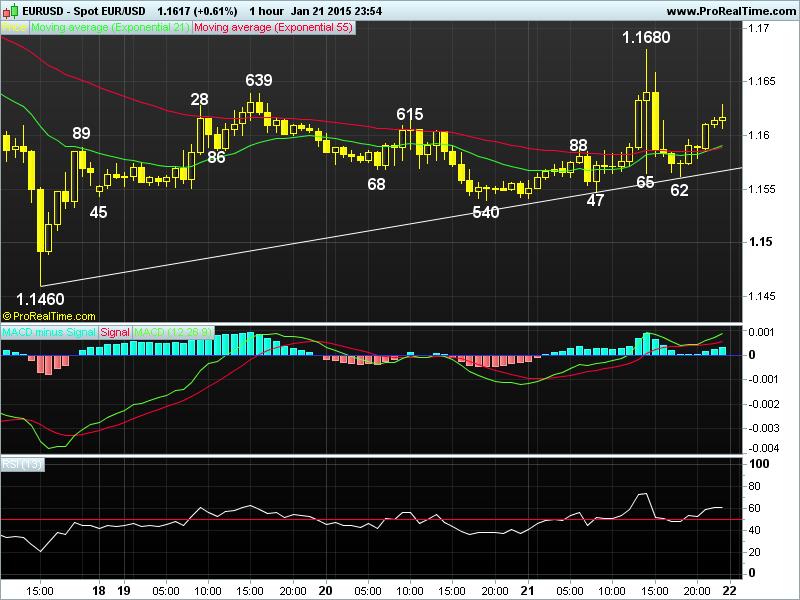
. EUR/USD - 1.1615... Euro swung wildly y'day ahead of Thur's ECB meeting. Price ratcheted higher fm 1.1542 at Asian open n climbed to 1.1641 in NY morning b4 falling briefly to 1.1565 after the news of ECB's bond purchase plan b4 rallying briefly again to 1.1680, however, renewed selling knocked price to 1.1562.

. Looking at the bigger picture, last week's breach of key sup at 1.1640 (2005 low) signals LT downtrend fm 1.6040 (2008 record high) to retrace the entire uptrend fm 0.8228 record low made in 2000 wud extend weakness twd 1.1212 in Q1, being the 'dynamic' 61.8% r of this move. On the upside, only a daily close abv 1.1728 signals temporary low is made n risks stronger retracement twd 1.1871 but price shud falter below 1.1976 (Jan 5 high) n yield another decline.

. Today, euro's retreat after y'day's brief rally to 1.1680 suggests correction fm said fresh 11-year low at 1.1640 has possibly ended there, break of 1.1540 (Tue's low) wud add credence to this view n bring re-test of this sup. Looking ahead, price is en route to 1.1403, being equality projection of 1.3995-1.2500 measured fm 1.2888 later this month. On the upside, abv 1.1680 wud risk stronger gain to 1.1728, then 1.1763 (being 38.2% r of 1.2254 to 1.1460).
EUR%20jan%2022.png
 
Last edited by a moderator:
AceTraderFx Feb 4: Daily Technical Outlook & Trading Ideals EUR/USD

DAILY EUR/USD TECHNICAL OUTLOOK
Last Update At 03 Feb 2015 23:53GMT

Trend Daily Chart
Down

Daily Indicators
Turning up

21 HR EMA
1.1422

55 HR EMA
1.1374

Trend Hourly Chart
Near term up


Hourly Indicators
Rising

13 HR RSI
70

14 HR DMI
+ve

Daily Analysis
Consolidation with upside bias

Res
1.1651 - Jan 22 high
1.1587 - 100% proj. of 1.1098-1.1423 fm 1.1262
1.1534 - Y'day's high

Support
1.1423 - Last Tue's high, now sup
1.1368 - Last Thur's high, now sup
1.1313 - Y'day's low

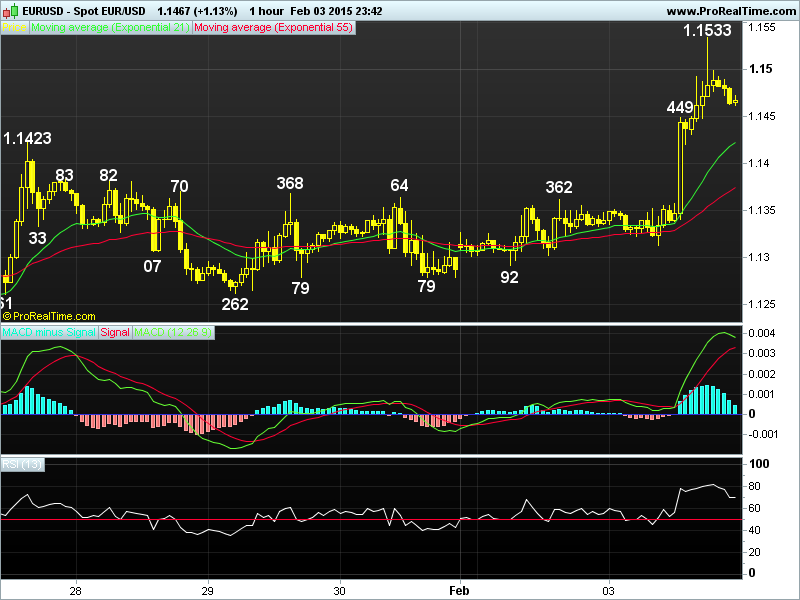
. EUR/USD - 1.1467... Despite euro's sideways trading in Tue's Asia n European morning, hope for a breakthrough on recent standoff between the new Greek anti-bailout gov't n its international creditors lifted the euro n triggered a ferocious rally to 1.1534 once previous top at 1.1423 was penetrated.

. Looking at the hourly n daily charts, euro's rally abv last week's top at 1.1423 (now sup) confirms the LT downtrend fm 1.6040 (2008 record high) has formed a temporary low at last Mon's 11-year trough at 1.1098 n correction to 1.1587 is envisaged after consolidation, this is 100% projection of 1.1098-1.1423 measured fm 1.1262, however, as hourly oscillators wud be o/bot territory on such a move, reckon price wud falter below 1.1676/1.1680, being 50% r of 1.2254-1.1098 n daily res n yield retreat later this week. On the downside, only a daily close below 1.1423 wud indicate a top is possibly made n shift risk to downside for weakness twd 1.13662/68 but sup at 1.1262 shud remain intact.

. Today, intra-day retreat suggests initial consolidation is in store, however, as present price is abv both 21-he n 55-hr emas, buying euro on dips for further marginal gain to indicated upside target is favoured.
EUR%20feb%2004.png
 
Last edited by a moderator:
AceTraderFx Aug 6: Daily Technical Outlook & Trading EUR/USD

DAILY EUR/USD TECHNICAL OUTLOOK
Last Update At 06 Aug 2015 00:36GMT

Trend Daily Chart
Sideways

Daily Indicators
Turning up

21 HR EMA
1.0895

55 HR EMA
1.0911

Trend Hourly Chart
Sideways

Hourly Indicators
Rising

13 HR RSI
61

14 HR DMI
+ve

Daily Analysis
Choppy consolidation to continue

Resistance
1.1022 - Jul 28 low
1.0988 - Tue's high
1.0938 - Y'day's high

Support
1.0848 - Y'day's low
1.0808 - Jul 20 low
1.0753 - 70.7% r of 1.0457-1.1467

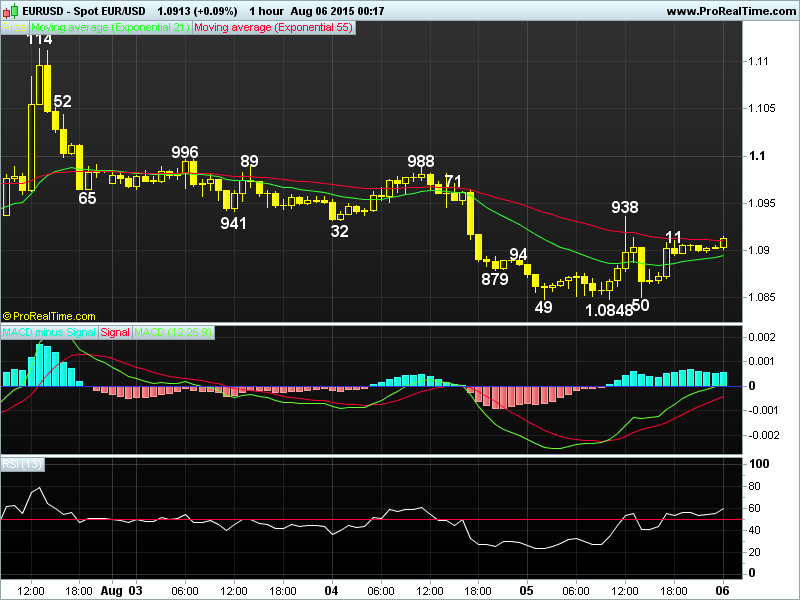
. EUR/USD - 1.0912... Euro swung wildly on Wed. Despite extending Tue's decline to 1.0848 in Asia, price staged a recovery in Europe n briefly jumped to 1.0938 on weak US ADP employment data b4 tanking to 1.0850 on upbeat serv. PMI.

. On the daily chart, despite euro's marginal break of May's 1.0819 bottom to 1.0808 in Jul, subsequent rally to 1.1129 last Mon signals the early erratic fall fm May's 3-month top at 1.1467 has ended there n current 'horizontal' movement of the 13-day & 55-day emas suggests euro may continue to swing wildly in a directionless market until Fri's key US jobs data. Having said that, this week's decline n then weakness to 1.0848 y'day strongly suggests aforesaid correction fm 1.0808 is over n a a daily close below there would suggest MT rise fm Mar's 12-year trough at 1.0457 has ended, then euro would be en route to 1.0753 (being 70.7% r of 1.0457-1.1467), then next minor daily sup at 1.0660 later this month. Only abv 1.1000 defers bearish scenario on euro n risks gain twd 1.1129.

. Today, as euro has ratcheted higher at Asian open after y'day's rebound fm 1.0850 to 1.0911 in NY session, abv 1.0938 would risk stronger retrace. to 1.0950/60 but abv res area at 1.0988-96 needed to extend to 1.1022.
EUR%20Aug%2006%281%29.png
 
Last edited by a moderator:
Back
Top