acetraderfx
AceTrader.com Representative
- Messages
- 1,109
AceTraderFx Dec 23: Daily Technical Outlook & Trading Ideals on EUR/USD
DAILY EUR/USD TECHNICAL OUTLOOK
Last Update At 22 Dec 2014 23:49GMT
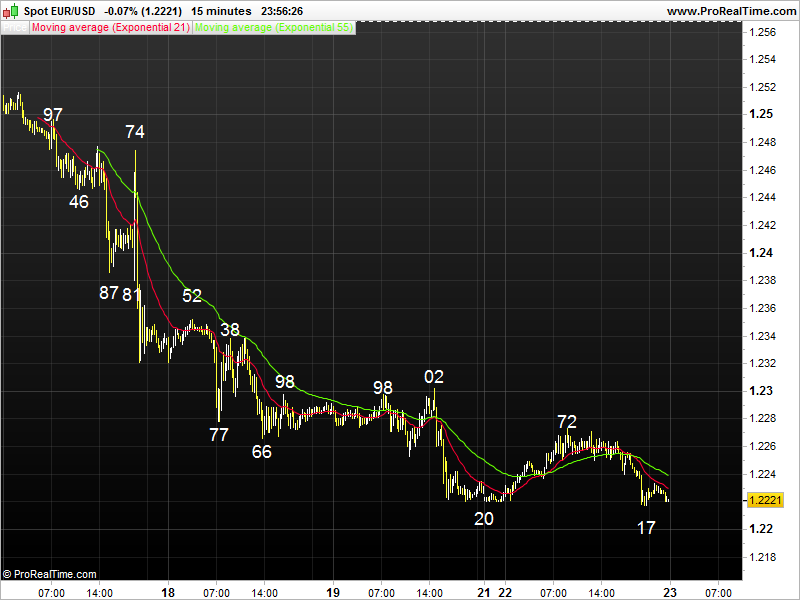
Trend Daily Chart
Sideways
Daily Indicators
Bullish convergences
21 HR EMA
1.2242
55 HR EMA
1.2286
Trend Hourly Chart
Down
Hourly Indicators
Bullish convergences
13 HR RSI
45
14 HR DMI
-ve
Daily Analysis
Consolidation b4 MT decline resumes
Resistance
1.2347 - 50% r of 1.2474-1.2220
1.2302 - Last Fri's high
1.2272 - Y'day's high
Support
1.2216 - 61.8% proj. of 1.2474-1.2277 fm 1.2358
1.2174 - 61.8% proj. of 1.2888-1.2247 fm 1.2570
1.2146 - 61.8% proj. of 1.3700-1.2500 fm 1.2888
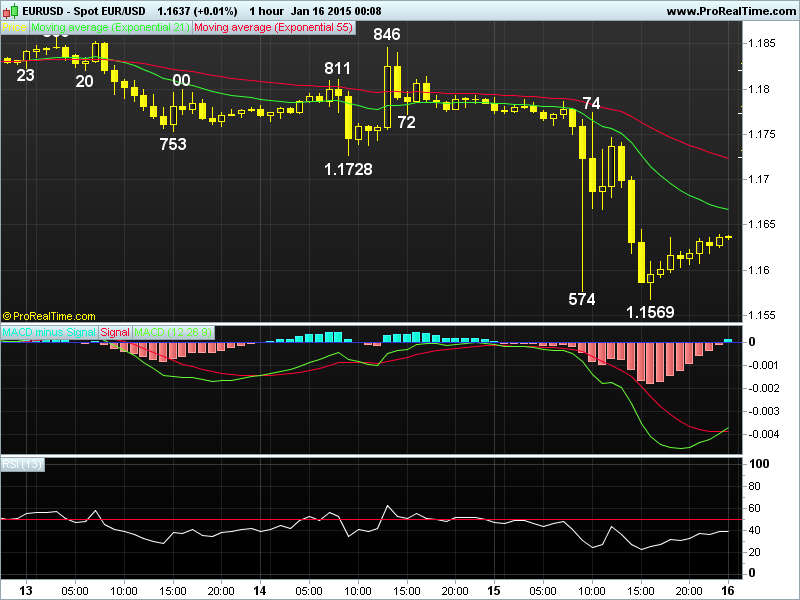
. EUR/USD - 1.2223... Euro gained a respite on Mon after failure to breach last Fri's fresh 27-mth trough at 1.2220. Price ratcheted higher fm NZ's low at 1.2220 in Asia n then climbed to 1.2272 in European morning. Later, euro briefly fell to 1.2250 in NY morning n fell to a session low at 1.2217 near NY close.
. Looking at the daily chart, as previously mentioned, euro's resumption of MT downtrend fm 2014 high at 1.3995 (May) to 1.2220 last Fri suggests initial downside bias remains for further weakness to 1.2146, this is 61.8% proj. of intermediate downtrend fm 1.3700 to 1.2500 measured fm 1.2888. Having said that, as daily technical indicators' readings wud display prominent bullish convergences on such a move, reckon 'psychological' sup at 1.2000 wud remain intact this month n early Jan 2015 n risk has increased for a much-needed correction to take place later. On the upside, only a daily close abv 1.2386 (prev. hourly sup, now res) wud signal a low is in place, then risk a correction twd 1.2570.
. Today, as long as 1.2272 res holds, downside bias remains for MT down-trend to extend to 1.2200 n 1.2174 (61.8% proj. of 1.2888-1.2247 fm 1.2570) but loss of momentum wud limit fall to 1.2146.
DAILY EUR/USD TECHNICAL OUTLOOK
Last Update At 22 Dec 2014 23:49GMT
Trend Daily Chart
Sideways
Daily Indicators
Bullish convergences
21 HR EMA
1.2242
55 HR EMA
1.2286
Trend Hourly Chart
Down
Hourly Indicators
Bullish convergences
13 HR RSI
45
14 HR DMI
-ve
Daily Analysis
Consolidation b4 MT decline resumes
Resistance
1.2347 - 50% r of 1.2474-1.2220
1.2302 - Last Fri's high
1.2272 - Y'day's high
Support
1.2216 - 61.8% proj. of 1.2474-1.2277 fm 1.2358
1.2174 - 61.8% proj. of 1.2888-1.2247 fm 1.2570
1.2146 - 61.8% proj. of 1.3700-1.2500 fm 1.2888
. EUR/USD - 1.2223... Euro gained a respite on Mon after failure to breach last Fri's fresh 27-mth trough at 1.2220. Price ratcheted higher fm NZ's low at 1.2220 in Asia n then climbed to 1.2272 in European morning. Later, euro briefly fell to 1.2250 in NY morning n fell to a session low at 1.2217 near NY close.
. Looking at the daily chart, as previously mentioned, euro's resumption of MT downtrend fm 2014 high at 1.3995 (May) to 1.2220 last Fri suggests initial downside bias remains for further weakness to 1.2146, this is 61.8% proj. of intermediate downtrend fm 1.3700 to 1.2500 measured fm 1.2888. Having said that, as daily technical indicators' readings wud display prominent bullish convergences on such a move, reckon 'psychological' sup at 1.2000 wud remain intact this month n early Jan 2015 n risk has increased for a much-needed correction to take place later. On the upside, only a daily close abv 1.2386 (prev. hourly sup, now res) wud signal a low is in place, then risk a correction twd 1.2570.
. Today, as long as 1.2272 res holds, downside bias remains for MT down-trend to extend to 1.2200 n 1.2174 (61.8% proj. of 1.2888-1.2247 fm 1.2570) but loss of momentum wud limit fall to 1.2146.
Last edited by a moderator: