Candlesticks confusion

I personally recommend against trading the shorter time frames. Some people seem to be able to scalp well on 1 minute and 5 minute charts, but the noise in the market on the shorter time frames interferes with your ability to rely on classical technical analysis.

Now that you've done babypips, take a look at Forex Military School. Sive spends a lot of time showing how the "big fish" will snap up stops from people who follow classical analysis too closely.

Forex Military School | Complete Forex Education by a Pro Banker - Forex Peace Army Forum

I agree, I have no idea how anyone trades off 5 minute charts, really, and chart under the 1hr time frame seems pretty haphazard to me.
 
I was in your shoes not too long ago. Here are my best answers for both parts of your post:

The first, the forex market moves on the tick chart. Candlesticks show the open, high, low, close of the ticks in a set timeframe. You probably know that, but what means is that everything that happens on the Daily or even Monthly timeframe is a reflection of data in the Minute 1 timeframe and tick chart. This effects you as a trader in a few ways. Every reversal or continuation starts on the lowest time frame. A daily setup will begin on the minute 1/tick charts. Don't forget that, but don't trust it. Remember that a very high percentage of breakouts are false, so if you are trading on the m15 chart, you could potentially be faked out and stopped out 4 times in a single hour! Also remember that forex is a market of psychology, so the behavior of a currency will change based on time frame because the psychology of the trades in that timeframe is different than another. Also because lower time frame trades by their very nature mature and change faster, you may find yourself trading on emotion very quickly, which will almost always lead to loss. Personally, I plan my trades on the daily timeframe, plan entries on the H4, and make the actual entries on the minute 30 or H1. If you do ultimately decide that scalping is for you (i personally cant trade that way) then just be realistic. You wont make 100pips on 999/1000 m15 trades. 10pips is far more realistic.

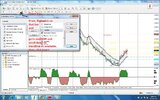
As for your platform question, I posted a screenshot of where the trendline button should be, and where to go if its not. click where you want it to start, then drag it to where you want it to end. you can also double click the line to access some control points. you can access trendline properties by rightclicking on the trendline, or rightclicking anywhere on the chart and going to objects list.
 

Attachments

  • thereitis.jpg
    thereitis.jpg
    355.1 KB · Views: 12
Using an single technical method without confirmation is risky. Read Sive's Forex Military School. You'll see that he recommends combining candlesticks with other methods to improve your odds.
 
Using an single technical method without confirmation is risky. Read Sive's Forex Military School. You'll see that he recommends combining candlesticks with other methods to improve your odds.

How do you feel about trading candlesticks / price action with just support and resistance? I don't feel this is any 'riskier' than any other method, as risk depends on your own risk tolerance and how much you want to risk per trade.
 
Candlestick charts are a popular tool used in technical analysis to analyze price movements in financial markets. They provide valuable information about the opening, closing, and high, and low prices of an asset within a specific time period. However, interpreting candlestick patterns can sometimes be confusing, especially for beginners. Key points to help clarify some common candlestick concepts:

Candlestick Components
Bullish and Bearish Candles
Candlestick Patterns
Timeframes
Support and Resistance
Confirmation with Other Indicators.
 
To become more comfortable with candlestick charting, consider practicing with a demo account or backtesting historical data. This can help you develop a better understanding of how candlesticks behave in different market conditions.
 
Back
Top