Daily Market Analysis By FXOpen

USD Strengthens Sharply after Inflation News
nL3qqMT.jpeg


Yesterday's publication of producer price indices in the US was a surprise:
→ Core PPI: actual = 0.3%, expected = 0.2%.
→ PPI: actual = 0.6%, expected = 0.3%.

Higher producer prices indicate that high inflation may remain longer than expected. And this reduces the likelihood of the Fed easing monetary policy. Markets now price the likelihood of a Fed rate cut in June at 60%, up from 74% a week earlier, according to CME's FedWatch tool.

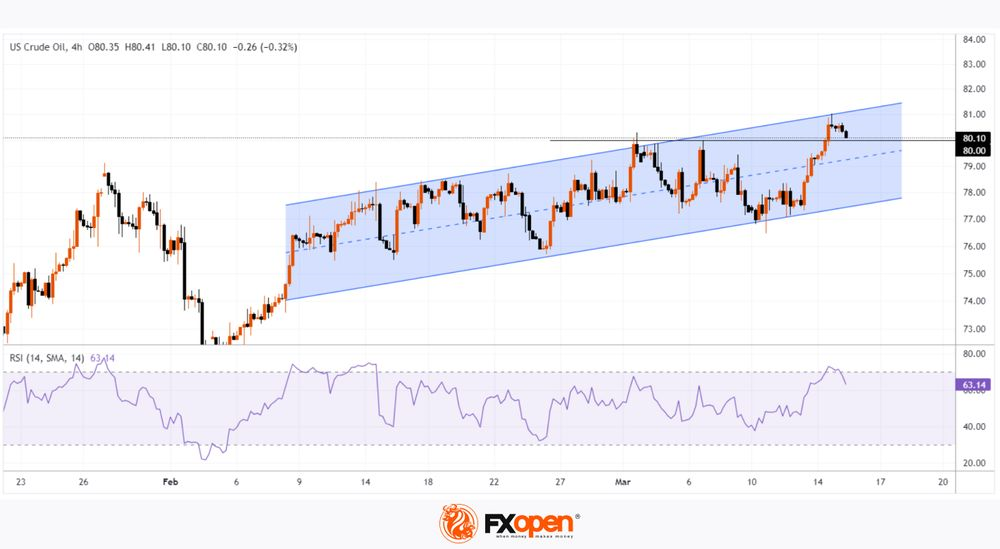
The reaction to the news was that the dollar strengthened — there was a bearish day on the stock market, and currencies paired with the USD also fell in price.

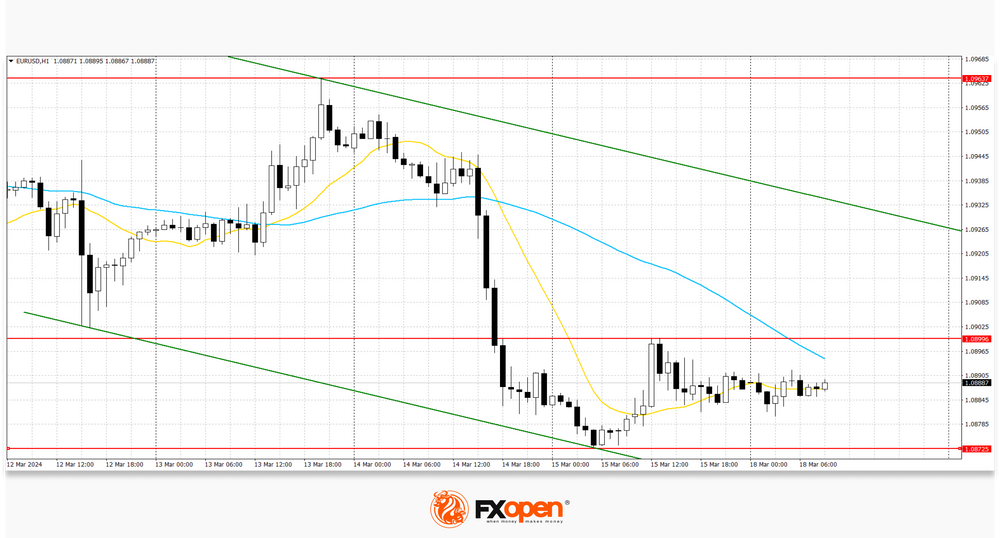
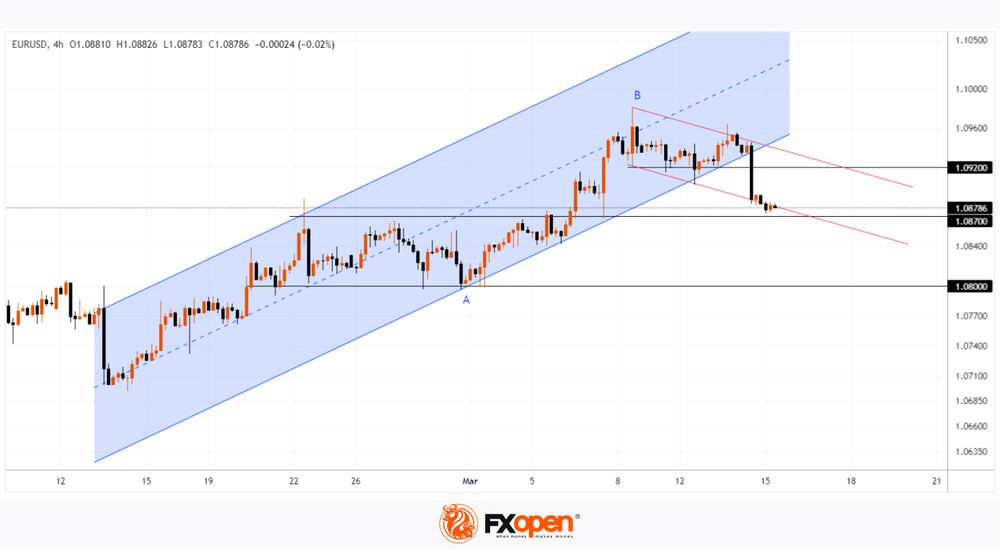
Thus, the EUR/USD price decrease yesterday was about 0.55% per day.

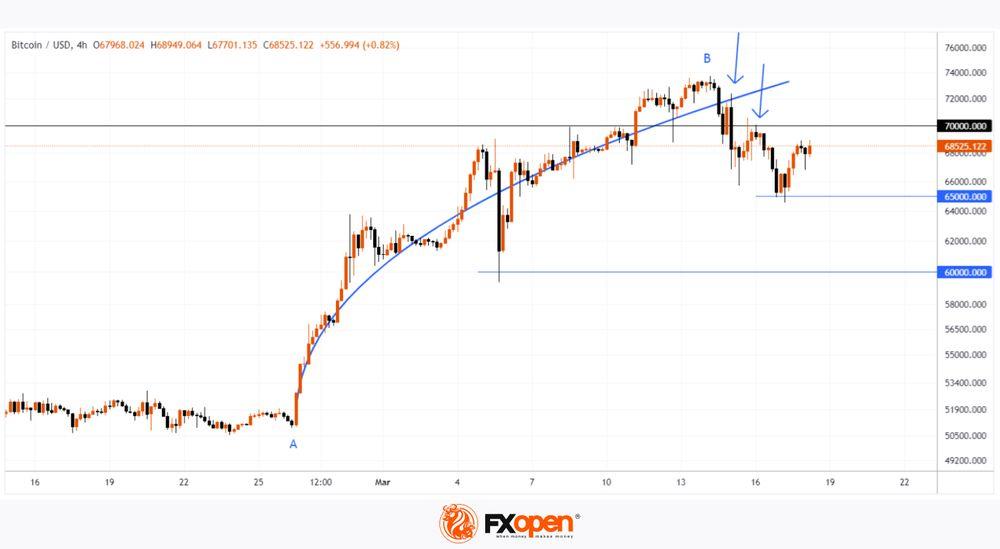
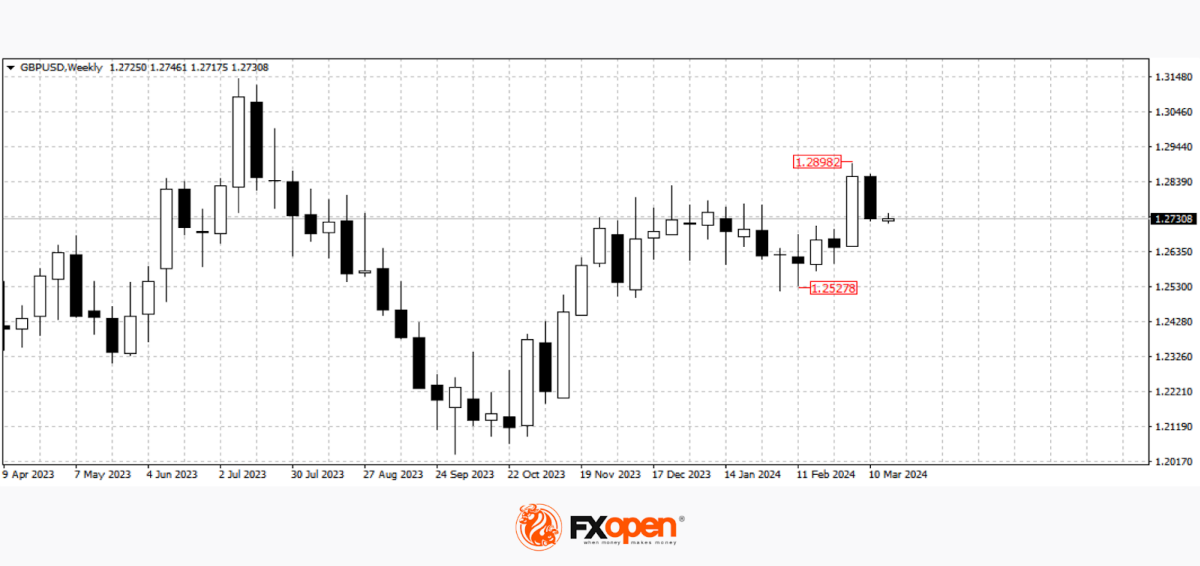
On March 11, we wrote that the price of EUR/USD may fall to the lower border of the channel (shown in blue) from the 8-week peak (B). In fact, the price made a bearish breakout of this channel.

5RDpl9W.png


TO VIEW THE FULL ANALYSIS, VISIT THE FXOPEN BLOG

Disclaimer: This article represents the opinion of the Companies operating under the FXOpen brand only (excluding FXOpen EU). It is not to be construed as an offer, solicitation, or recommendation with respect to products and services provided by the Companies operating under the FXOpen brand, nor is it to be considered financial advice.
 
WTI Oil Price Reaches 4-month High
FSb2buH.jpeg


The International Energy Agency (IEA) has once again raised its forecasts for global oil demand in 2024. While the agency's forecast pointed to the prospect of an oil surplus in 2023, its analysts now believe that the world will experience a shortage of oil in the second half of 2024.

Among the reasons for the shortage:
→ limitation of oil production by OPEC+ countries, it is 2 million barrels per day until the middle of the year. And it may be extended, as Bloomberg writes — the decision is scheduled for June 1;
→ changes in logistics routes due to Houthi attacks on tankers in the Red Sea.

Also, a bullish impulse for the price of WTI oil can be provided by the geopolitical situation, which remains tense.

panbB0y.png


TO VIEW THE FULL ANALYSIS, VISIT THE FXOPEN BLOG

Disclaimer: This article represents the opinion of the Companies operating under the FXOpen brand only (excluding FXOpen EU). It is not to be construed as an offer, solicitation, or recommendation with respect to products and services provided by the Companies operating under the FXOpen brand, nor is it to be considered financial advice.
 
Watch FXOpen's 11 - 15 March Weekly Market Wrap Video

Weekly Market Wrap With Gary Thomson: US500, USD, US Inflation, USD/JPY


Get the latest scoop on the week's hottest headlines, all in one convenient video. Join Gary Thomson, the COO of FXOpen UK, as he breaks down the most significant news reports and shares his expert insights.

  • US500: The Market Has Been Growing without Corrections by 2% for 266 Consecutive Trading Sessions #US500
  • A Weak Dollar Is the Driver of Price Records for NASDAQ-100, BTC/USD, XAU/USD #Dollar #USD #NASDAQ100 #BTCUSD #XAUUSD
  • Major Currency Pairs Consolidating after the Release of US Inflation Data #USInflation #Inflation
  • USD/JPY: Analysts Adjust Forecasts for the Strengthening of the Yen #USDJPY

Stay in the know and empower yourself with our short, yet power-packed video.

Watch it now and stay updated with FXOpen.


Don't miss out on this invaluable opportunity to sharpen your trading skills and make informed decisions.


FXOpen YouTube


Disclaimer: This article represents the opinion of the Companies operating under the FXOpen brand only (excluding FXOpen EU). It is not to be construed as an offer, solicitation, or recommendation with respect to products and services provided by the Companies operating under the FXOpen brand, nor is it to be considered financial advice.

#fxopen #fxopenyoutube #fxopenint #weeklyvideo
 
BTC/USD Analysis: Bears Have Become More Active Near the $70,000 Level
aBQwStO.jpeg


On February 26 (A), a strong bullish impulse started in the Bitcoin market. Its trajectory is visually described by a blue line. The price of bitcoins developed along it — this can be interpreted in such a way that market participants agreed that the value of the cryptocurrency was increasing.

If the price of Bitcoin deviated from the blue line, it was only for a short period of time. For example, to pierce the psychological level of USD 60,000 on March 5th.

However, the bullish momentum changed on March 15th, and this can be seen on the BTC/USD chart today:
→ the blue line began to work as resistance (shown by the first arrow);
→ the level of USD 70,000 also began to act as resistance (shown by the second arrow).

tz8Hurw.jpeg


TO VIEW THE FULL ANALYSIS, VISIT THE FXOPEN BLOG

Disclaimer: This article represents the opinion of the Companies operating under the FXOpen brand only (excluding FXOpen EU). It is not to be construed as an offer, solicitation, or recommendation with respect to products and services provided by the Companies operating under the FXOpen brand, nor is it to be considered financial advice.
 
Tesla Stock Hits a Low Point as Musk Sues Openai - Is This Year a Total Write-Off?
dVK01PW.jpeg


Occasionally during the course of industrial progress, there is a maverick; a voice that is known for continual disruption and maintaining a high-profile position whilst engaging in such disruption.

The figure of this decade is Elon Musk, a self-starter whose bluster and direct prose cast him as one of the world's most outspoken individuals, as well as a business magnate who manages to influence the financial markets at the click of a button.

From generating unprecedented waves in the cryptocurrency markets in 2021 to causing the motor industry to break with its 130-year-old tradition of using internal combustion as a main method of motive power, Elon Musk's market-making abilities are in line with his disruptive commentary and social media activity.

This set of characteristics has led to volatile stock in the most famous company, Tesla, founded and led by Elon Musk. With regard to such volatility, the start of this week is no exception.

Tesla stock is currently nosediving and has reached a low point of $162.20 by March 14. At the close of the US trading session on Friday, March 15, Tesla stock had retrieved some of the losses and rested at the mid-$163 range, however, this represents a mere slowing down of the plunging of Tesla stock prices because ever since the beginning of this month, Tesla stock has been depreciating at a considerable rate.

TO VIEW THE FULL ANALYSIS, VISIT THE FXOPEN BLOG

Disclaimer: This article represents the opinion of the Companies operating under the FXOpen brand only (excluding FXOpen EU). It is not to be construed as an offer, solicitation, or recommendation with respect to products and services provided by the Companies operating under the FXOpen brand, nor is it to be considered financial advice.
 
US Dollar Shows Record Weekly Gain Since Mid-January
Ot4twlF.jpeg


The US dollar strengthened on Friday ahead of a series of highly anticipated central bank meetings next week, including the US Federal Reserve. The dollar rose 1.3% for the week, its biggest gain since mid-January, after a mixed batch of data showed the U.S. economy remained resilient. That suggests the Federal Reserve could keep interest rates high for longer or reduce its planned number of rate cuts this year. Data on Friday showed a strong US manufacturing sector, with output rebounding 0.8% last month after a downwardly revised 1.1% decline in the previous month. The University of Michigan's preliminary overall consumer sentiment index for the month was 76.5, down from a final reading of 76.9 in February. The Fed's measure of annual inflation expectations remained unchanged at 3.0% in March. The five-year inflation forecast also remained stable at 2.9% for the fourth month in a row, according to the survey. The US Federal Reserve meeting will take place on Wednesday and analysts do not expect officials to make changes to monetary policy, but expect to receive forecasts for borrowing costs for the current year. The market continues to price in at least three 25 basis point interest rate cuts before the end of 2024, the first of which could come in June.

EUR/USD
95Q6t1m.png


The EUR/USD pair shows mixed dynamics, remaining close to 1.0885. Immediate resistance can be seen at 1.0899, a break higher could trigger a move towards 1.0963. On the downside, immediate support is seen at 1.0872, a break below could take the pair towards 1.0840.

Market activity remains subdued at the beginning of the week as traders are in no hurry to open positions in anticipation of the emergence of new drivers. Today the eurozone will publish February inflation statistics. The forecasts do not assume any changes in the consumer price index compared to previous data. On Thursday, March 21, trading participants will evaluate March data on business activity in the eurozone, as well as the ECB's monthly economic report, which may clarify the prospects for the regulator's monetary policy for the current year. Forecasts for business activity indices suggest an increase in the indicator from 46.5 points to 47.0 points in the manufacturing sector and from 50.2 points to 50.5 points in the services sector.

Technical analysis of EUR/USD shows that a new downward channel has formed based on last week’s lows. Now the price is in the middle of the channel and may continue to decline.

TO VIEW THE FULL ANALYSIS, VISIT THE FXOPEN BLOG

Disclaimer: This article represents the opinion of the Companies operating under the FXOpen brand only (excluding FXOpen EU). It is not to be construed as an offer, solicitation, or recommendation with respect to products and services provided by the Companies operating under the FXOpen brand, nor is it to be considered financial advice.
 
Bank of Japan Ends the Era of Negative Interest Rates
hPghsQE.jpeg


The Bank of Japan has not raised interest rates for 17 years. For 8 years, it was in the negative zone.

But today there was a dramatic shift in monetary policy — the Bank of Japan announced a decision to increase the interest rate from -0.1% to 0.1%.

The central bank also abandoned yield curve control (YCC), a policy that had been in place since 2016 and capped long-term interest rates near zero.

Considering the scale of the decisions taken, the reaction of the yen exchange rate relative to other currencies turned out to be moderate. This is because the plans of the Bank of Japan have been discussed for a long time, including in official sources of information. Therefore, it is acceptable to assume that participants in the currency markets have already laid down the probability of today's event.

In fact, the yen has weakened as a result, but this may only be an initial reaction in which markets are reassessing the impact of the Bank of Japan's decision over a range of short-term to long-term horizons.

9QWG9Dt.png


TO VIEW THE FULL ANALYSIS, VISIT THE FXOPEN BLOG

Disclaimer: This article represents the opinion of the Companies operating under the FXOpen brand only (excluding FXOpen EU). It is not to be construed as an offer, solicitation, or recommendation with respect to products and services provided by the Companies operating under the FXOpen brand, nor is it to be considered financial advice.
 
The Dollar Strengthens in Anticipation of the Fed's Rate Decision
dlSl62J.jpeg


The current five-day period is as full as possible with important fundamental data. This morning, a meeting of the Bank of Japan and the RBA took place. Tomorrow, the Fed will announce its decision on the rate, and on Thursday, market participants expect a verdict from the Bank of England. Decisions by officials may determine the pricing of major currency pairs in the coming months. After all, most currency pairs have been trading in narrow flat corridors for a long time, and an increase in volatility can lead to the start of new medium-term trends.

GBP/USD
clYBg38.png


A week ago, pound buyers managed to update the high of December last year at 1.2830. The price almost reached 1.2900, but the pound bulls failed to continue the upward movement and test the psychological resistance level at 1.3000. The pullback from 1.2900 contributed to the formation of a reversal combination for selling bearish harami on the w1 timeframe. Technical analysis of GBP/USD shows that if this formation continues, the price may decline to recent extremes at 1.2530-1.2500. We can consider cancelling the downward scenario if we confidently consolidate above 1.2900.

Tomorrow, pay attention to the release of data on the consumer price index in the UK for February. At 12:00 GMT+3, the housing price index for the past month will be released.

TO VIEW THE FULL ANALYSIS, VISIT THE FXOPEN BLOG

Disclaimer: This article represents the opinion of the Companies operating under the FXOpen brand only (excluding FXOpen EU). It is not to be construed as an offer, solicitation, or recommendation with respect to products and services provided by the Companies operating under the FXOpen brand, nor is it to be considered financial advice.
 
A Yen For Volatility: US Dollar Surges as Japan Ends 8 Years of Negative Rates
DNIPSfd.jpeg


Eight long years have passed since the Bank of Japan introduced its controversial yet pioneering attempt to encourage spending in what has become an ultra-conservative economy, which has experienced a sustained period of stagnation.

In 2016, Japan's central bankers decided to introduce negative interest rates, a term which refers to the maintaining of artificially low interest rates in order to encourage businesses and private individuals to borrow money and therefore spend, which would in turn increase the size of the Japanese economy and result in economic growth.

During that eight-year period, times have not been easy in Japan with regard to its national economic situation, and despite the country having not invoked any lockdowns or restrictions in the way that many Western nations did four years ago and a longstanding series of challenges faced the Japanese fiscal situation.

Over the course of time, Japan's demographics have changed, and it has the longest life expectancy in the world; therefore, a large proportion of retired people and a conservative younger generation have appeared to save money rather than spend or invest it.

Many analyses consider that the negative interest rate policy was invoked to encourage such people to withdraw their savings from bank accounts and either spend it or invest it in other areas, such as property or business ventures.

Just six months after the introduction of the policy in 2016, the Japanese economy had not grown, and in some reports there are opinions which state that Japan's authorities can now look back on 25 years of failed economic stimulus attempts.

That is a harsh criticism, however it appears that Japan's central bank has given up on the most recent one and in a landmark decision has today put an end to eight years of negative interest rates.

This means a return to standard market rates, and the result in the currency markets is noticeable.

The US dollar has made gains against the Japanese Yen during today's trading session, beginning with the Asian market.

The USDJPY pair is now trading at 150.424 Yen to the US Dollar, which puts it back at the high point it was at when March began.

TO VIEW THE FULL ANALYSIS, VISIT THE FXOPEN BLOG

Disclaimer: This article represents the opinion of the Companies operating under the FXOpen brand only (excluding FXOpen EU). It is not to be construed as an offer, solicitation, or recommendation with respect to products and services provided by the Companies operating under the FXOpen brand, nor is it to be considered financial advice.
 
Market Analysis: EUR/USD Dips Again, USD/JPY Rallies Above 151
r4FneUr.jpeg


EUR/USD started another decline from the 1.0960 resistance. USD/JPY surged and broke the 151.00 resistance zone.

Important Takeaways for EUR/USD and USD/JPY Analysis Today

  • The Euro started a fresh decline below the 1.0900 support zone.
  • There is a key bearish trend line forming with resistance at 1.0870 on the hourly chart of EUR/USD at FXOpen.
  • USD/JPY climbed higher above the 150.00 and 151.00 levels.
  • There is a connecting bullish trend line forming with support at 150.20 on the hourly chart at FXOpen.

EUR/USD Technical Analysis
Qg97UFp.png


On the hourly chart of EUR/USD at FXOpen, the pair struggled to clear the 1.0960 resistance zone. The Euro started a fresh decline and traded below the 1.0900 support zone against the US Dollar.

The pair even declined below 1.0870 and tested the 1.0835 zone. A low was formed near 1.0834 and the pair is now correcting losses. On the upside, the pair is now facing resistance near the 50% Fib retracement level of the recent decline from the 1.0906 swing high to the 1.0834 low at 1.0870.

There is also a key bearish trend line forming with resistance at 1.0870. The next key resistance is near the 76.4% Fib retracement level of the recent decline from the 1.0906 swing high to the 1.0834 low at 1.0890.

The main resistance is 1.0905. A clear move above the 1.0905 level could send the pair toward the 1.0960 resistance. An upside break above 1.0960 could set the pace for another increase. In the stated case, the pair might rise toward 1.1020.

If not, the pair might resume its decline. The first major support on the EUR/USD chart is near 1.0835. The next key support is at 1.0820. If there is a downside break below 1.0820, the pair could drop toward 1.0785. The next support is near 1.0750, below which the pair could start a major decline.

TO VIEW THE FULL ANALYSIS, VISIT THE FXOPEN BLOG

Disclaimer: This article represents the opinion of the Companies operating under the FXOpen brand only (excluding FXOpen EU). It is not to be construed as an offer, solicitation, or recommendation with respect to products and services provided by the Companies operating under the FXOpen brand, nor is it to be considered financial advice.
 
Back
Top