Daily Market Analysis By FXOpen

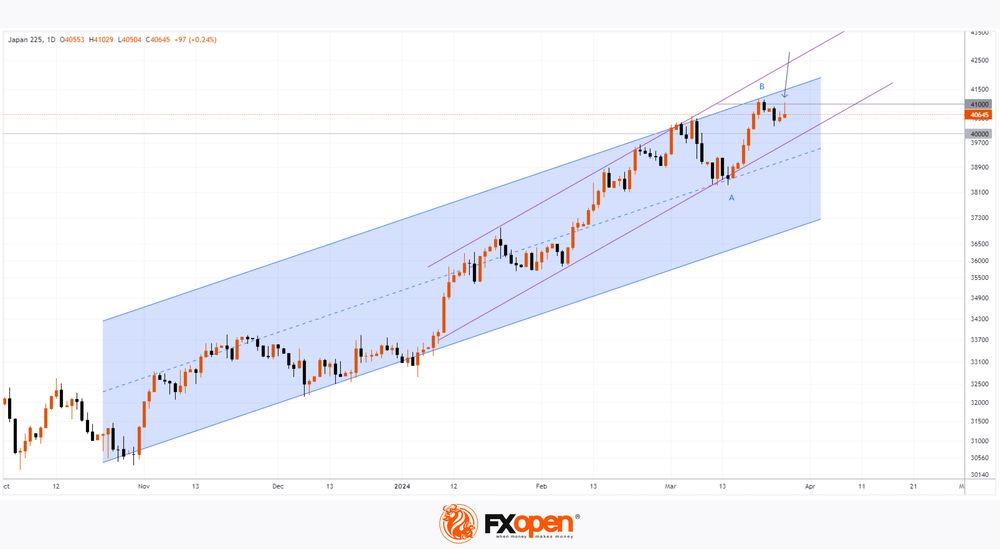
Big in Japan: Several Years of Failed Stimulus Ends, But Stocks Go Up!
BMU6fGz.png


Japan's notoriously conservative approach to business practices combined with a world renowned reputation for engineering excellence has been a winning combination for the island nation for over 60 years.

A relatively small country was able to successfully market a range of products in many sectors ranging from electronic goods to automobiles to a worldwide audience to the extent that Japanese corporations are now global giants with head offices in various countries across the world and the names of these corporations household names in all continents.

An incredible attention to detail, highly educated population and unfaltering work ethic transformed Japan into the ultra-sophisticated nation that it is today, however perhaps surprisingly this commercial dominance has not always equaled a world-beating national economy.

Over recent years, the Japanese Yen has been subject to various periods of volatility, and Japanese stocks, once the absolute pinnacle of economic success during the 'Yuppie Years' of the 1980s when there was no internet and heavy manufacturing companies and property development giants were the largest companies in the world.

Since the rise of the Silicon Valley tech giants, all of which are a creation of the Internet revolution, however, Japan's indices have been far less of a talking point among traders and investors of the stocks of large companies as the absolute dominance of the 'Magnificent 7' and the halo effect they have created around other internet-based companies, software firms and e-commerce tours de force has changed the entire focus from traditional bricks and mortar companies toward those whose products are in the ether.

TO VIEW THE FULL ANALYSIS, VISIT FXOPEN BLOG

Disclaimer: This article represents the opinion of the Companies operating under the FXOpen brand only (excluding FXOpen EU). It is not to be construed as an offer, solicitation, or recommendation with respect to products and services provided by the Companies operating under the FXOpen brand, nor is it to be considered financial advice.
 
USD/JPY Price Analysis: Consolidation ahead of US News
kQR4QmX.jpeg


This morning, news about inflation in Japan was published. It did not bring any surprises — inflation in Japan is gradually weakening as expected. Core CPI in annual terms: actual = 2.3%, forecast = 2.5%, a month ago = 2.6%, a year ago = 3.0%.

We also note that the official position is aimed at preventing further weakening of the yen, as the USD/JPY price has risen more than 7% since the beginning of 2024 — very close to a 32-year high. Thus, Japanese Deputy Finance Minister for Economic Affairs Masato Kanda yesterday warned that the current weakening of the yen does not correspond to fundamental indicators and is clearly caused by speculation. He concluded that the authorities would take appropriate measures against excessive fluctuations.

However, neither verbal interventions nor the publication of Japanese Core CPI values led to strong fluctuations in the USD/JPY market. Why so?

From a fundamental analysis point of view, market participants are keeping their focus on the publication of Core PCE Price Index values in the US, as well as the Fed Chairman's speech — both events are scheduled for Friday (at 15:30 and 18:30 GMT+3, respectively).

From a technical analysis point of view, the market stabilization is quite natural, since the USD/JPY price today is near the median line of the ascending channel (shown in blue), which describes the trajectory of 2024. The market seems to be cooling down after the RSI indicated it was overbought on March 20th.

It is the events of Friday that can bring the market out of the current equilibrium state (despite the fact that Friday is a day off in many countries, volatility can be high).

GUtL9Wr.png


TO VIEW THE FULL ANALYSIS, VISIT FXOPEN BLOG

Disclaimer: This article represents the opinion of the Companies operating under the FXOpen brand only (excluding FXOpen EU). It is not to be construed as an offer, solicitation, or recommendation with respect to products and services provided by the Companies operating under the FXOpen brand, nor is it to be considered financial advice.
 
The Spacs Are Back! NASDAQ on A High as Trump's Social Media Co Goes Public
Jb9RvpS.jpeg


It seems as though the sensationalism that surrounded the controversial SPAC listings, which suddenly found their way onto the technology-friendly NASDAQ exchange in 2021, was a long time ago.

Back at the beginning of this decade, many aspects of business and ways of life that had remained similar for a long period of time changed beyond recognition, and one of them was the admission of 'blank cheque' companies onto the NASDAQ exchange in the form of SPAC entities, with SPAC standing for Special Purchase Acquisition Company.

This method of suddenly going from a start-up status to multi-billion dollar publicly traded company within almost no time and with the ability to bypass much of the criteria required for public listing on major exchanges gave rise to the sudden influx of a number of previously unknown entities which had hardly any market share in their industry sector, yet were able to list their stock publicly for millions, sometimes billions, of dollars.

That era has passed, and many of those firms have experienced severe depreciation of their stock ever since, which has had some degree of effect on the volatility in the NASDAQ index over the tech stock doldrums the ensuing year.

Now, however, with the NASDAQ index flying high and investor appetite for tech stocks well and truly back on track, there is another interesting dynamic which has brought the concept of SPAC listings back into the public arena.

Today, the NASDAQ index was trading at 18,398 at 9.30 am UK time, which is another increment on the steady upward direction the index has been building upon all of this year so far since rebounding back from a low point of 14,127 in late November last year.

TO VIEW THE FULL ANALYSIS, VISIT FXOPEN BLOG

Disclaimer: This article represents the opinion of the Companies operating under the FXOpen brand only (excluding FXOpen EU). It is not to be construed as an offer, solicitation, or recommendation with respect to products and services provided by the Companies operating under the FXOpen brand, nor is it to be considered financial advice.
 
The US Currency Corrects after Recent Growth
S61mKUd.jpeg


The incoming fundamental data of the past five-day period contributed to the strengthening of the American currency in almost all major pairs. Thus, the pound/US dollar currency pair lost more than 200 pp over several trading sessions, the euro/US dollar pair retested 1.0800, and buyers of the USD/JPY pair managed to keep the price above 151.00.

GBP/USD
gPdUoCF.png


The decision of British officials to leave the base interest rate at the same level did not contribute to the strengthening of the pound/US dollar pair. And the hint from the head of the Bank of England about a possible rate cut at the next meeting led to sharp losses in the pair and a test at the price of the important support level of 1.2600. At the moment, the pair is consolidating just above the mentioned mark. In the case of a positive fundamental background from the UK, the price may correct to 1.2800-1.2740. If the downtrend resumes, the price on the gbp/usd chart may retest 1.2570.

Tomorrow at 13:30 GMT+3, we are waiting for the publication of the minutes of the meeting of the Bank of England Financial Policy Committee. A little later, the CBI retail sales index will be published.

TO VIEW THE FULL ANALYSIS, VISIT FXOPEN BLOG

Disclaimer: This article represents the opinion of the Companies operating under the FXOpen brand only (excluding FXOpen EU). It is not to be construed as an offer, solicitation, or recommendation with respect to products and services provided by the Companies operating under the FXOpen brand, nor is it to be considered financial advice.
 
Market Analysis: GBP/USD Dives While USD/CAD Gains Bullish Pace
lU1iHmD.jpeg


GBP/USD declined below the 1.2665 support zone. USD/CAD is rising and might aim for more gains above the 1.3610 resistance.

Important Takeaways for GBP/USD and USD/CAD Analysis Today

  • The British Pound started a fresh decline from the 1.2800 resistance zone.
  • There was a break below a key rising channel with support at 1.2630 on the hourly chart of GBP/USD at FXOpen.
  • USD/CAD is showing positive signs above the 1.3555 support zone.
  • There was a break above a major bearish trend line with resistance near 1.3575 on the hourly chart at FXOpen.

GBP/USD Technical Analysis
mdP7Ek8.png


On the hourly chart of GBP/USD at FXOpen, the pair started a fresh decline from the 1.2800 zone. The British Pound traded below the 1.2690 support to move into further a bearish zone against the US Dollar.

The pair even traded below 1.2665 and the 50-hour simple moving average. Finally, the bulls appeared near the 1.2580 level. A low was formed at 1.2575 and the pair recently attempted a recovery wave. The pair climbed above the 1.2600 level.

It cleared the 23.6% Fib retracement level of the downward move from the 1.2803 swing high to the 1.2575 low. However, the bears were active near 1.2665 and pushed the pair lower again.

There was a break below a key rising channel with support at 1.2630. Initial support on the GBP/USD chart sits at 1.2600. The next major support sits at 1.2575, below which there is a risk of another sharp decline. In the stated case, the pair could drop toward 1.2500.

Immediate resistance on the upside is near the 1.2665 level. The first major resistance is near the 50% Fib retracement level of the downward move from the 1.2803 swing high to the 1.2575 low at 1.2690.

A close above the 1.2690 resistance might spark a steady upward move. The next major resistance is near the 1.2750. Any more gains could lead the pair toward the 1.2800 resistance in the near term.

TO VIEW THE FULL ANALYSIS, VISIT FXOPEN BLOG

Disclaimer: This article represents the opinion of the Companies operating under the FXOpen brand only (excluding FXOpen EU). It is not to be construed as an offer, solicitation, or recommendation with respect to products and services provided by the Companies operating under the FXOpen brand, nor is it to be considered financial advice.
 
NIKKEI-225 Analysis Indicates Possibility of Correction from Historically High Levels
34Xq0GS.jpeg


On March 21, the value of the Japanese stock index reached a historical maximum, exceeding the level of 41,100 points. This was facilitated by:

→ Weak yen supporting exporters. It increases the value of profits earned abroad for a large number of companies that sell their products abroad and then convert the profits into yen.
→ Demand for shares of Japanese companies paying dividends. For example, shares of air conditioner manufacturer Daikin Industries rose by 2.82%.

At the same time, the NIKKEI-225 chart signals indicate the likelihood of a correction, since:

→ The price is near the upper border of the ascending channel, from which resistance can be expected.

POjuDlq.png


TO VIEW THE FULL ANALYSIS, VISIT FXOPEN BLOG

Disclaimer: This article represents the opinion of the Companies operating under the FXOpen brand only (excluding FXOpen EU). It is not to be construed as an offer, solicitation, or recommendation with respect to products and services provided by the Companies operating under the FXOpen brand, nor is it to be considered financial advice.
 
EUR/USD Analysis: The Price Today Has Set Its Minimum Since the Beginning of March
0VTn8n1.jpeg


As the EUR/USD chart shows at the start of the European session today, the exchange rate has dropped below EUR 1.08 per US dollar.

Tuesday's news contributed to this. According to Nasdaq.com, on March 26, 2024, The Conference Board published a report for March, according to which the CB Consumer Confidence index of consumer confidence dropped sharply: fact = 104.7; forecast = 107.0; previous value = 106.7. Comments followed: “Consumers remain concerned about increased price levels, which dominates the responses. March written responses showed growing concerns about food and gasoline prices.”

As a result, the US dollar strengthened (as shown by arrow No. 1). After all, if the published data give grounds to assess inflation as high, then the Fed’s tough policy may last longer.

JJf3Pxn.png


TO VIEW THE FULL ANALYSIS, VISIT FXOPEN BLOG

Disclaimer: This article represents the opinion of the Companies operating under the FXOpen brand only (excluding FXOpen EU). It is not to be construed as an offer, solicitation, or recommendation with respect to products and services provided by the Companies operating under the FXOpen brand, nor is it to be considered financial advice.
 
Stock Market Analysis: NVDA Losing Leadership?
IjE5HEB.jpeg


Since the start of the week, the S&P-500 Index (US500) is up about 0.58% while NVDA's share price is down about 3.8%. This is a worrying sign for Nvidia stock investors — could it be a sign that NVDA is no longer the market leader?

Dubravko Lakos-Bujas, JPMorgan's chief equity strategist, warned of a potential "surprise" shock to the stock market, Bloomberg reported. He's noticed a trend in recent history where gains in popular momentum stocks like NVDA are often followed by corrections. This situation has repeated itself three times since the 2008 global financial crisis.

“One day this may happen completely unexpectedly. This has happened in the past; we’ve had flash collapses,” Lakos-Bujas said in the webinar. “One large fund starts cutting some positions, a second fund hears this and tries to reposition, a third fund is basically caught off guard, and then, you know, we start to unwind more and more momentum.”

He noted the potential for innovation in artificial intelligence as a major source of surprise, emphasizing that these opportunities are dwindling and risks are growing in the background.

AmR1jH4.jpeg


TO VIEW THE FULL ANALYSIS, VISIT FXOPEN BLOG

Disclaimer: This article represents the opinion of the Companies operating under the FXOpen brand only (excluding FXOpen EU). It is not to be construed as an offer, solicitation, or recommendation with respect to products and services provided by the Companies operating under the FXOpen brand, nor is it to be considered financial advice.
 
Commodities and European currencies Test Key Supports
EuQvpS1.jpeg


On the eve of the Easter holidays, the main currency pairs have slightly slowed down the development of the main trends and are consolidating near key ranges, the breakdown of which could provoke a change in the vectors of medium-term movements. Thus, the US dollar/loonie currency pair is trading near 1.3600, euro/US dollar sellers are trying to push through the support at 1.0800, and the pound/US dollar pair is once again testing 1.2600.

USD/CAD
iX0TmyW.png


Fluctuations in the oil market and the Fed’s indecisiveness regarding changing the vector of monetary policy contributed to the strengthening of the USD/CAD pair to recent extremes at 1.3600. If buyers of the pair manage to gain a foothold above the mentioned level, the price on the usd/cad chart may continue to rise in the direction of 1.4000-1.3800. Otherwise, another price test of 1.3400-1.3300 is possible.

Today at 15:30 GMT+3, the publication of Canadian GDP data for January is expected. US GDP data for the fourth quarter will also be published and weekly data on the number of applications for unemployment benefits will be released.

TO VIEW THE FULL ANALYSIS, VISIT FXOPEN BLOG

Disclaimer: This article represents the opinion of the Companies operating under the FXOpen brand only (excluding FXOpen EU). It is not to be construed as an offer, solicitation, or recommendation with respect to products and services provided by the Companies operating under the FXOpen brand, nor is it to be considered financial advice.
 
Market Analysis: Gold Price and Crude Oil Price Gain Bullish Momentum
eOkFIWt.jpeg


Gold price started a steady increase above the $2,200 resistance level. Crude oil prices are gaining bullish momentum and might rise toward $85.00.

Important Takeaways for Gold and Oil Prices Analysis Today

  • Gold price started a decent increase from the $2,158 zone against the US Dollar.
  • A connecting bullish trend line is forming with support near $2,218 on the hourly chart of gold at FXOpen.
  • Crude oil prices rallied above the $81.60 and $82.00 resistance levels.
  • There is a key bullish trend line forming with support at $82.30 on the hourly chart of XTI/USD at FXOpen.

Gold Price Technical Analysis
Bvno2hA.png


On the hourly chart of Gold at FXOpen, the price found support near the $2,158 zone. The price formed a base and started a fresh increase above the $2,175 level.

There was a decent move above the 50-hour simple moving average and $2,200. The bulls pushed the price above the $2,220 resistance zone. Finally, the bears appeared near $2,235, A high was formed near $2,236.20 and the price is now consolidating gains.

The current price action is positive above the 23.6% Fib retracement level of the upward move from the $2,157 swing low to the $2,236 high. The RSI is still stable near 60 and the price could aim for more gains.

Immediate resistance is near the $2,235 level. The next major resistance is near the $2,240 level. An upside break above the $2,240 resistance could send Gold price toward $2,250. Any more gains may perhaps set the pace for an increase toward the $2,265 level.

Initial support on the downside is near the $2,218 zone. There is also a connecting bullish trend line forming with support near $2,218. If there is a downside break below the $2,218 support, the price might decline further.

In the stated case, the price might drop toward the $2,195 support or the 50% Fib retracement level of the upward move from the $2,157 swing low to the $2,236 high.

TO VIEW THE FULL ANALYSIS, VISIT FXOPEN BLOG

Disclaimer: This article represents the opinion of the Companies operating under the FXOpen brand only (excluding FXOpen EU). It is not to be construed as an offer, solicitation, or recommendation with respect to products and services provided by the Companies operating under the FXOpen brand, nor is it to be considered financial advice.
 
Back
Top