FxGrow Support
Recruit
- Messages
- 58
Daily Technical Analysis – 03rd Aug, 2015
By FxGrow Research & Analysis Team
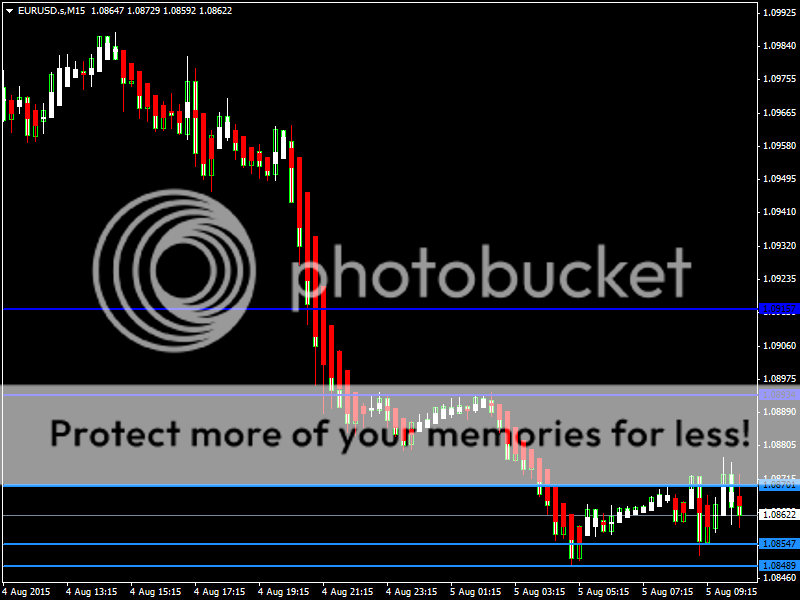
EURUSD
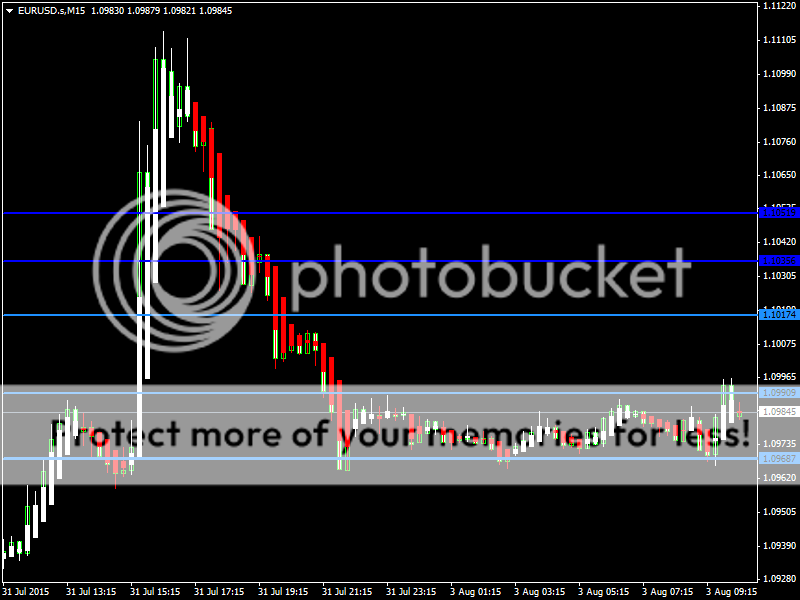
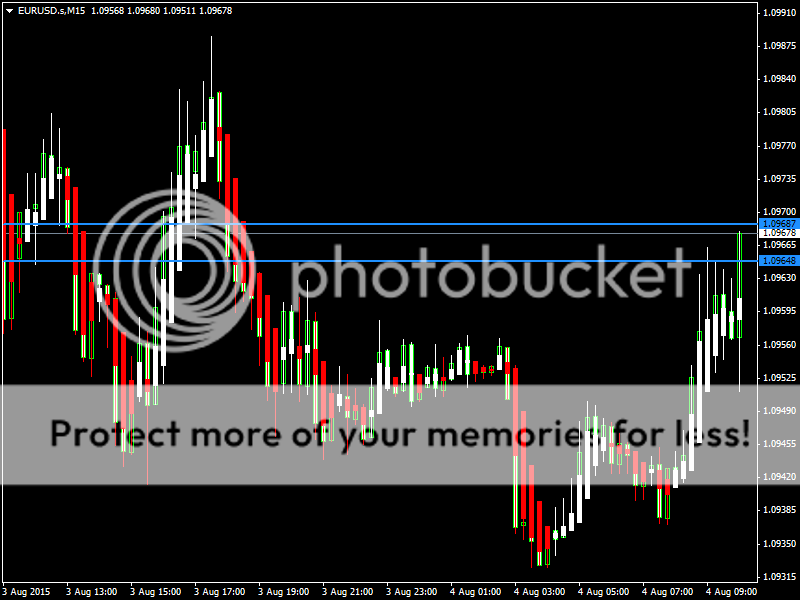
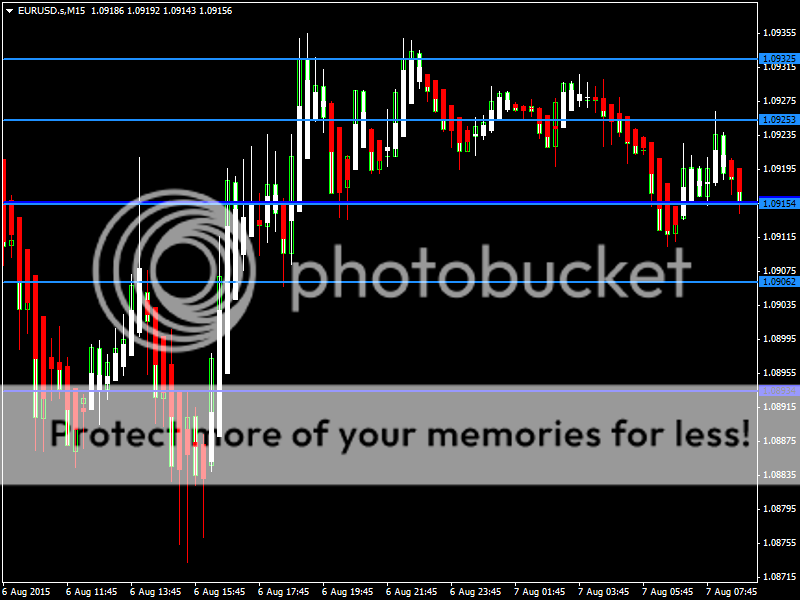
EURUSD was indecisive last week and opened the week lower this morning. Now the pair is trading below its 20day moving average of 1.0997 in the European trading session. The near term bias remains Neutral to Bullish with targets of 1.1050
RSI (14) is Neutral; STOCH (9, 6), STOCHRSI (14), MACD (12, 26), CCI (14), Ultimate Oscillator indicate a BUY; while Average True Range (14) indicates Less Volatility.
Support is at 1.0947 while Resistance is at 1.1034
03rd Aug 2015 – 07:29hrs GMT
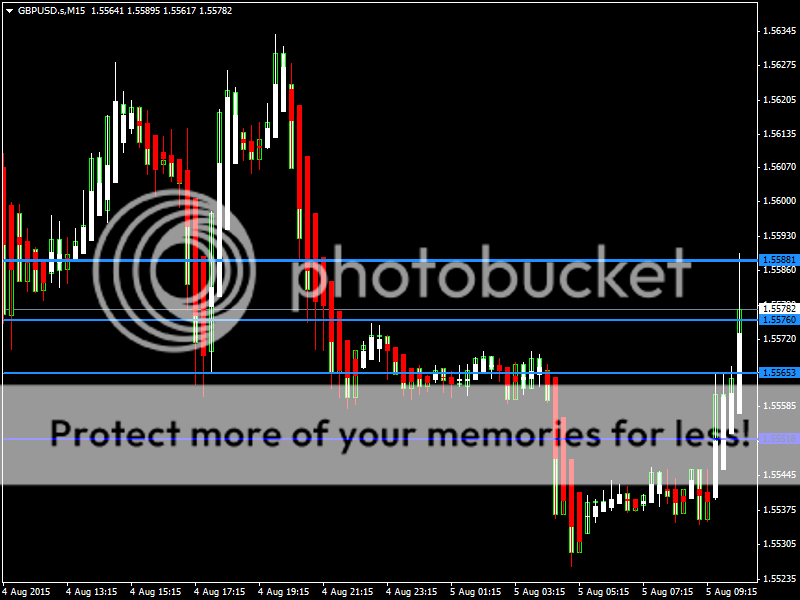
GBPUSD
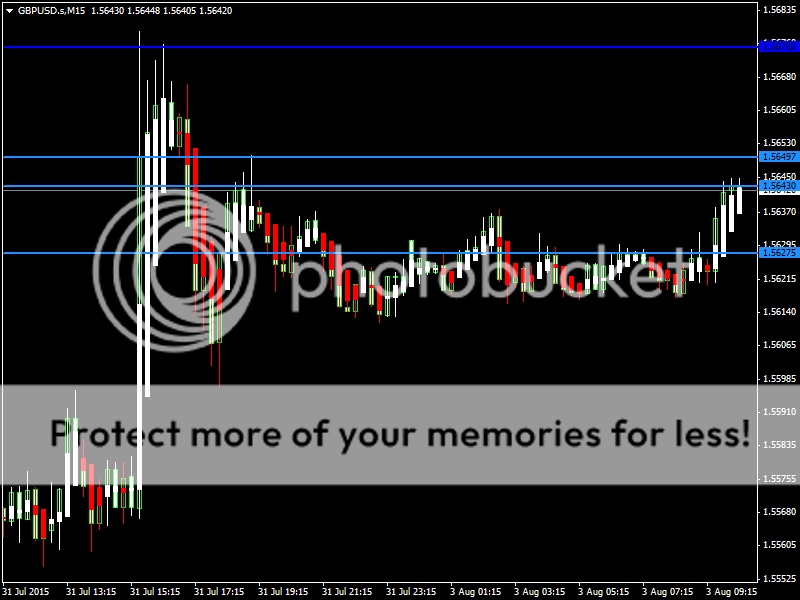
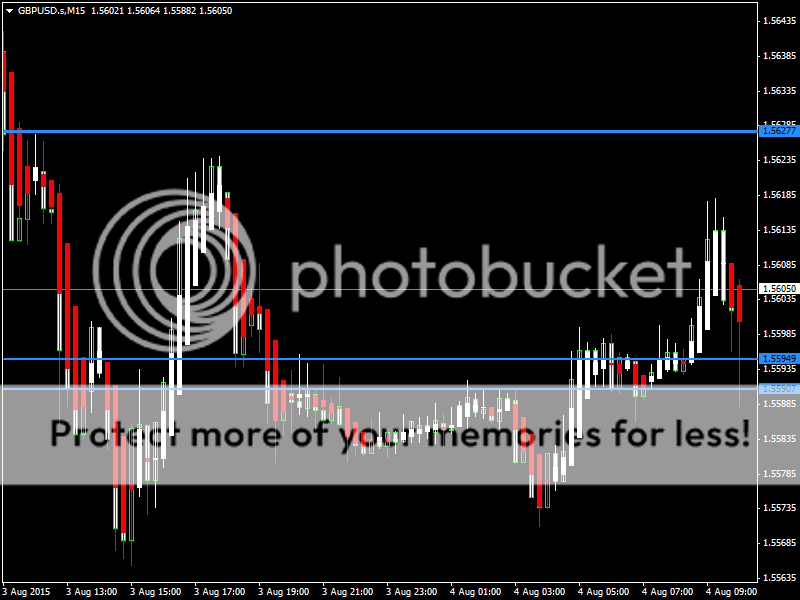
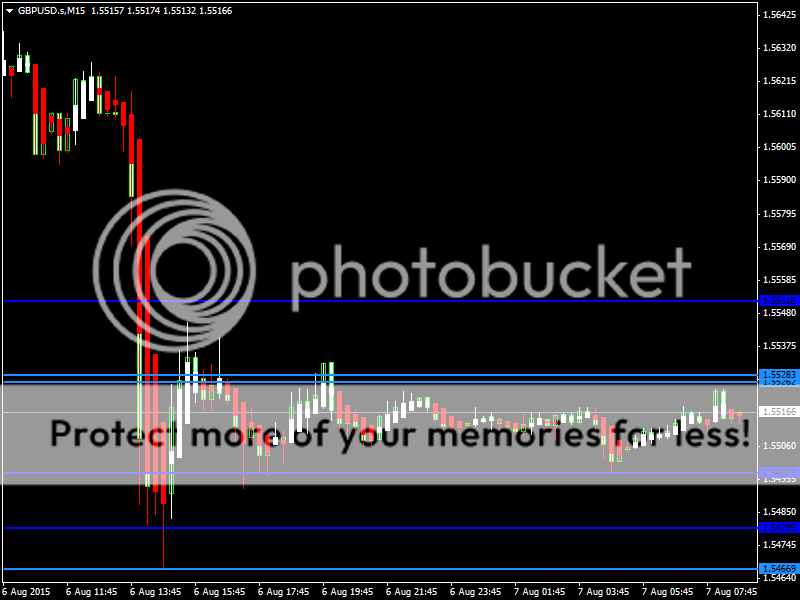
GBPUSD was bullish last week and opened the week at same levels. Now the pair is trading above its 20day moving average of 1.5628 in the European trading session. The near term bias remains Neutral to Bullish with targets of 1.5700
STOCH (9, 6), Ultimate Oscillator are Neutral; RSI (14), STOCHRSI (14), MACD (12, 26), ADX (14), ROC indicate a BUY; CCI (14) is Overbought; while Average True Range (14) indicates Less Volatility.
Support is at 1.5551 while Resistance is at 1.5675
03rd Aug 2015 – 07:45hrs GMT
For more in depth Research & Analysis please visit FxGrow.
Note: This analysis is intended to provide general information and does not constitute the provision of INVESTMENT ADVICE. Investors should, before acting on this information, consider the appropriateness of this information having regard to their personal objectives, financial situation or needs. We recommend investors obtain investment advice specific to their situation before making any financial investment decision.
By FxGrow Research & Analysis Team
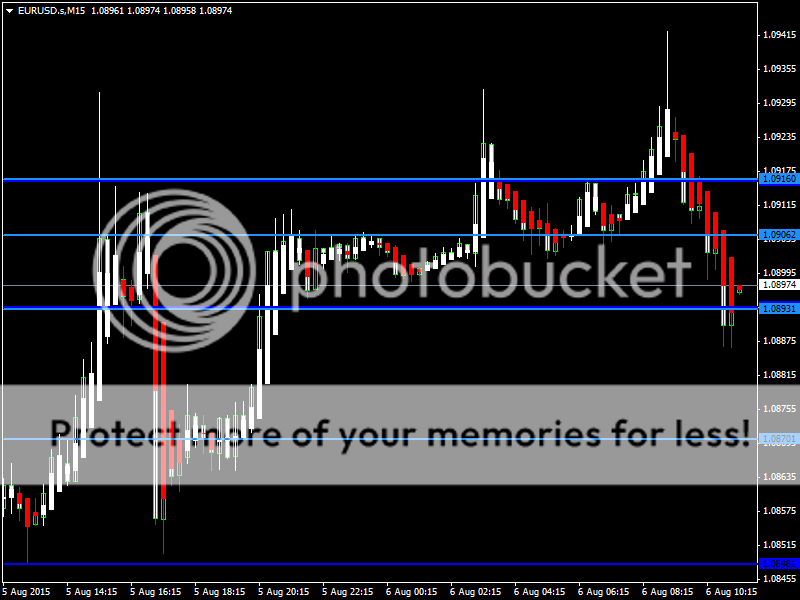
EURUSD
EURUSD was indecisive last week and opened the week lower this morning. Now the pair is trading below its 20day moving average of 1.0997 in the European trading session. The near term bias remains Neutral to Bullish with targets of 1.1050
RSI (14) is Neutral; STOCH (9, 6), STOCHRSI (14), MACD (12, 26), CCI (14), Ultimate Oscillator indicate a BUY; while Average True Range (14) indicates Less Volatility.
Support is at 1.0947 while Resistance is at 1.1034
03rd Aug 2015 – 07:29hrs GMT
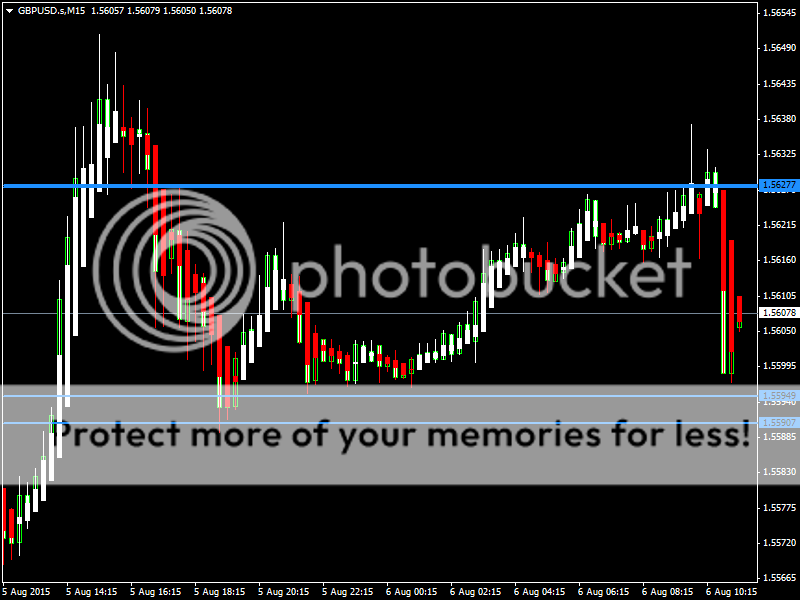
GBPUSD
GBPUSD was bullish last week and opened the week at same levels. Now the pair is trading above its 20day moving average of 1.5628 in the European trading session. The near term bias remains Neutral to Bullish with targets of 1.5700
STOCH (9, 6), Ultimate Oscillator are Neutral; RSI (14), STOCHRSI (14), MACD (12, 26), ADX (14), ROC indicate a BUY; CCI (14) is Overbought; while Average True Range (14) indicates Less Volatility.
Support is at 1.5551 while Resistance is at 1.5675
03rd Aug 2015 – 07:45hrs GMT
For more in depth Research & Analysis please visit FxGrow.
Note: This analysis is intended to provide general information and does not constitute the provision of INVESTMENT ADVICE. Investors should, before acting on this information, consider the appropriateness of this information having regard to their personal objectives, financial situation or needs. We recommend investors obtain investment advice specific to their situation before making any financial investment decision.