FxGrow Support
Recruit
- Messages
- 58
Daily Technical Analysis – 10th Aug, 2015
By FxGrow Research & Analysis Team
EURUSD
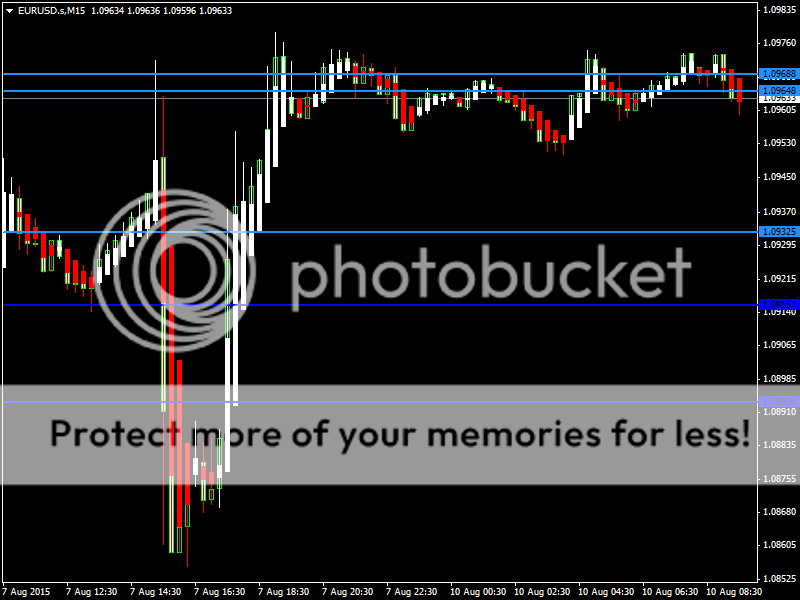
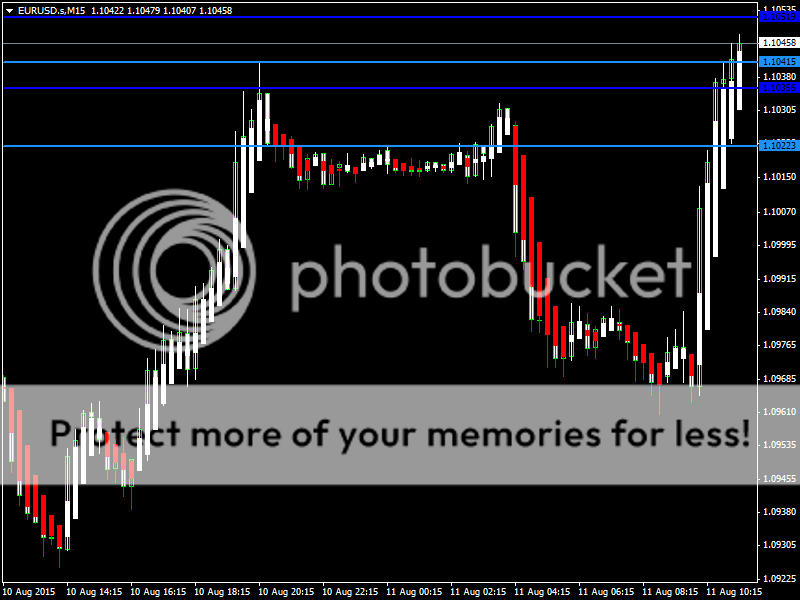
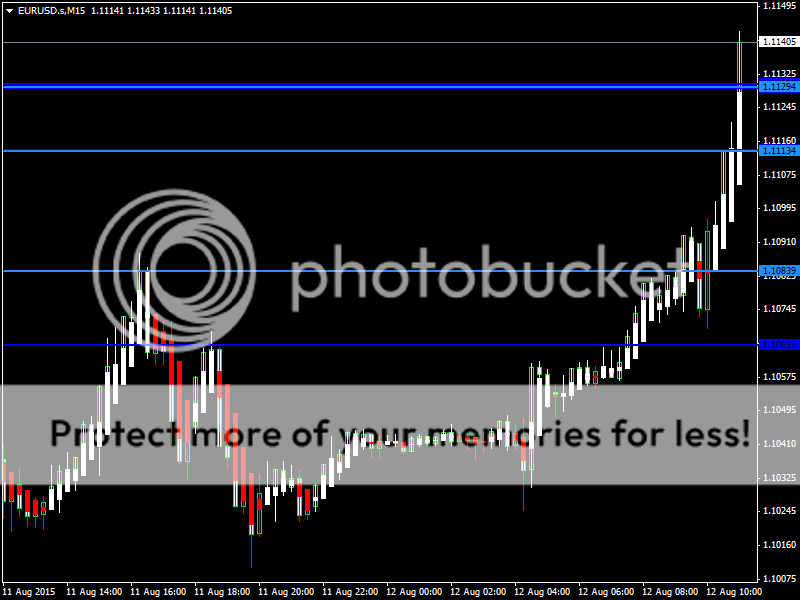
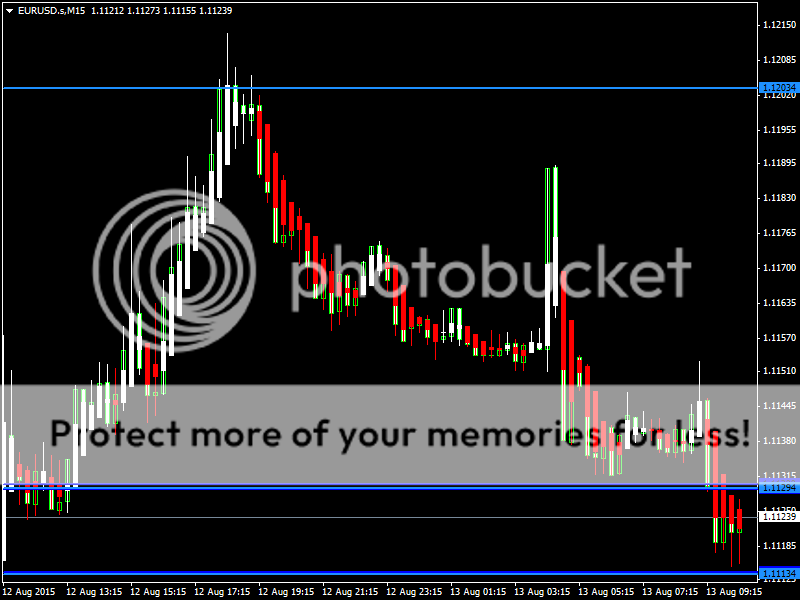
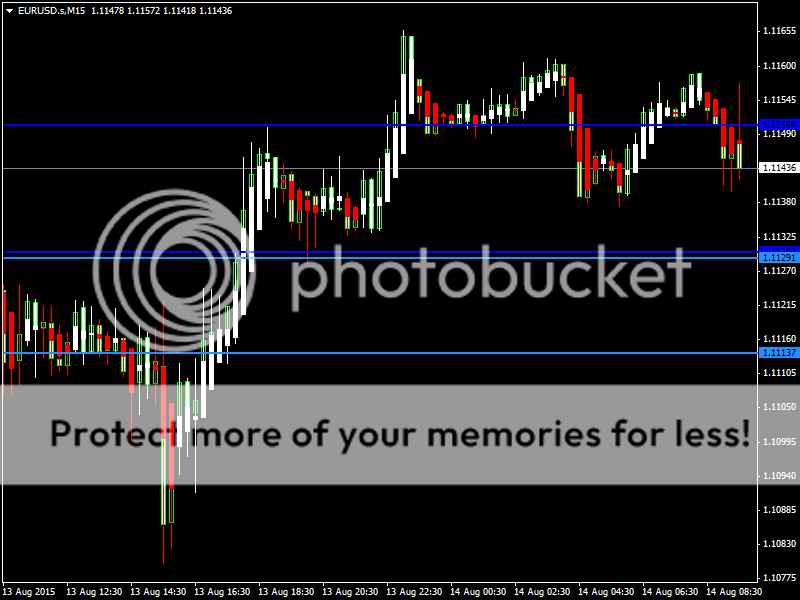
EURUSD was indecisive last week and opened the week lower at 1.0949 today. Now the pair is trading above its 20day moving average of 1.0931 in the European trading session. The near term bias remains Bullish with targets of 1.1010
RSI (14), MACD (12, 26), ADX (14), CCI (14), Ultimate Oscillator, ROC, MA100, MA200 indicate a BUY; STOCH (9, 6), STOCHRSI (14) is Overbought; while Average True Range (14) indicates High Volatility.
Support is at 1.0940 while Resistance is at 1.0982
10th Aug 2015 – 06:44hrs GMT
GBPUSD
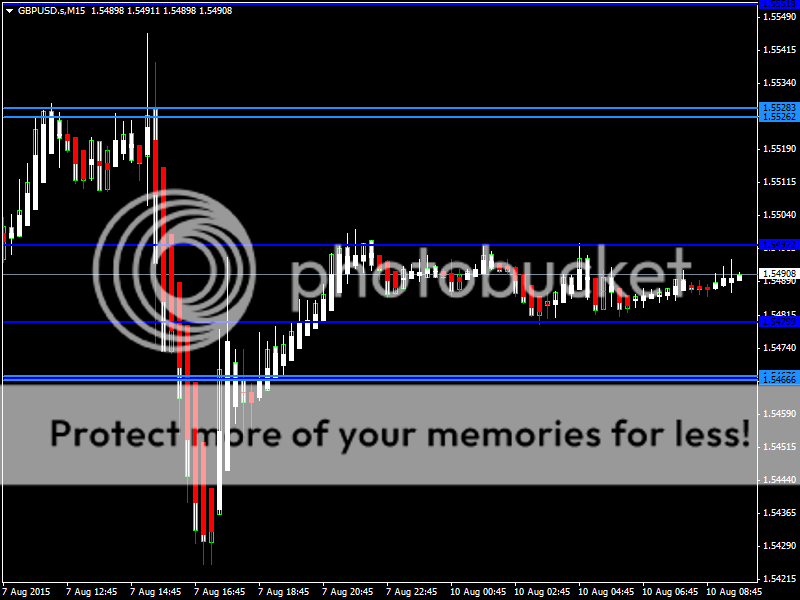
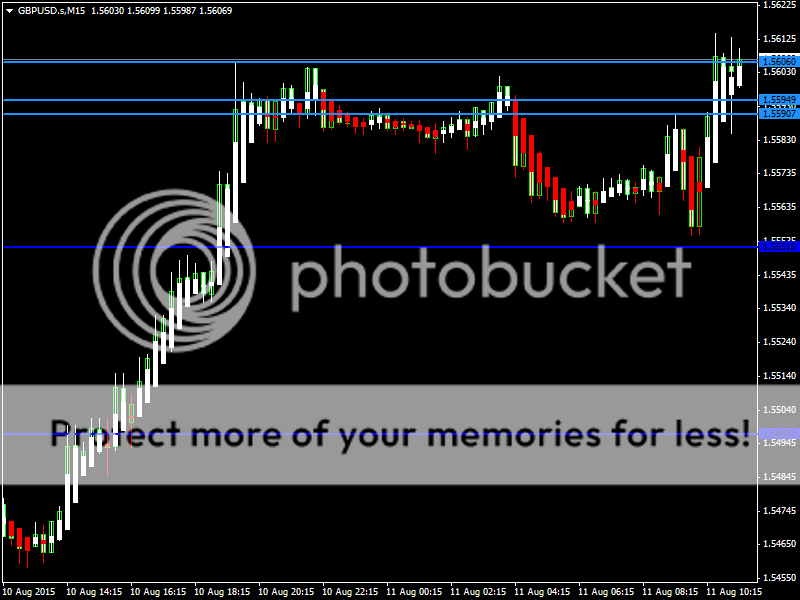
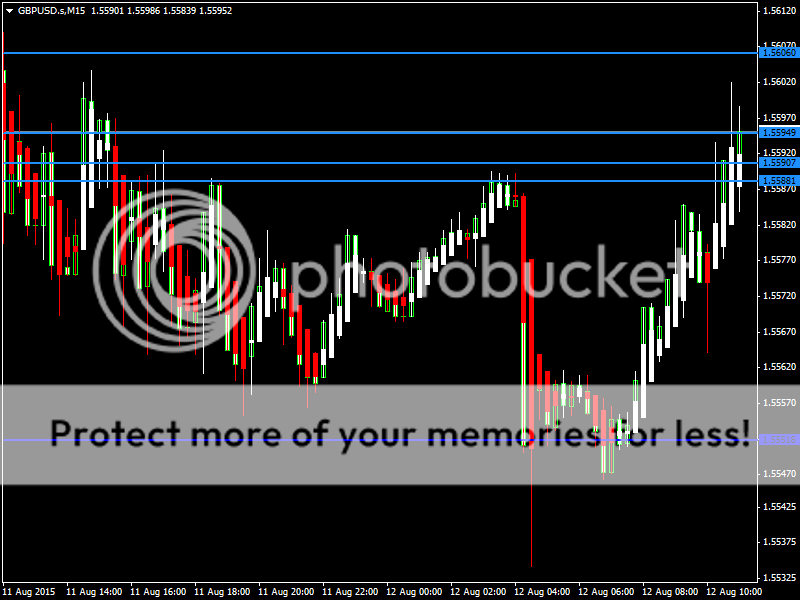
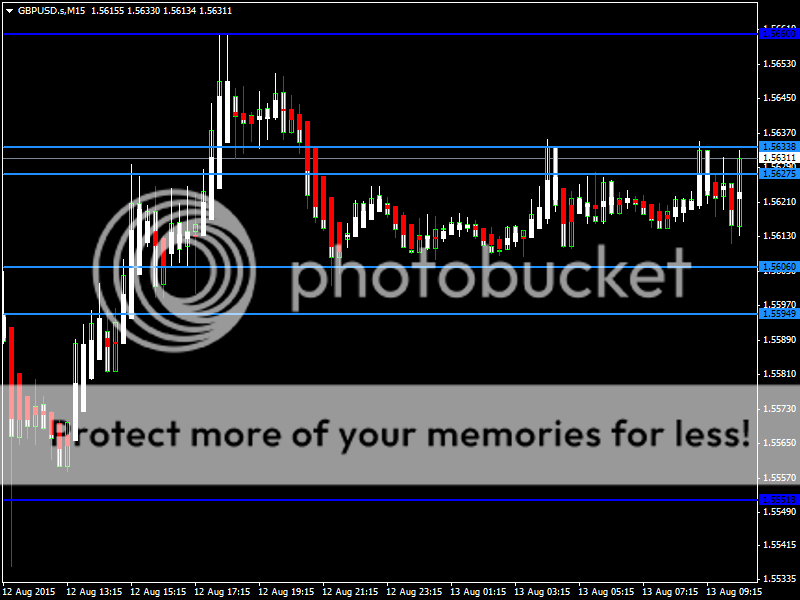
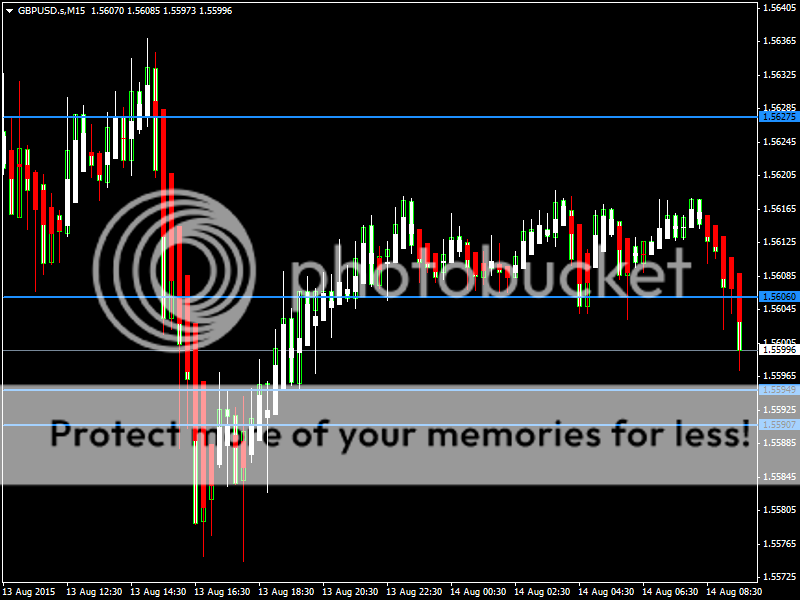
GBPUSD was bearish last week as it touched a low of 1.5423 and opened this week higher at 1.5487 in the Asian trading session. Now the pair is trading below its 20day moving average of 1.5495 in the European trading session. The near term bias remains Neutral to Bearish with targets of 1.5410
RSI (14), STOCH (9, 6), CCI (14) are Neutral; MACD (12, 26), Ultimate Oscillator, ROC, MA100, MA200 indicate a SELL; STOCHRSI (14) is Overbought; while Average True Range (14) indicates High Volatility.
Support is at 1.5470 while Resistance is at 1.5509
10th Aug 2015 – 06:49hrs GMT
For more in depth Research & Analysis please visit FxGrow.
Note: This analysis is intended to provide general information and does not constitute the provision of INVESTMENT ADVICE. Investors should, before acting on this information, consider the appropriateness of this information having regard to their personal objectives, financial situation or needs. We recommend investors obtain investment advice specific to their situation before making any financial investment decision.
By FxGrow Research & Analysis Team
EURUSD
EURUSD was indecisive last week and opened the week lower at 1.0949 today. Now the pair is trading above its 20day moving average of 1.0931 in the European trading session. The near term bias remains Bullish with targets of 1.1010
RSI (14), MACD (12, 26), ADX (14), CCI (14), Ultimate Oscillator, ROC, MA100, MA200 indicate a BUY; STOCH (9, 6), STOCHRSI (14) is Overbought; while Average True Range (14) indicates High Volatility.
Support is at 1.0940 while Resistance is at 1.0982
10th Aug 2015 – 06:44hrs GMT
GBPUSD
GBPUSD was bearish last week as it touched a low of 1.5423 and opened this week higher at 1.5487 in the Asian trading session. Now the pair is trading below its 20day moving average of 1.5495 in the European trading session. The near term bias remains Neutral to Bearish with targets of 1.5410
RSI (14), STOCH (9, 6), CCI (14) are Neutral; MACD (12, 26), Ultimate Oscillator, ROC, MA100, MA200 indicate a SELL; STOCHRSI (14) is Overbought; while Average True Range (14) indicates High Volatility.
Support is at 1.5470 while Resistance is at 1.5509
10th Aug 2015 – 06:49hrs GMT
For more in depth Research & Analysis please visit FxGrow.
Note: This analysis is intended to provide general information and does not constitute the provision of INVESTMENT ADVICE. Investors should, before acting on this information, consider the appropriateness of this information having regard to their personal objectives, financial situation or needs. We recommend investors obtain investment advice specific to their situation before making any financial investment decision.