Daily Technical Analysis by FxGrow

FxGrow Daily Technical Analysis – 03rd Dec, 2015
By FxGrow Research & Analysis Team

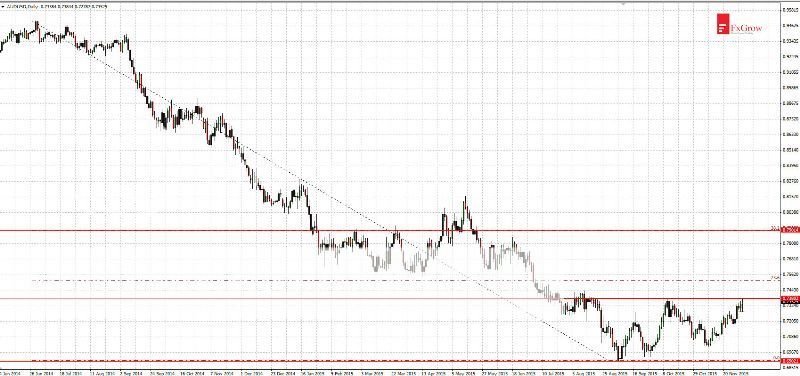
USDJPY - another attempt of breaking above consolidation upper limit

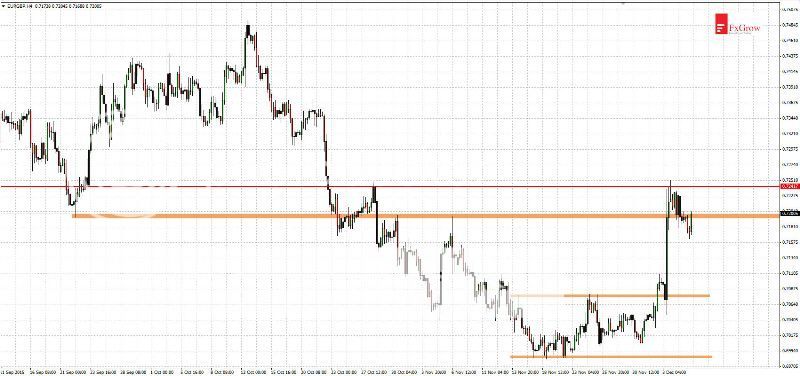
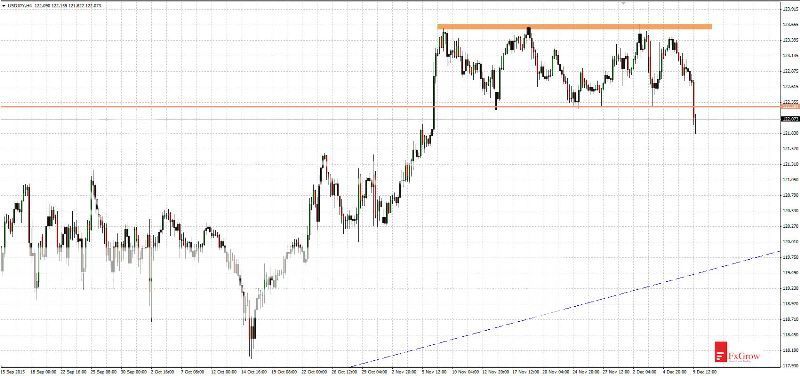
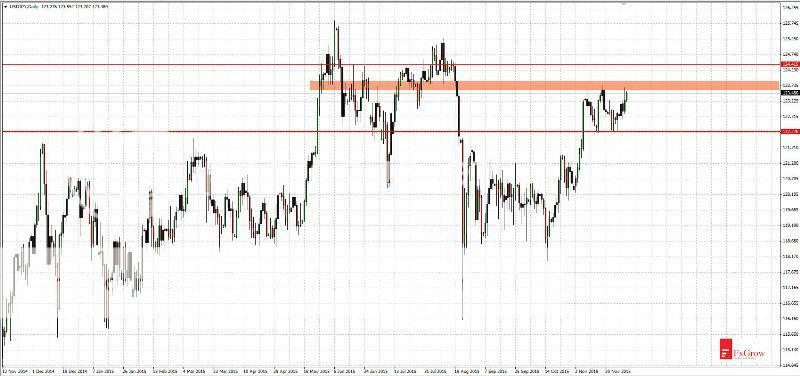
Since a month USDJPY moves in a consolidation between 122.20 - 123.60, yesterday we saw an unsuccessful attempt of breaking above consolidation upper limit. That breakout may occur today, after ECB meeting or tomorrow after Non-farm Payrolls. If upper limit of consolidation breaks, next resistances will be seen near: 124.40, 125.10. Alternatively if price moves down next supports will be at levels: 121.40, 120.30, 118.80.

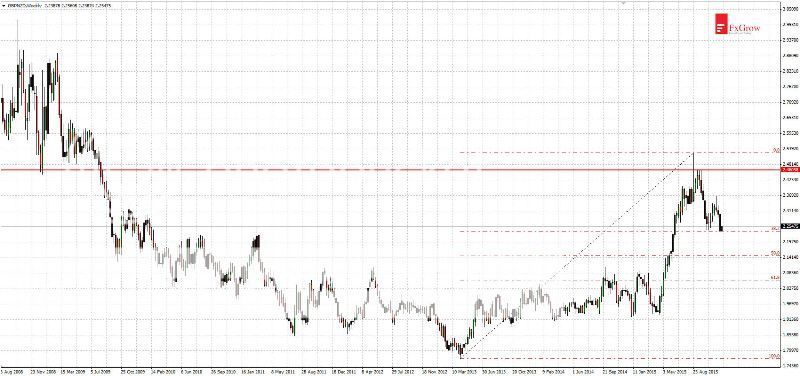
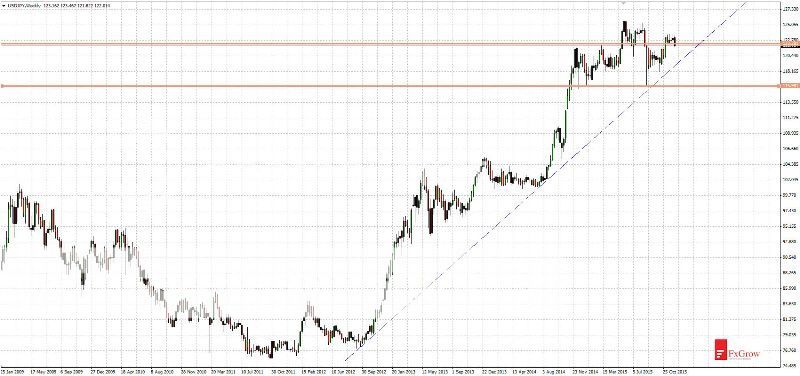
In a long term, since 2012 USDJPY moves in an uptrend. However since six months we did not see a new high. It is possible that the correction is coming to an end which is currently more likely than trend reversal. Breaking above year-to-date high (125.85) will signal that price returned to an uptrend.

2015-12-03_analiza_USDJPY-D1_zpsuzbw7huu.jpg


For more in depth Research & Analysis please visit FxGrowhttps://secure.fxgrow.com/b.php?cid...yb3cuY29tL3Byb21vX2RldGFpbHMucGhwP2Fkc19pZD02.

Note: This analysis is intended to provide general information and does not constitute the provision of INVESTMENT ADVICE. Investors should, before acting on this information, consider the appropriateness of this information having regard to their personal objectives, financial situation or needs. We recommend investors obtain investment advice specific to their situation before making any financial investment decision.
 
FxGrow Daily Technical Analysis – 03rd Dec, 2015
By FxGrow Research & Analysis Team

EURUSD - earth quake after ECB meeting

Today ECB meeting took place. Expectations about further easing monetary policy were huge and… have failed. Also in the previous analysis I have indicated the possibility of rebound, I wrote: "Currently EURUSD moves under low volatility and since 1,5 months there wasn't bigger rebound", "this all may indicate that it's time for an upward correction. Targets for the bulls are located at: 1.0640, 1.0690, 1.0760".
After the ECB decision and press conference by Mario Draghi, EURUSD made unpredictable upward move of 371 pips in 1,5 hours. Firstly support at 1.0520 was tested, and nextly price reached resistance at 1.0890 level which is strengthen by Fibonacci 38,2% of last downward movement. Tomorrow will be another important event - non-farm payrolls - and reaction to it could be also violent. If upward movement will be continued next resistances are located at: 1.1000, 1.1120. If price will return to declines next supports are at 1.0810, 1.0690.

2015-12-03_analiza_EURUSD-H4_zpsvin5qv4j.jpg


For more in depth Research & Analysis please visit FxGrowhttps://secure.fxgrow.com/b.php?cid...yb3cuY29tL3Byb21vX2RldGFpbHMucGhwP2Fkc19pZD02.

Note: This analysis is intended to provide general information and does not constitute the provision of INVESTMENT ADVICE. Investors should, before acting on this information, consider the appropriateness of this information having regard to their personal objectives, financial situation or needs. We recommend investors obtain investment advice specific to their situation before making any financial investment decision.
 
FxGrow Daily Technical Analysis – 04th Dec, 2015
By FxGrow Research & Analysis Team

EURAUD - dynamic upward movement, but this is only a correction

Since August 2015 EURAUD moves in downward trend. Yesterday price dynamically rebounded from support area 1.4350 and within a few hours made upward movement (620 pips). Awaken expectations after Thursday ECB meeting helped here a lot: central bank didn't extend QE program what was expected.

However market overreacted and that was caused not due to the lack of correction for a long time but due to the ECB. Current rebound has to be treated just like a correction before new wave of falls. Today price reached Fibonnaci 23,6% 1.4870 and resistance 1.4990. But rebound can reach higher, good level is Fibonacci 38,2% at 1.5200. Don't forget about today's very important data from US economy which may cause volatility on the market (similiar to the yesterday's one).

2015-12-04_analiza_EURAUD-H4_zpsngbufuzl.jpg


For more in depth Research & Analysis please visit FxGrowhttps://secure.fxgrow.com/b.php?cid...yb3cuY29tL3Byb21vX2RldGFpbHMucGhwP2Fkc19pZD02.

Note: This analysis is intended to provide general information and does not constitute the provision of INVESTMENT ADVICE. Investors should, before acting on this information, consider the appropriateness of this information having regard to their personal objectives, financial situation or needs. We recommend investors obtain investment advice specific to their situation before making any financial investment decision.
 
FxGrow Daily Technical Analysis – 04th Dec, 2015
By FxGrow Research & Analysis Team

AUDUSD - highest since August 2015

Today one of the most volatile currency was AUDUSD. Despite today's non-farm payrolls market behaved calmly. Reading was in line with forecasts and reaction wasn't too big. AUDUSD within 15 minutes reached to December's low and rebounded. An hour later price broke above December's high. In a long term there is downtrend so you may want to look into resistances. Rebound from one of them should bring new wave of falls.

Next resistances are at levels: 0.7380, 0.7600, 0.7800, 0.7900. Only break above 0.8000 will give a chance to trend reversal. Current rebound has a chance to reach Fibonacci 38.2% level (0.7000) which is supported by resistance. If one of that resistances cause rebound nearest target of falls are at 0.7020, 0.6900.

2015-12-04_analiza_AUDUSD-D1_zpsjfzlu27w.jpg


For more in depth Research & Analysis please visit FxGrowhttps://secure.fxgrow.com/b.php?cid...yb3cuY29tL3Byb21vX2RldGFpbHMucGhwP2Fkc19pZD02.

Note: This analysis is intended to provide general information and does not constitute the provision of INVESTMENT ADVICE. Investors should, before acting on this information, consider the appropriateness of this information having regard to their personal objectives, financial situation or needs. We recommend investors obtain investment advice specific to their situation before making any financial investment decision.
 
FxGrow Daily Technical Analysis – 07th Dec, 2015
By FxGrow Research & Analysis Team

GBPNZD - fibo 38.2% level stopped declines
Since August 24 at GBPNZD there is a correction. Currently price reached to fibo 38.2% level of full upward impuls. However it seems that this is not the end of declines. The current downward movement took the form of simple correction ABC. If there will be often seen equal where lengths A=C declines may occur to the level of 2.0800.

2015-12-07_analiza_GBPNZD-D1_zpsce9zxr4c.jpg


Wider view, time-frame W1
Since April 2014 GBPNZD moves in uptrend. The most dynamic movement took place between April and August 2015. Then the attempt of break resistance at 2.4600 level has failed, and rebound continues to this day. The current decline in the long term should only be correction, after that price may return to uptrend. The trend shows fact that last low was established in April 2013 and in next months the price reached new highs and new lows.

2015-12-07_analiza_GBPNZD-W1_zpssjakhd6o.jpg


For more in depth Research & Analysis please visit FxGrowhttps://secure.fxgrow.com/b.php?cid...yb3cuY29tL3Byb21vX2RldGFpbHMucGhwP2Fkc19pZD02.

Note: This analysis is intended to provide general information and does not constitute the provision of INVESTMENT ADVICE. Investors should, before acting on this information, consider the appropriateness of this information having regard to their personal objectives, financial situation or needs. We recommend investors obtain investment advice specific to their situation before making any financial investment decision.
 
FxGrow Daily Technical Analysis – 07th Dec, 2015
By FxGrow Research & Analysis Team

EURGBP - it's time for a second test of resistance at 0.7250

Last analysis from November 27 gave earn 120 pips. I wrote about consolidation and possible target of upward movement at 0.7200. In fact that movement reached 50 pips higher and rebounded. In long term EURGBP moves in a downward trend and current rebound could be seen as an opportunity for short.

For the trend reversal the price should break above resistance at 0.7480 level. If the declines will be continue next supports are located at levels: 0.7155, 0.7125, 0.7060. If there will be another attack at the resistance on area 0.7250 which is more likely and it failed it will give an interesting investment opportunity.

2015-12-07_analiza_EURGBP-H4_zpsksdskswt.jpg


For more in depth Research & Analysis please visit FxGrowhttps://secure.fxgrow.com/b.php?cid...yb3cuY29tL3Byb21vX2RldGFpbHMucGhwP2Fkc19pZD02.

Note: This analysis is intended to provide general information and does not constitute the provision of INVESTMENT ADVICE. Investors should, before acting on this information, consider the appropriateness of this information having regard to their personal objectives, financial situation or needs. We recommend investors obtain investment advice specific to their situation before making any financial investment decision.
 
FxGrow Daily Technical Analysis – 08th Dec, 2015
By FxGrow Research & Analysis Team

AUDCAD - 500 pips of upward movement without correction

Since November 11 AUDCAD moves in an uptrend rally. Price moved upward 500 pips without correction and 3 resistances were broken above. Soon there could be a correction and minimum declines should reach 38.2% fibo. It is possible that rebound will be higher than last week's high. Two important resistances are at levels: 0.9880, 0.9980. However if there will be a rebound nearest supports are at levels: 0.9730, 0.9590, 0.9420.

2015-12-08_analiza_AUDCAD-D1_zpsfcwy1jnb.jpg


Wider view, time-frame W1
AUDCAD looks very interesting at weekly time-frame. The behavior of price at current level will be important for a further direction of movement. In last week weekly candle broke above downtrend line extending from 2013. The end of current week will be really important. Any retracement may look like fake breakout and new high can give a big chances of trend change.

2015-12-08_analiza_AUDCAD-W1_zps70tw2o29.jpg


For more in depth Research & Analysis please visit FxGrowhttps://secure.fxgrow.com/b.php?cid...yb3cuY29tL3Byb21vX2RldGFpbHMucGhwP2Fkc19pZD02.

Note: This analysis is intended to provide general information and does not constitute the provision of INVESTMENT ADVICE. Investors should, before acting on this information, consider the appropriateness of this information having regard to their personal objectives, financial situation or needs. We recommend investors obtain investment advice specific to their situation before making any financial investment decision.
 
FxGrow Daily Technical Analysis – 08th Dec, 2015
By FxGrow Research & Analysis Team

CADJPY - on its way to support at 88.90

Today CADJPY broke below support at 90.70 level. Currently declines stopped at weak support at 90.10 and we should see a return movement attempts. If price will move back above 90.70 today's movement will be a false breakout and next targets for upward movement will be the levels 91.20, 91.80, 92.40. More likely scenario is rebound - if price could reach 90.70.

Since August 25 CADJPY moves in consolidation between 93.00, 88.90. Last time at November 19 price tested upper limit of consolidation so there is a huge probability that right now lower limit of consolidation 88.90 will be tested. Breaking one of the pointed levels will give us a confirmation of consolidation end.

2015-12-08_analiza_CADJPY-H4_zpsw6y3vmlr.jpg


For more in depth Research & Analysis please visit FxGrowhttps://secure.fxgrow.com/b.php?cid...yb3cuY29tL3Byb21vX2RldGFpbHMucGhwP2Fkc19pZD02.

Note: This analysis is intended to provide general information and does not constitute the provision of INVESTMENT ADVICE. Investors should, before acting on this information, consider the appropriateness of this information having regard to their personal objectives, financial situation or needs. We recommend investors obtain investment advice specific to their situation before making any financial investment decision.
 
FxGrow Daily Technical Analysis – 09th Dec, 2015
By FxGrow Research & Analysis Team

AUDJPY - correction in upward trend

In last week 90.40 level was tested and caused rebound. Yesterday price broke below support at 89.60 level (visible at daily time-frame) and currently price will test next support 88.00. On the way there is an uptrend line, however it is more likely that price will test 88.00 and rebound after it. If supply will be strong enough another strong support is at 86.20 level.

2015-12-09_analiza_AUDJPY-D1_zps7i1vd0zg.jpg

Wider view, time-frame D1
Since the beginning of September 2015 AUDJPY moves in an uptrend. Last week price with strong candle broke above 89.60 level. However current week began and continues as a correction. It is likely that 88.00 could be a good level for a rebound. AUDJPY is characterized by high volatility and until there are higher highs and higher lows at daily time-frame declines should be seen as a correction in an uptrend.

2015-12-09_analiza_AUDJPY-H4_zpsx64nnsch.jpg


For more in depth Research & Analysis please visit FxGrowhttps://secure.fxgrow.com/b.php?cid...yb3cuY29tL3Byb21vX2RldGFpbHMucGhwP2Fkc19pZD02.

Note: This analysis is intended to provide general information and does not constitute the provision of INVESTMENT ADVICE. Investors should, before acting on this information, consider the appropriateness of this information having regard to their personal objectives, financial situation or needs. We recommend investors obtain investment advice specific to their situation before making any financial investment decision.
 
FxGrow Daily Technical Analysis – 09th Dec, 2015
By FxGrow Research & Analysis Team

USDJPY - monthly support has been broken

Since last month USDJPY moves in a narrow consolidation between 122.30 - 123.60. Today demand gave up after 4 defenses of support at 122.30 level. Currently return movement to the broken support is very likely. The behavior of price in this area will determine the future direction of the movement. If price will go back to consolidation, movement to 123.60 level should be easy. However if supply will confirm today's breakout, nearest target of falls is 121.45 level. Further targets for the supply were pointed below on the higher time-frame.

2015-12-09_analiza_USDJPY-H4_zps1agcgpju.jpg


Wider view, time-frame W1
Since 2012 USDJPY moves in an uptrend. Trend is strong, what is confirmed by the fact that for more than a year uptrend line hasn't been tested (dotted line on the chart below). If declines will still continue, next strong supports are at levels: area 119.00 (trend line reinforced by support), 116.00 (strong support).

2015-12-09_analiza_USDJPY-W1_zpsoo2ldn1r.jpg


For more in depth Research & Analysis please visit FxGrowhttps://secure.fxgrow.com/b.php?cid...yb3cuY29tL3Byb21vX2RldGFpbHMucGhwP2Fkc19pZD02.

Note: This analysis is intended to provide general information and does not constitute the provision of INVESTMENT ADVICE. Investors should, before acting on this information, consider the appropriateness of this information having regard to their personal objectives, financial situation or needs. We recommend investors obtain investment advice specific to their situation before making any financial investment decision.
 
Back
Top