FxGrow Support
Recruit
- Messages
- 58
FxGrow Daily Technical Analysis – 10th Dec, 2015
By FxGrow Research & Analysis Team
NZDUSD - upward movement after RBNZ decision
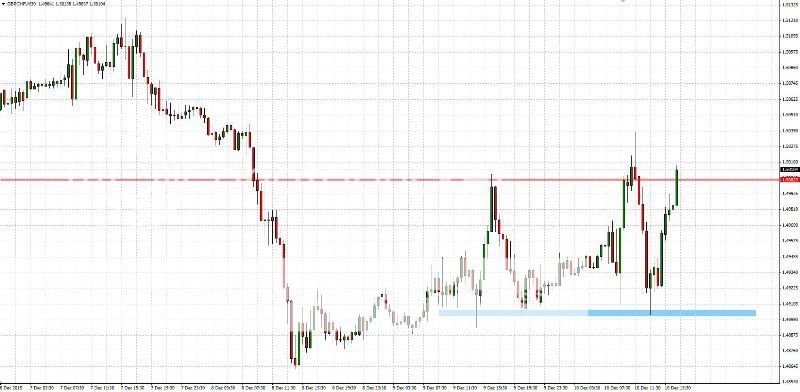
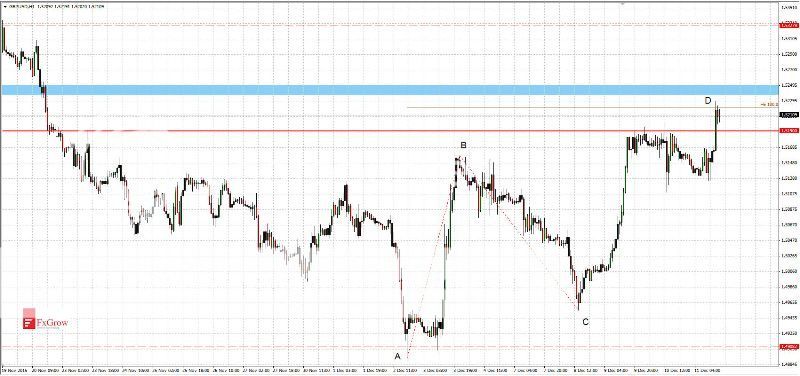
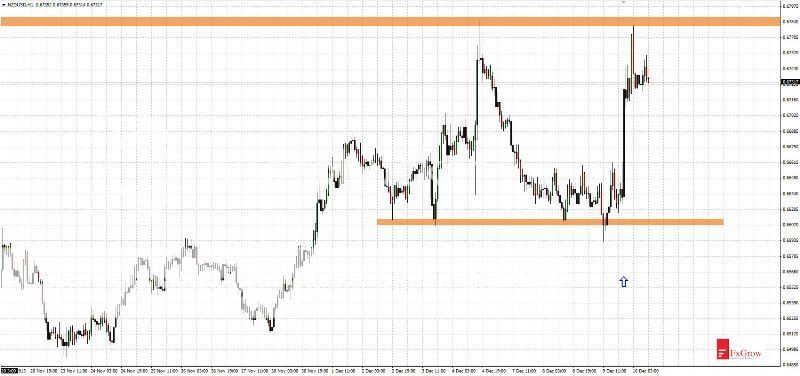
Yesterday Reserve Bank of New Zealand announced its interest rate decision. As forecasted, main rate was reduced. This caused volatility on the NZDUSD. First, price false broke below support at 0.6610 and second dynamic upward candle reached to 0.6780 level. Further attempt to break above indicated resistance and upward movement to 0.6850 is very likely.
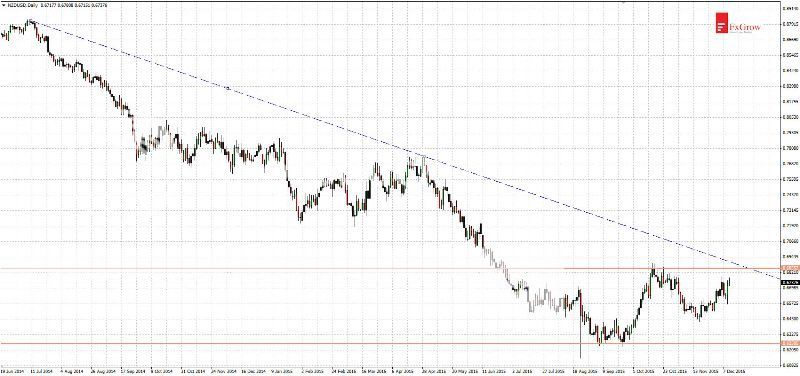
Wider view, time-frame D1
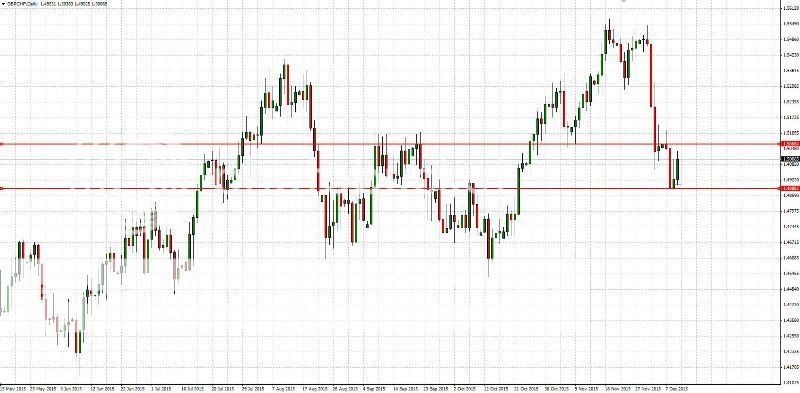
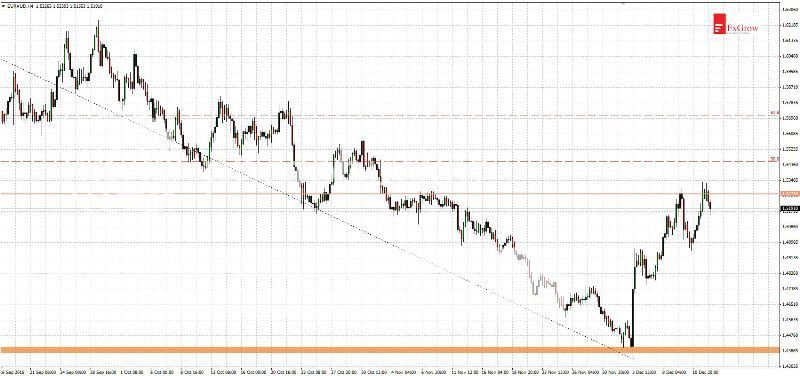
Since 5 months NZDUSD moves in consolidation between 0.6260 - 0.6850. Last time lower limit of the consolidation was tested in September 2015. Currently price approaches range upper limit. However price still stays below downtrend line and that suggests return to declines in the future. Right now break above 0.6900 will change sentiment and gives a hope to trend reversal.
For more in depth Research & Analysis please visit FxGrowhttps://secure.fxgrow.com/b.php?cid...yb3cuY29tL3Byb21vX2RldGFpbHMucGhwP2Fkc19pZD02.
Note: This analysis is intended to provide general information and does not constitute the provision of INVESTMENT ADVICE. Investors should, before acting on this information, consider the appropriateness of this information having regard to their personal objectives, financial situation or needs. We recommend investors obtain investment advice specific to their situation before making any financial investment decision.
By FxGrow Research & Analysis Team
NZDUSD - upward movement after RBNZ decision
Yesterday Reserve Bank of New Zealand announced its interest rate decision. As forecasted, main rate was reduced. This caused volatility on the NZDUSD. First, price false broke below support at 0.6610 and second dynamic upward candle reached to 0.6780 level. Further attempt to break above indicated resistance and upward movement to 0.6850 is very likely.
Wider view, time-frame D1
Since 5 months NZDUSD moves in consolidation between 0.6260 - 0.6850. Last time lower limit of the consolidation was tested in September 2015. Currently price approaches range upper limit. However price still stays below downtrend line and that suggests return to declines in the future. Right now break above 0.6900 will change sentiment and gives a hope to trend reversal.
For more in depth Research & Analysis please visit FxGrowhttps://secure.fxgrow.com/b.php?cid...yb3cuY29tL3Byb21vX2RldGFpbHMucGhwP2Fkc19pZD02.
Note: This analysis is intended to provide general information and does not constitute the provision of INVESTMENT ADVICE. Investors should, before acting on this information, consider the appropriateness of this information having regard to their personal objectives, financial situation or needs. We recommend investors obtain investment advice specific to their situation before making any financial investment decision.