Daily Technical Analysis by FxGrow

FxGrow Daily Technical Analysis – 11th July, 2016
By FxGrow Research & Analysis Team

EURUSD
EURUSD_zpssmkban9k.png


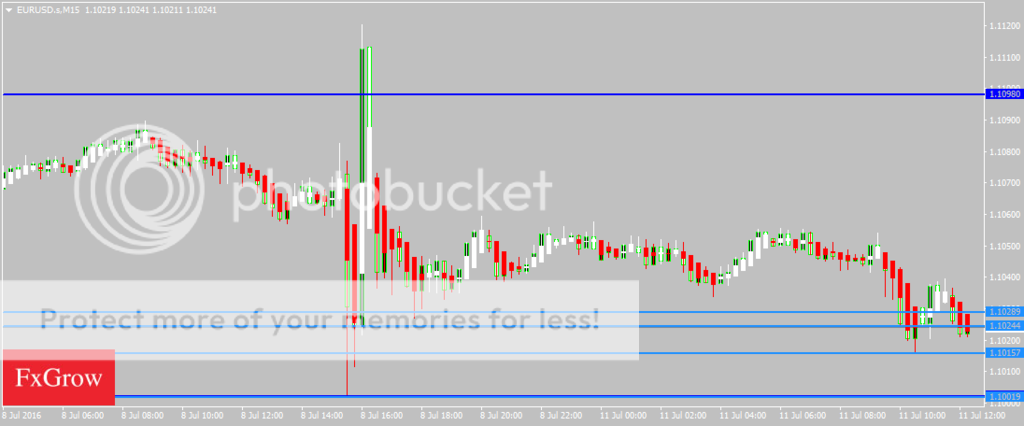
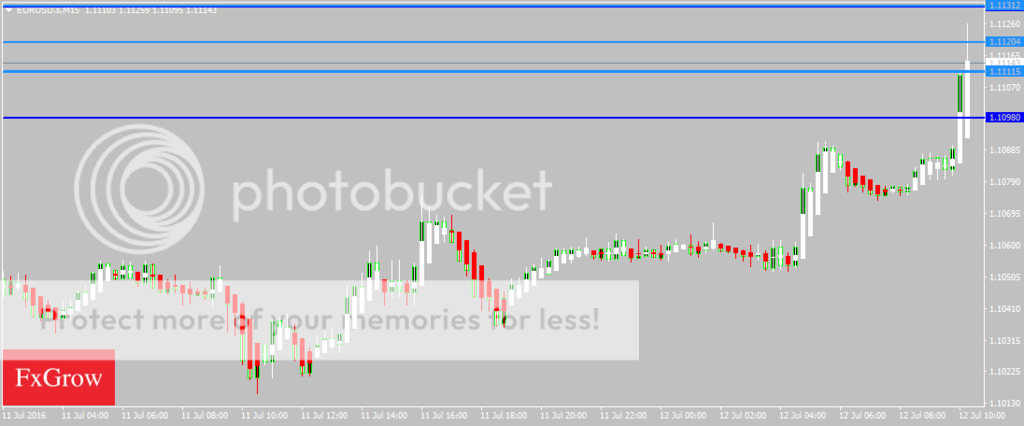
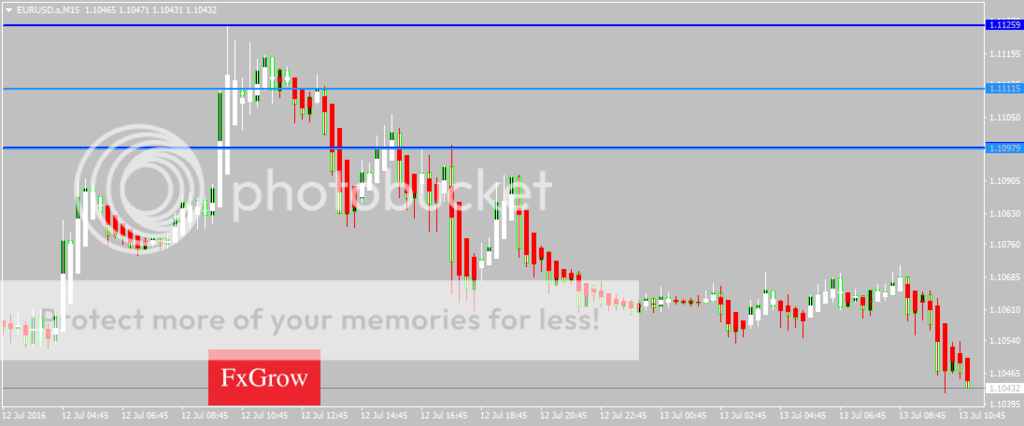
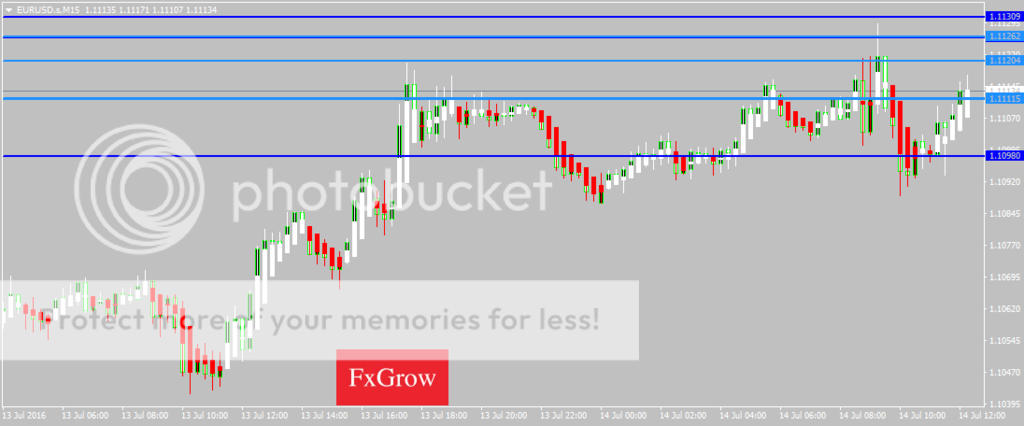
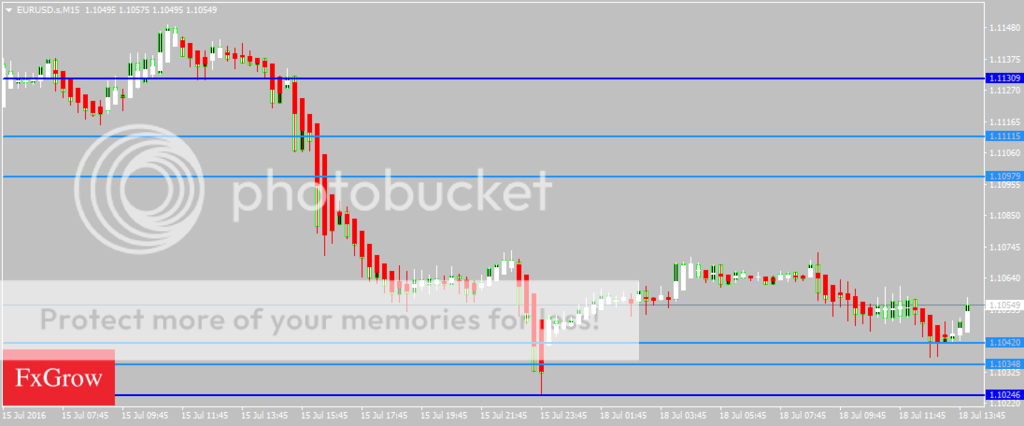
EURUSD has opened the week lower and is trading below the 1.1050 handle and a bearish trend is expected later today. The pair is trading below its 100 day SMA of 1.1073 and a downtrend is expected towards the 1.1000 levels. The near term bias is Neutral to Bearish with targets of 1.0950

RSI (14), MACD (12, 26), ADX (14), Ultimate Oscillator, ROC indicate a SELL; STOCH (9, 6) is Neutral; STOCHRSI (14), CCI (14) are Oversold; while Average True Range (14) indicates Less Volatility.

Support is at 1.1002 while Resistance is at 1.1034 and 1.1097

11th July 2016 – 09:32hrs GMT

GBPUSD
GBPUSD_zpsdzbmq3xb.png


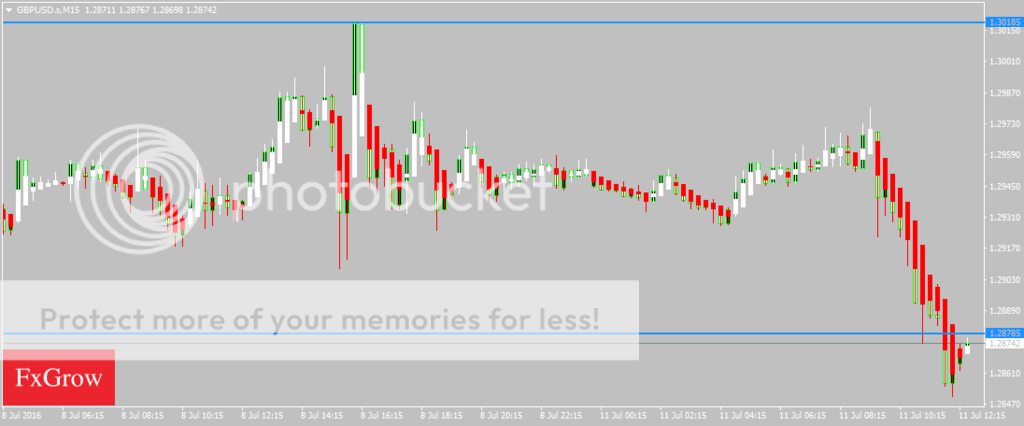
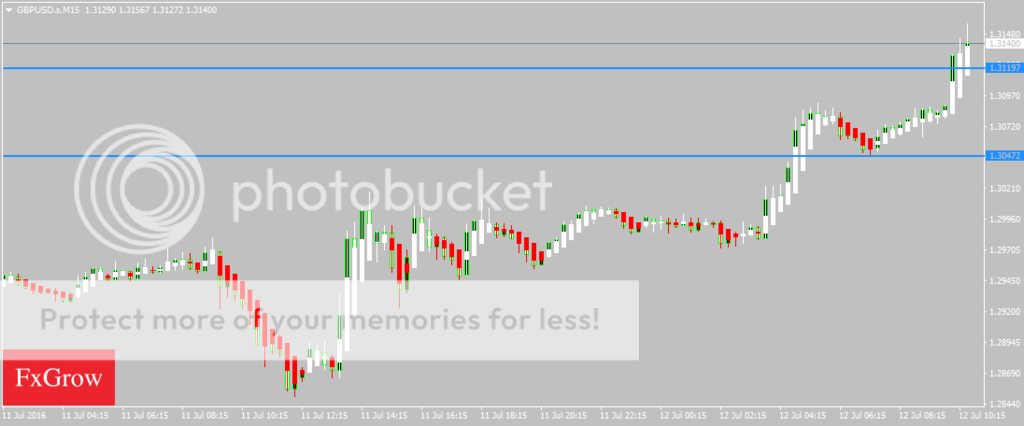
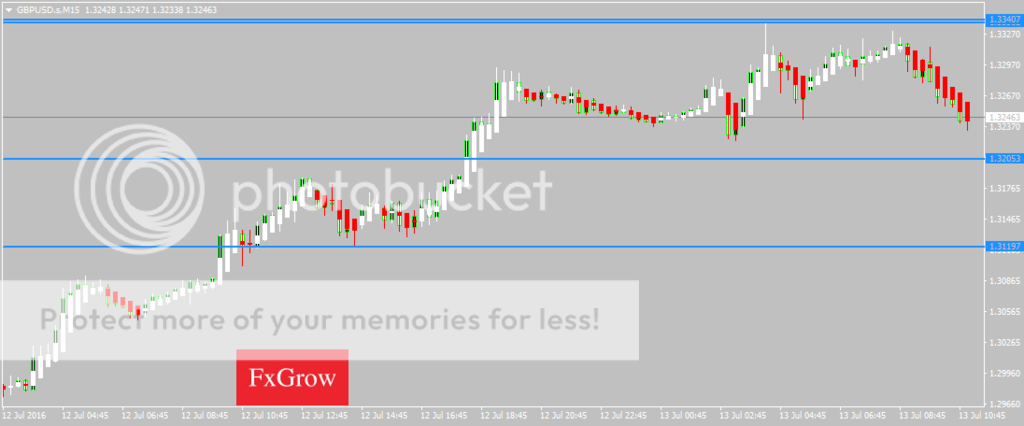
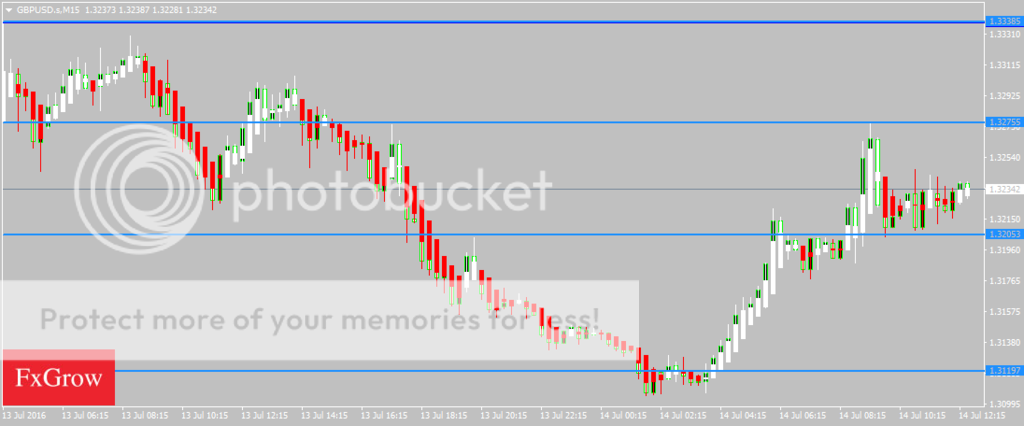
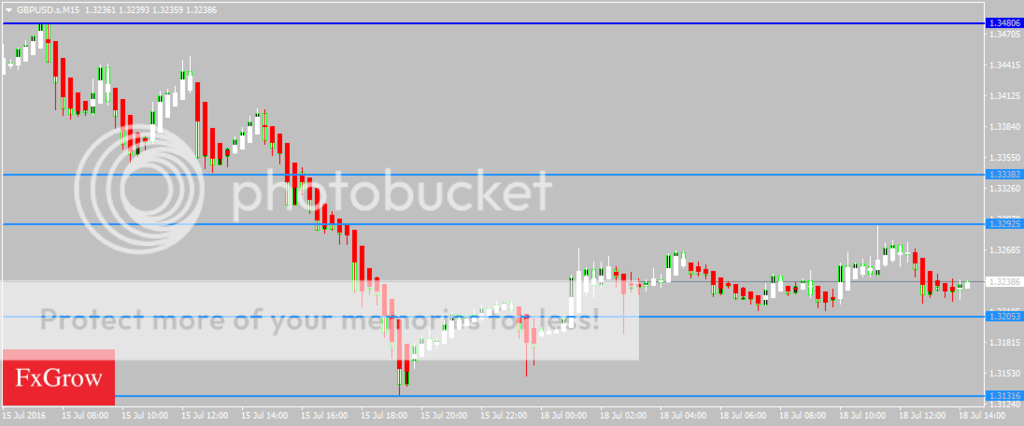
GBPUSD has opened the week lower and is trading below the 1.2900 handle with further weakness towards the 1.2700 levels. Today Cable is trading below its 100 day SMA of 1.2964 and strong bearish correction is expected later today. The near term bias is Bearish with targets of 1.2800

RSI (14), STOCHRSI (14), MACD (12, 26), ADX (14), Ultimate Oscillator, ROC indicate a SELL; STOCH (9, 6) is Neutral; CCI (14) is Oversold; while Average True Range (14) indicates Less Volatility.

Support is at 1.2824 while Resistance is at 1.2920 and 1.2936

11th July 2016 – 09:40hrs GMT

For more in depth Research & Analysis please visit FxGrow.http://fxgrow.com/

Note: This analysis is intended to provide general information and does not constitute the provision of INVESTMENT ADVICE. Investors should, before acting on this information, consider the appropriateness of this information having regard to their personal objectives, financial situation or needs. We recommend investors obtain investment advice specific to their situation before making any financial investment decision.
 
FxGrow Daily Technical Analysis – 11th July, 2016
By FxGrow Research & Analysis Team

AUDUSD
AUDUSD_zpsrbefueob.png


AUDUSD opened this week with an uptrend crossing the 0.7550 levels in the Asian trading session. The pair is looking to break the 0.7600 handle in US trading session today. Today Aussie is trading above its 100 day SMA of 0.7502 and the near term bias is Bullish with targets of 0.7550 to 0.7600

MACD (12, 26), MA100 indicate a BUY; RSI (14) is Neutral; STOCHRSI (14) is Oversold; while Average True Range (14) indicates Less Volatility.

Support is at 0.7491 while Resistance is at 0.7575

11th July 2016 – 09:48hrs GMT

USDJPY
USDJPY_zpsiwrw4umx.png


USDJPY has opened the week on a strong bullish tone as it crossed the 102 handle in the European trading session. The pair is trading above its 100day SMA of 101.02 and a move towards 103 is expected. The near term bias is Bullish with targets of 102.50 to 103

STOCH (9, 6), MACD (12, 26), ADX (14), CCI (14), ROC indicate a BUY; RSI (14), STOCHRSI (14) is Overbought; while Average True Range (14) indicates Less Volatility.

Support is at 101.46 while Resistance is at 102.42

11th July 2016 – 10:10hrs GMT

For more in depth Research & Analysis please visit FxGrow.http://fxgrow.com/

Note: This analysis is intended to provide general information and does not constitute the provision of INVESTMENT ADVICE. Investors should, before acting on this information, consider the appropriateness of this information having regard to their personal objectives, financial situation or needs. We recommend investors obtain investment advice specific to their situation before making any financial investment decision.
 
FxGrow Daily Technical Analysis – 12th July, 2016
By FxGrow Research & Analysis Team

EURUSD
EURUSD_zpszysliup8.png


EURUSD was indecisive yesterday as it touched a low of 1.1015 and a high of 1.1069 towards the end of the trading session. The pair is trading above its 100 day SMA of 1.1066 and an upward momentum is seen in the European trading session. The near term bias is Strong Bullish with targets of 1.1150 to 1.1200

RSI (14), STOCH (9, 6), MACD (12, 26), ADX (14), ROC indicate a BUY; STOCHRSI (14), CCI (14), Ultimate Oscillator are Overbought; while Average True Range (14) indicates Less Volatility.

Support is at 1.1098 while Resistance is at 1.1120 and 1.1131

12th July 2016 – 07:42hrs GMT

GBPUSD
GBPUSD_zpsmgk9qxam.png


GBPUSD made bullish correction yesterday as it crossed 1.3000 handle towards the end of the trading session. Today Cable is trading above its 100 day SMA of 1.2959 and strong bullish momentum is seen in the European trading session. The near term bias is Bullish with targets of 1.3150 to 1.3200

RSI (14), STOCH (9, 6), MACD (12, 26), ADX (14), CCI (14), Ultimate Oscillator, ROC indicate a BUY; STOCHRSI (14) is Overbought; while Average True Range (14) indicates Less Volatility.

Support is at 1.3055 while Resistance is at 1.3107 and 1.3124

12th July 2016 – 08:00hrs GMT

For more in depth Research & Analysis please visit FxGrow.http://fxgrow.com/

Note: This analysis is intended to provide general information and does not constitute the provision of INVESTMENT ADVICE. Investors should, before acting on this information, consider the appropriateness of this information having regard to their personal objectives, financial situation or needs. We recommend investors obtain investment advice specific to their situation before making any financial investment decision.
 
FxGrow Daily Technical Analysis – 12th July, 2016
By FxGrow Research & Analysis Team

AUDUSD
AUDUSD_zpsbnmfhbcn.png


AUDUSD was flat yesterday without any major changes towards the end of the trading session. Today Aussie is trading above its 100 day SMA of 0.7524 and the near term bias is Bullish with targets of 0.7650 to 0.7680

STOCH (9, 6), MACD (12, 26), ADX (14), CCI (14), ROC indicate a BUY; RSI (14), STOCHRSI (14) are Overbought; while Average True Range (14) indicates High Volatility.
Support is at 0.7585 while Resistance is at 0.7665

12th July 2016 – 08:10hrs GMT

USDJPY
USDJPY_zps8ewxipxr.png


USDJPY was bullish yesterday as it crossed the 102.50 handle yesterday and remained strong towards the end of the trading session. The pair is trading above its 100day SMA of 101.32 with some fluctuation seen in the European trading session. The near term bias is Bullish with targets of 103.50 to 104

RSI (14), STOCH (9, 6), MACD (12, 26), ROC indicate a BUY; ADX (14), CCI (14) are Neutral; while Average True Range (14) indicates High Volatility.

Support is at 102.84 while Resistance is at 103.55

12th July 2016 – 08:20hrs GMT

For more in depth Research & Analysis please visit FxGrow.http://fxgrow.com/

Note: This analysis is intended to provide general information and does not constitute the provision of INVESTMENT ADVICE. Investors should, before acting on this information, consider the appropriateness of this information having regard to their personal objectives, financial situation or needs. We recommend investors obtain investment advice specific to their situation before making any financial investment decision.
 
FxGrow Daily Technical Analysis – 13th July, 2016
By FxGrow Research & Analysis Team

EURUSD
EURUSD_zpsmaszhlgr.png


EURUSD was bullish yesterday as it touched a high of 1.1125 but could not sustain bullish momentum and came down to close below 1.1060 towards the end of the trading session. The pair is trading below its 100 day SMA of 1.1065 as it tests its support of 1.1000 later today. The near term bias is Bearish with targets of 1.1000

RSI (14), MACD (12, 26), ADX (14), Ultimate Oscillator, ROC indicate a SELL; STOCHRSI (14), CCI (14) are Oversold; while Average True Range (14) indicates Less Volatility.

Support is at 1.1049 while Resistance is at 1.1064 and 1.1075

13th July 2016 – 08:10hrs GMT

GBPUSD
GBPUSD_zpsteyqbdv4.png


GBPUSD was bullish yesterday as it crossed 1.3250 handle towards the end of the trading session. Today Cable tried to cross the 1.3300 levels but had a bearish pullback and is trading above its 100 day SMA of 1.3036 in the European trading session. The near term bias is Neutral with sideways moves expected

RSI (14), STOCH (9, 6), Ultimate Oscillator are Neutral; STOCHRSI (14) is Oversold; while Average True Range (14) indicates Less Volatility.

Support is at 1.3119 while Resistance is at 1.3275 and 1.3340

13th July 2016 – 08:20hrs GMT

For more in depth Research & Analysis please visit FxGrow.http://fxgrow.com/

Note: This analysis is intended to provide general information and does not constitute the provision of INVESTMENT ADVICE. Investors should, before acting on this information, consider the appropriateness of this information having regard to their personal objectives, financial situation or needs. We recommend investors obtain investment advice specific to their situation before making any financial investment decision.
 
FxGrow Daily Technical Analysis – 13th July, 2016
By FxGrow Research & Analysis Team

AUDUSD
AUDUSD_zpsyombelyf.png


AUDUSD had a bullish momentum yesterday as it crossed 0.7650 handle and remained strong towards the end of the trading session. Today Aussie is trading above its 100 day SMA of 0.7554 and the near term bias is Bearish with targets of 0.7550

RSI (14), STOCH (9, 6), ADX (14), CCI (14), ROC indicate a SELL; STOCHRSI (14) is Oversold; while Average True Range (14) indicates Less Volatility.

Support is at 0.7548 while Resistance is at 0.7646 and 0.7658

13th July 2016 – 08:25hrs GMT

USDJPY
USDJPY_zps4q7dr2mr.png


USDJPY had a strong bullish move yesterday as it crossed the 104.50 handle yesterday and remained strong towards the end of the trading session. The pair is trading above its 100day SMA of 102.16 and some bearish correction is expected later today. The near term bias is Bearish with targets of 104 to 103.50

STOCH (9, 6), ADX (14), CCI (14), ROC indicate a SELL; STOCHRSI (14) is Oversold; while Average True Range (14) indicates Less Volatility.

Support is at 103.54 while Resistance is at 104.83 and 104.98

13th July 2016 – 08:32hrs GMT

For more in depth Research & Analysis please visit FxGrow.http://fxgrow.com/

Note: This analysis is intended to provide general information and does not constitute the provision of INVESTMENT ADVICE. Investors should, before acting on this information, consider the appropriateness of this information having regard to their personal objectives, financial situation or needs. We recommend investors obtain investment advice specific to their situation before making any financial investment decision.
 
FxGrow Daily Technical Analysis – 14th July, 2016
By FxGrow Research & Analysis Team

EURUSD
EURUSD_zpsjbardyqd.png


EURUSD was bullish yesterday as it crossed 1.1100 handle and since then it has entered into a phase of consolidation. The pair is trading above its 100 day SMA of 1.1071 and the short term bias remains on the upside. The near term bias is Bullish with targets of 1.1150

RSI (14), STOCHRSI (14), MACD (12, 26), ADX (14), CCI (14), ROC indicate a BUY; STOCH (9, 6) is Neutral; while Average True Range (14) indicates Less Volatility.

Support is at 1.1098 while Resistance is at 1.1120 and 1.1130

14th July 2016 – 09:40hrs GMT

GBPUSD
GBPUSD_zpsqktowbmq.png


GBPUSD had a bearish momentum yesterday as it could not sustain its bullish moves above 1.3300 and pulled back below 1.3150 levels towards the end of the trading session. Today Cable is trading in a Bullish tone as it crossed 1.3200 handle and is trading above its 100day SMA of 1.3097 in the European trading session. The near term bias is Bullish with targets of 1.3350

RSI (14), STOCH (9, 6), MACD (12, 26), ADX (14), CCI (14), ROC indicate a BUY; STOCHRSI (14) is Overbought; while Average True Range (14) indicates Less Volatility.

Support is at 1.3192 while Resistance is at 1.3258 and 1.3273

14th July 2016 – 09:50hrs GMT

For more in depth Research & Analysis please visit FxGrow.http://fxgrow.com/

Note: This analysis is intended to provide general information and does not constitute the provision of INVESTMENT ADVICE. Investors should, before acting on this information, consider the appropriateness of this information having regard to their personal objectives, financial situation or needs. We recommend investors obtain investment advice specific to their situation before making any financial investment decision.
 
FxGrow Daily Technical Analysis – 14th July, 2016
By FxGrow Research & Analysis Team

AUDUSD
AUDUSD_zpsbgkl4wsg.png


AUDUSD was indecisive yesterday as it touched a low of 0.7576 and a high of 0.7636 towards the end of the trading session. Today Aussie is trading above its 100 day SMA of 0.7584 and the near term bias is Bullish with targets of 0.7700

RSI (14), STOCH (9, 6), MACD (12, 26), ADX (14), CCI (14), ROC indicate a BUY; STOCHRSI (14) is Overbought; while Average True Range (14) indicates Less Volatility.

Support is at 0.7593 while Resistance is at 0.7642 and 0.7647

14th July 2016 – 09:55hrs GMT

USDJPY
USDJPY_zpsisgq1cjj.png


USDJPY was indecisive yesterday and traded in a zigzag pattern towards the end of the trading session. Today the pair is moving in a strong bullish momentum and managed to cross 105.80 levels. The pair is trading above its 100day SMA of 103.12 and some pullback is expected later today. The near term bias is Bullish with targets of 106 to 106.50

STOCH (9, 6), MACD (12, 26), ADX (14), CCI (14), ROC indicate a BUY; STOCHRSI (14) is Overbought; while Average True Range (14) indicates High Volatility.

Support is at 105.24 while Resistance is at 105.86 and 106.02

14th July 2016 – 10:00hrs GMT

For more in depth Research & Analysis please visit FxGrow.http://fxgrow.com/

Note: This analysis is intended to provide general information and does not constitute the provision of INVESTMENT ADVICE. Investors should, before acting on this information, consider the appropriateness of this information having regard to their personal objectives, financial situation or needs. We recommend investors obtain investment advice specific to their situation before making any financial investment decision.
 
FxGrow Daily Technical Analysis – 15th July, 2016
By FxGrow Research & Analysis Team

The EURUSD gained ahead of US CPI data

The EURUSD traded higher staying above 1.1100 area on speculations of a drawdown in the core rate of inflation. The EURUSD advanced and gained traction on expectations that weak US economic data will affect Fed hiking rate decision negatively and therefore raises Fed scope to delay interest rate hike for December, and breaking 1.1170 will pave the way through 1.1200 zone to touch 1.1218 and 1.1260.

To read this Full in depth Analysis please visit FxGrowhttp://www.fxgrow.com/analysis-educ...cal-analysis-fxgrow-free-forex-analysis-tools.

Note: This analysis is intended to provide general information and does not constitute the provision of INVESTMENT ADVICE. Investors should, before acting on this information, consider the appropriateness of this information having regard to their personal objectives, financial situation or needs. We recommend investors obtain investment advice specific to their situation before making any financial investment decision.
 
FxGrow Daily Technical Analysis – 18th July, 2016
By FxGrow Research & Analysis Team

EURUSD
EURUSD_zpslzftrfmm.png


EURUSD could not sustain its bullish moves last week and has opened this week lower trading below the 1.1100 handle in the European trading session. The pair is trading below its 100 day SMA of 1.1089 and the short term bearish formations are in place. The near term bias is Bearish with targets of 1.1000

RSI (14), STOCH (9, 6), MACD (12, 26), Ultimate Oscillator, MA100 indicate a SELL; CCI (14) is Neutral; STOCHRSI (14) is Overbought; while Average True Range (14) indicates Less Volatility.

Support is at 1.1034 while Resistance is at 1.1111 and 1.1130

18th July 2016 – 11:15hrs GMT

GBPUSD
GBPUSD_zpscmtjsscl.png


GBPUSD could not sustain its bullish moves last week and closed below the 1.3200 handle. The pair is trading in a Neutral state since it opened today and the long term bearish correction will continue. Cable is trading below its 100day SMA of 1.3259 in the European trading session. The near term bias is Neutral to Bearish with targets of 1.3150

RSI (14), CCI (14) is Neutral; STOCH (9, 6), STOCHRSI (14), MACD (12, 26), Ultimate Oscillator indicate a SELL; while Average True Range (14) indicates Less Volatility.

Support is at 1.3131 while Resistance is at 1.3338 and 1.3480

18th July 2016 – 11:25hrs GMT

For more in depth Research & Analysis please visit FxGrow.http://fxgrow.com/analysis-educatio...alysis-fxgrow-free-forex-analysis-tools#close

Note: This analysis is intended to provide general information and does not constitute the provision of INVESTMENT ADVICE. Investors should, before acting on this information, consider the appropriateness of this information having regard to their personal objectives, financial situation or needs. We recommend investors obtain investment advice specific to their situation before making any financial investment decision.
 
Back
Top