Daily Technical Analysis by FxGrow

FxGrow Daily Technical Analysis – 18th July, 2016
By FxGrow Research & Analysis Team

AUDUSD
AUDUSD_zpszw7fd8bo.png


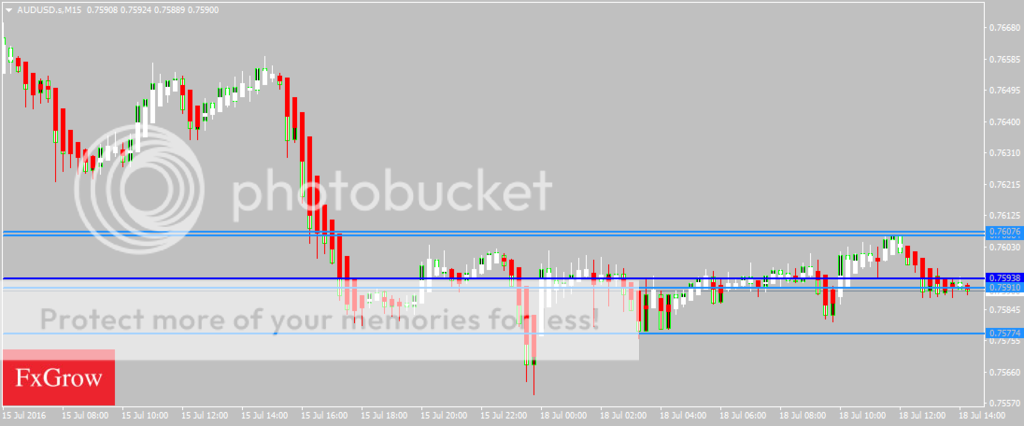
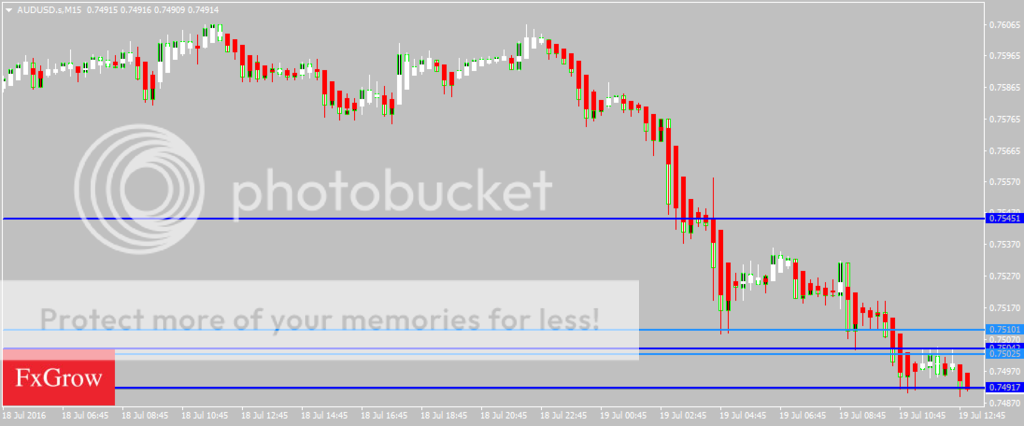
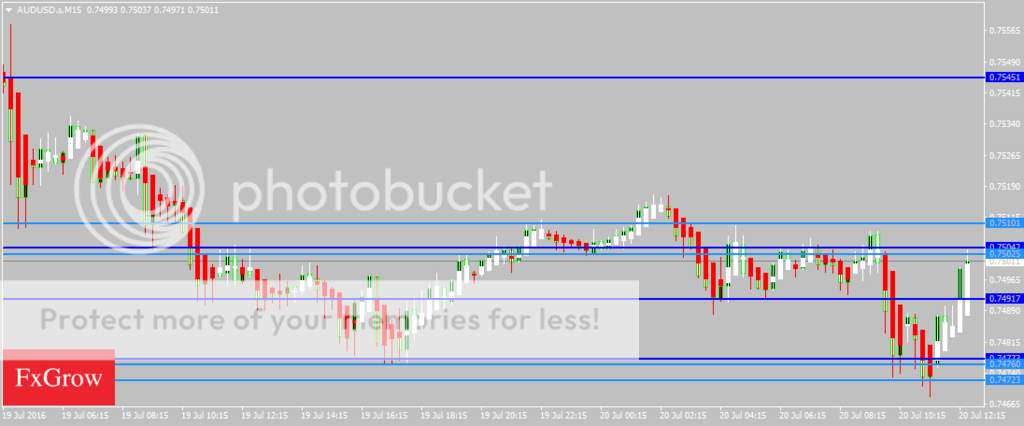
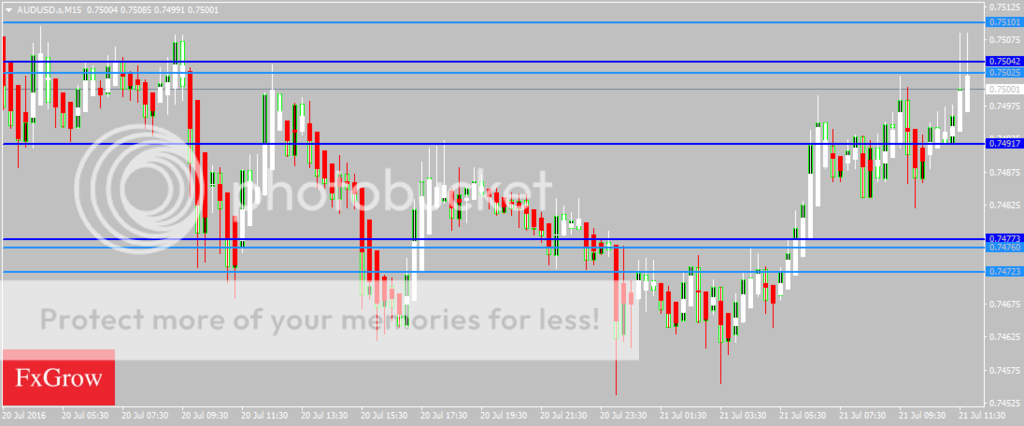
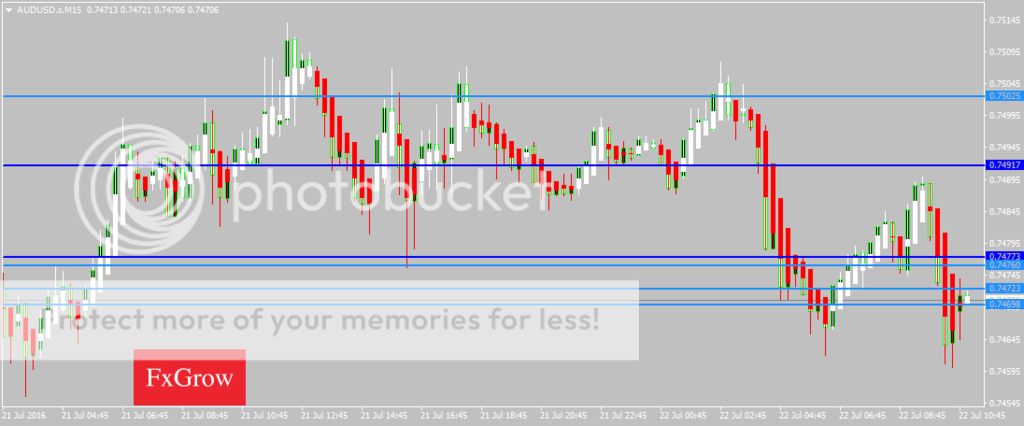
AUDUSD was bullish last week and closed below the 0.7600 handle. The AUDUSD has opened lower and is trading in a Neutral state in the European trading session. Aussie is trading below its 100 day SMA of 0.7618 and the near term bias is Neutral to Bearish with targets of 0.7530

RSI (14), STOCHRSI (14), MACD (12, 26), ADX (14), ROC, MA100 indicate a SELL; CCI (14) is Neutral; while Average True Range (14) indicates Less Volatility.

Support is at 0.7577 while Resistance is at 0.7600 and 0.7607

18th July 2016 – 11:35hrs GMT

USDJPY
USDJPY_zpsvuxxdnst.png


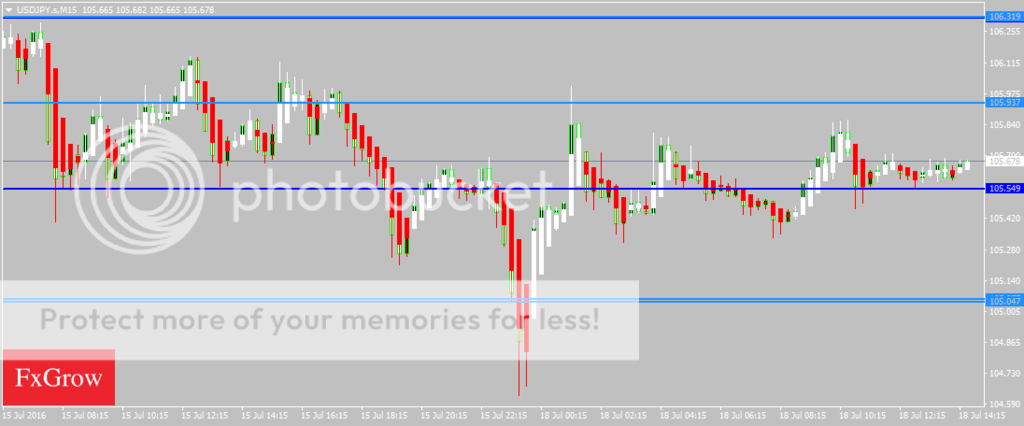
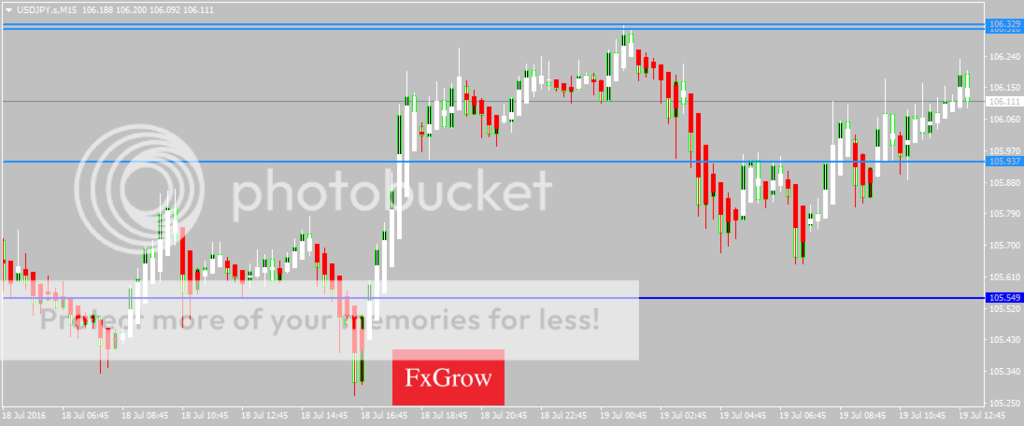
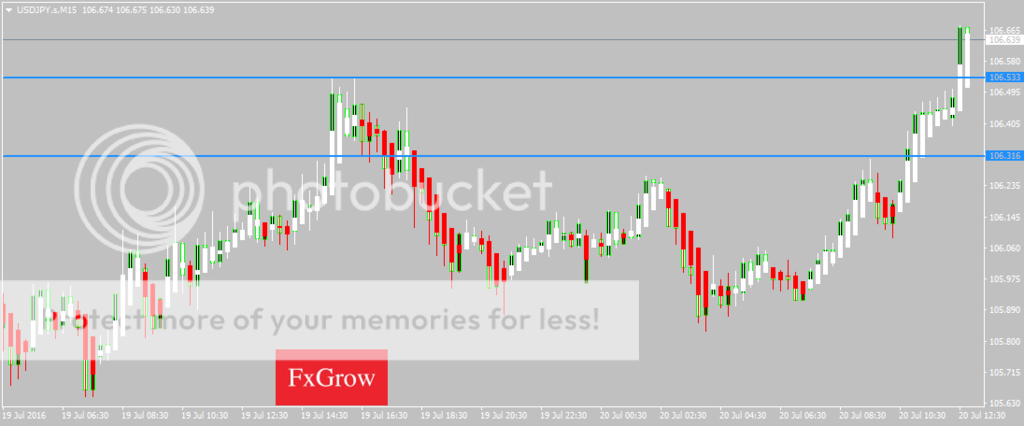
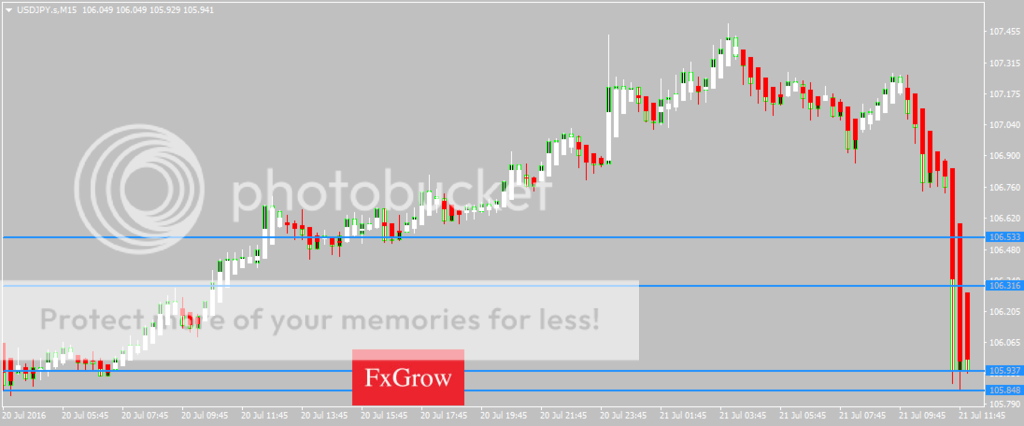
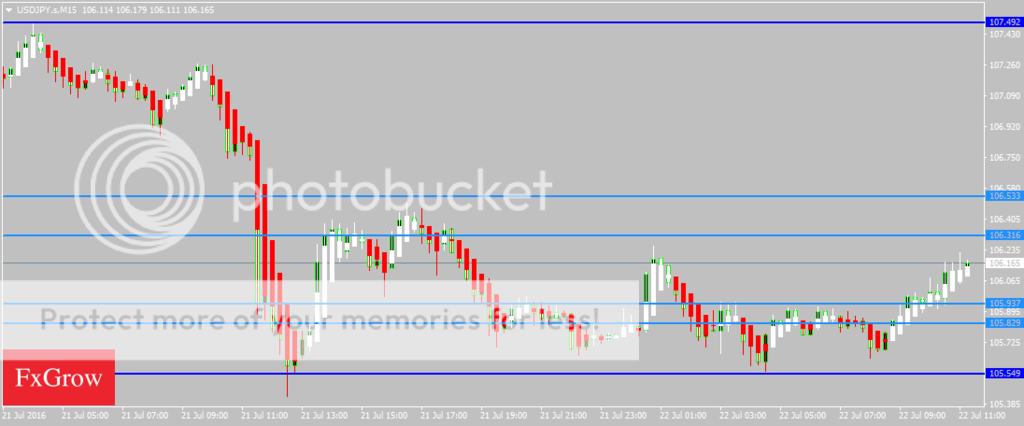
USDJPY was bullish last week and opened this week lower below the 105 handle. The USDJPY has recovered its early morning weakness and is now trading above its 100day SMA of 105.06 in the European trading session. The near term bias is Neutral to Bullish with targets of 106

RSI (14), STOCH (9, 6) are Neutral; , MACD (12, 26), ADX (14), CCI (14), ROC indicate a BUY; STOCHRSI (14) is Overbought; while Average True Range (14) indicates Less Volatility.

Support is at 105.04 while Resistance is at 105.93 and 106.31

18th July 2016 – 11:45hrs GMT

For more in depth Research & Analysis please visit FxGrow.http://fxgrow.com/analysis-educatio...alysis-fxgrow-free-forex-analysis-tools#close

Note: This analysis is intended to provide general information and does not constitute the provision of INVESTMENT ADVICE. Investors should, before acting on this information, consider the appropriateness of this information having regard to their personal objectives, financial situation or needs. We recommend investors obtain investment advice specific to their situation before making any financial investment decision.
 
FxGrow Daily Technical Analysis – 19th July, 2016
By FxGrow Research & Analysis Team

EURUSD
EURUSD_zpsyfwplql0.png


EURUSD was indecisive yesterday as it touched a low of 1.1024 and a high of 1.1081 towards the end of the trading session. The pair is trading below its 100 day SMA of 1.1088 and the overall outlook remains bearish. The near term bias is Neutral to Bearish with targets of 1.1000 to 1.0950

MACD (12, 26), ADX (14), Ultimate Oscillator, ROC indicate a SELL; RSI (14), STOCHRSI (14) are Neutral; while Average True Range (14) indicates Less Volatility.

Support is at 1.1042 while Resistance is at 1.1084 and 1.1099

19th July 2016 – 09:35AM ( UTC)

GBPUSD
GBPUSD_zpsv67urfqo.png


GBPUSD was indecisive yesterday as it touched a low of 1.3192 and a high of 1.3307 towards the end of the trading session. Cable was unable to break above the 1.3400 levels and came down below its 100day SMA of 1.3259 in the European trading session. The near term bias is Bearish with targets of 1.3100

RSI (14), STOCH (9, 6), MACD (12, 26), ADX (14), CCI (14), Ultimate Oscillator indicate a SELL; STOCHRSI (14) is Oversold; while Average True Range (14) indicates Less Volatility.

Support is at 1.3171 while Resistance is at 1.3264 and 1.3314

19th July 2016 – 10:00AM (UTC)

For more in depth Research & Analysis please visit FxGrow.http://fxgrow.com/analysis-educatio...alysis-fxgrow-free-forex-analysis-tools#close

Note: This analysis is intended to provide general information and does not constitute the provision of INVESTMENT ADVICE. Investors should, before acting on this information, consider the appropriateness of this information having regard to their personal objectives, financial situation or needs. We recommend investors obtain investment advice specific to their situation before making any financial investment decision.
 
FxGrow Daily Technical Analysis – 19th July, 2016
By FxGrow Research & Analysis Team

AUDUSD
AUDUSD_zpsh2wtrv18.png


AUDUSD was bullish yesterday as it crossed the 0.7600 handle and remained firm towards the end of the trading session. The AUDUSD started to decline in the early Asian trading session today and is now trading below its 100 day SMA of 0.7602 in the European trading session. The near term bias is Neutral to Bearish with targets of 0.7450

RSI (14), MACD (12, 26), ADX (14), CCI (14), Ultimate Oscillator, ROC indicate a SELL; STOCH (9, 6), STOCHRSI (14) is Oversold; while Average True Range (14) indicates High Volatility.

Support is at 0.7472 while Resistance is at 0.7511 and 0.7545

19th July 2016 – 10:10AM (UTC)

USDJPY
USDJPY_zpsrzwpupzi.png


USDJPY was bullish yesterday as it crossed the 106 handle and remained strong towards the end of the trading session. The USDJPY maintains its bullish momentum and is looking to cross 107.50 over the week. It is trading above its 100day SMA of 105.42 in the European trading session. The near term bias is Neutral to Bullish with targets of 107

STOCHRSI (14) is Neutral; RSI (14), STOCH (9, 6), MACD (12, 26), ADX (14), CCI (14) indicate a BUY; while Average True Range (14) indicates High Volatility.

Support is at 105.54 while Resistance is at 106.32 and 106.47

19th July 2016 – 10:17AM (UTC)

Note: This analysis is intended to provide general information and does not constitute the provision of INVESTMENT ADVICE. Investors should, before acting on this information, consider the appropriateness of this information having regard to their personal objectives, financial situation or needs. We recommend investors obtain investment advice specific to their situation before making any financial investment decision.
 
FxGrow Daily Technical Analysis – 20th July, 2016
By FxGrow Research & Analysis Team

EURUSD
EURUSD_zpsypyka3ii.png


EURUSD was bearish yesterday as it came down below the 1.1050 handle and remained weak towards the end of the trading session. The pair is trading below its 100 day SMA of 1.1070 and some pullback correction is expected but the overall outlook remains bearish. The near term bias is Neutral to Bullish with targets of 1.1060

STOCH (9, 6), Ultimate Oscillator indicate a BUY; ADX (14), CCI (14) are Neutral; STOCHRSI (14) is Overbought; while Average True Range (14) indicates High Volatility.

Support is at 1.0981 while Resistance is at 1.1015 and 1.1024

20th July 2016 – 09:42AM (UTC)

GBPUSD
GBPUSD_zpslun9ivl7.png


GBPUSD was bearish yesterday as it broke below 1.3150 handle and remained weak towards the end of the trading session. Cable has made bullish correction today and is trading above 1.3170 now though the long term view remains bearish towards 1.3000 levels. GBPUSD is trading below its 100day SMA of 1.3238 in the European trading session. The near term bias is Neutral to Bullish with targets of 1.3200 to 1.3250

RSI (14), ADX (14), Ultimate Oscillator, ROC indicate a BUY; STOCHRSI (14), CCI (14) are Overbought; STOCH (9, 6) is Neutral; while Average True Range (14) indicates Less Volatility.

Support is at 1.3046 while Resistance is at 1.3218 and 1.3270

20th July 2016 – 09:40AM (UTC)

For more in depth Research & Analysis please visit FxGrow.http://fxgrow.com/analysis-educatio...alysis-fxgrow-free-forex-analysis-tools#close

Note: This analysis is intended to provide general information and does not constitute the provision of INVESTMENT ADVICE. Investors should, before acting on this information, consider the appropriateness of this information having regard to their personal objectives, financial situation or needs. We recommend investors obtain investment advice specific to their situation before making any financial investment decision.
 
FxGrow Daily Technical Analysis – 20th July, 2016
By FxGrow Research & Analysis Team

AUDUSD
AUDUSD_zpsanlceqhz.png


AUDUSD was bearish yesterday as it came down below 0.7500 handle and remained weak towards the end of the trading session. The AUDUSD is trading in a Neutral state today with sideways moves expected in the US trading session. The near term bias is Neutral with consolidation in the range of 0.7470 to 0.7530

RSI (14), STOCH (9, 6), CCI (14) are Neutral; STOCHRSI (14) is Overbought; while Average True Range (14) indicates High Volatility.

Support is at 0.7477 while Resistance is at 0.7510 and 0.7545

20th July 2016 – 09:46AM (UTC)

USDJPY
USDJPY_zpsu3lcjhlj.png


USDJPY was bullish yesterday as it crossed the 106.50 handle and some pullback was seen towards the end of the trading session. The USDJPY maintains its bullish momentum and is trading above its 100day SMA of 105.82 in the European trading session. The near term bias is Neutral to Bullish with targets of 107.25

RSI (14), MACD (12, 26), ADX (14), Ultimate Oscillator, ROC indicate a BUY; STOCH (9, 6) is Neutral; STOCHRSI (14), CCI (14) are Overbought; while Average True Range (14) indicates Less Volatility.

Support is at 106.17 while Resistance is at 106.51 and 106.68

20th July 2016 – 09:53AM (UTC)

For more in depth Research & Analysis please visit FxGrow.http://fxgrow.com/analysis-educatio...alysis-fxgrow-free-forex-analysis-tools#close

Note: This analysis is intended to provide general information and does not constitute the provision of INVESTMENT ADVICE. Investors should, before acting on this information, consider the appropriateness of this information having regard to their personal objectives, financial situation or needs. We recommend investors obtain investment advice specific to their situation before making any financial investment decision.
 
FxGrow Daily Technical Analysis – 21st July, 2016
By FxGrow Research & Analysis Team

EURUSD
EURUSD_zpsofc7ne5e.png


EURUSD was mild bullish yesterday and today it is continuing in the same uptrend. A bullish breakout above 1.1100 is expected in the US trading session. EURUSD is trading just below its 100 day SMA of 1.1047 and the near term bias is Neutral to Bullish with targets of 1.1080 to 1.1100

STOCH (9, 6), MACD (12, 26), ADX (14), CCI (14), Ultimate Oscillator, ROC indicate a BUY; RSI (14) is Neutral; while Average True Range (14) indicates Less Volatility.

Support is at 1.1009 while Resistance is at 1.1041 and 1.1057

21st July 2016 – 08:42AM (UTC)

GBPUSD
GBPUSD_zpso0syqxt3.png


GBPUSD was bullish yesterday and today it continues its bullish trend crossing 1.3250 today. Now the pair has started to decline and inverted head and shoulders pattern is seen. A short term Bullish correction above 1.3400 is expected before the weekly closing. GBPUSD is trading below its 100day SMA of 1.3209 in the European trading session. The near term bias is Neutral to Bullish with targets of 1.3250 to 1.3300

STOCH (9, 6), MACD (12, 26), ADX (14), ROC indicate a BUY; RSI (14) is Neutral; while Average True Range (14) indicates High Volatility.

Support is at 1.3119 while Resistance is at 1.3274 and 1.3283

21st July 2016 – 08:55AM (UTC)

For more in depth Research & Analysis please visit FxGrow.http://fxgrow.com/analysis-educatio...alysis-fxgrow-free-forex-analysis-tools#close

Note: This analysis is intended to provide general information and does not constitute the provision of INVESTMENT ADVICE. Investors should, before acting on this information, consider the appropriateness of this information having regard to their personal objectives, financial situation or needs. We recommend investors obtain investment advice specific to their situation before making any financial investment decision.
 
FxGrow Daily Technical Analysis – 21st July, 2016
By FxGrow Research & Analysis Team

AUDUSD
AUDUSD_zps0ardijwj.png


AUDUSD was indecisive yesterday as it touched a high of 0.7516 and a low of 0.7462 towards the end of the trading session. The AUDUSD has started to move in an uptrend today crossing 0.7480 levels in the European trading session. The pair is trading below its 100 day SMA of 0.7540 and bullish correction is expected in the US trading session. The near term bias is Bullish with targets of 0.7550

RSI (14), STOCH (9, 6), MACD (12, 26), ADX (14), CCI (14), Ultimate Oscillator, ROC indicate a BUY; STOCHRSI (14) is Overbought; while Average True Range (14) indicates High Volatility.

Support is at 0.7472 while Resistance is at 0.75040 and 0.7515

21st July 2016 – 09:00AM (UTC)

USDJPY
USDJPY_zps0evika3t.png


USDJPY was bullish yesterday as it crossed the 107 handle and today it managed to touch a high of 107.48 after which it has started to decline and is now trading at 106 levels. The USDJPY has now come into a Neutral state with some consolidation seen in the US trading session. The near term bias is Neutral with consolidation towards 106.50

STOCH (9, 6), MACD (12, 26) is Neutral; STOCHRSI (14), CCI (14) are Oversold; while Average True Range (14) indicates High Volatility.

Support is at 105.84 while Resistance is at 106.67 and 107.29

21st July 2016 – 09:08AM (UTC)


For more in depth Research & Analysis please visit FxGrow.http://fxgrow.com/analysis-educatio...alysis-fxgrow-free-forex-analysis-tools#close

Note: This analysis is intended to provide general information and does not constitute the provision of INVESTMENT ADVICE. Investors should, before acting on this information, consider the appropriateness of this information having regard to their personal objectives, financial situation or needs. We recommend investors obtain investment advice specific to their situation before making any financial investment decision.
 
FxGrow Daily Technical Analysis – 22nd July, 2016
By FxGrow Research & Analysis Team

EURUSD
EURUSD_zpsj0njn7q0.png


EURUSD was indecisive yesterday as it touched a high of 1.1057 and a low of 1.0979 towards the end of the trading session. EURUSD is trading just below its 100 day SMA of 1.1032 and short term upwards correction is expected in the US trading session. The near term bias is Neutral to Bullish with targets of 1.1050 to 1.1070

RSI (14), STOCH (9, 6), CCI (14), are Neutral; MACD (12, 26), ADX (14), ROC indicate a BUY; while Average True Range (14) indicates Less Volatility.

Support is at 1.0979 while Resistance is at 1.1031 and 1.1045

22nd July 2016 – 07:35AM (UTC)

GBPUSD
GBPUSD_zpszfpzzdps.png


GBPUSD was indecisive yesterday as it touched a high of 1.3267 and a low of 1.3163 and is today trading in a bullish overtone above 1.3240 levels. Intraday Bullish correction is possible with the pair testing 1.3300 in the US trading session. GBPUSD is trading above its 100day SMA of 1.3196 in the European trading session. The near term bias is Neutral to Bullish with targets of 1.3300

RSI (14), MACD (12, 26), ADX (14), CCI (14), Ultimate Oscillator, ROC indicate a BUY; STOCHRSI (14) is Overbought; while Average True Range (14) indicates Less Volatility.

Support is at 1.3205 while Resistance is at 1.3274 and 1.3286

22nd July 2016 – 08:01AM (UTC)

For more in depth Research & Analysis please visit FxGrow.http://fxgrow.com/analysis-educatio...alysis-fxgrow-free-forex-analysis-tools#close

Note: This analysis is intended to provide general information and does not constitute the provision of INVESTMENT ADVICE. Investors should, before acting on this information, consider the appropriateness of this information having regard to their personal objectives, financial situation or needs. We recommend investors obtain investment advice specific to their situation before making any financial investment decision.
 
FxGrow Daily Technical Analysis – 22nd July, 2016
By FxGrow Research & Analysis Team

AUDUSD
AUDUSD_zpsmlcbf5ka.png


AUDUSD was mild bullish yesterday as it touched a high of 0.7510 and tried to consolidate in the range of 0.7480 to 0.7500 towards the end of the trading session. The AUDUSD is slightly bearish today and is trading below 0.7480 levels. The pair is trading below its 100 day SMA of 0.7511 in the European trading session. The near term bias is Bearish with targets of 0.7450 to 0.7425

RSI (14), STOCH (9, 6), MACD (12, 26), CCI (14), Ultimate Oscillator, ROC indicate a SELL; STOCHRSI (14) is Oversold; ADX (14) is Neutral; while Average True Range (14) indicates Less Volatility.

Support is at 0.7469 while Resistance is at 0.7491 and 0.7502

22nd July 2016 – 08:20AM (UTC)

USDJPY
USDJPY_zpsyywrkcve.png


USDJPY was bearish yesterday as it dropped below 105 to touch an intraday low of 105.41 and tried to consolidate towards 106 at the end of the trading session. The USDJPY has now come into a Neutral state with some bullish correction expected in the US trading session. The near term bias is Neutral to Bullish with targets of 106.50

STOCH (9, 6), CCI (14), Ultimate Oscillator, ROC indicate a BUY; RSI (14), ADX (14) are Neutral; STOCHRSI (14) is Overbought; while Average True Range (14) indicates Less Volatility.

Support is at 105.54 while Resistance is at 106.53 and 107.49

22nd July 2016 – 08:28AM (UTC)

For more in depth Research & Analysis please visit FxGrow.http://fxgrow.com/analysis-educatio...alysis-fxgrow-free-forex-analysis-tools#close

Note: This analysis is intended to provide general information and does not constitute the provision of INVESTMENT ADVICE. Investors should, before acting on this information, consider the appropriateness of this information having regard to their personal objectives, financial situation or needs. We recommend investors obtain investment advice specific to their situation before making any financial investment decision.
 
FxGrow Daily Technical Analysis – 25th July, 2016
By FxGrow Research & Analysis Team

EURUSD
EURUSD_zpsfxl3twvr.png


EURUSD closed last week below 1.0950 handle and today it opened lower and is now trading in a consolidation phase towards the 1.1000 levels. EURUSD is trading below its 100 day SMA of 1.1009 and downside moves are expected in the US trading session. The near term bias is Neutral to Bearish with targets of 1.0950 to 1.0910

RSI (14) is Neutral; MACD (12, 26), MA100 indicate a SELL; STOCHRSI (14) is Overbought; while Average True Range (14) indicates Less Volatility.

Support is at 1.0967 while Resistance is at 1.1002 and 1.1015

25th July 2016 – 10:50AM (UTC)

GBPUSD
GBPUSD_zpspre31wzd.png


GBPUSD closed last week below 1.3100 handle and today it is trading in a zigzag pattern as bearish pressure continues to dominate the currency in the near term. Cable is trading in a neutral zone now with some bearish correction expected in the US trading session. GBPUSD is trading below its 100day SMA of 1.3162 in the European trading session. The near term bias is Neutral to Bearish with targets of 1.3050

STOCHRSI (14), MACD (12, 26), Ultimate Oscillator, MA100 indicate a SELL; RSI (14), STOCH (9, 6) is Neutral; while Average True Range (14) indicates Less Volatility.

Support is at 1.3119 while Resistance is at 1.3164 and 1.3205

25th July 2016 – 10:58AM (UTC)

For more in depth Research & Analysis please visit FxGrow.http://fxgrow.com/analysis-educatio...alysis-fxgrow-free-forex-analysis-tools#close

Note: This analysis is intended to provide general information and does not constitute the provision of INVESTMENT ADVICE. Investors should, before acting on this information, consider the appropriateness of this information having regard to their personal objectives, financial situation or needs. We recommend investors obtain investment advice specific to their situation before making any financial investment decision.
 
Back
Top