FxGrow Support
Recruit
- Messages
- 58
FxGrow Fundamental Analysis – 30th March, 2017
By FxGrow Investment Research Desk
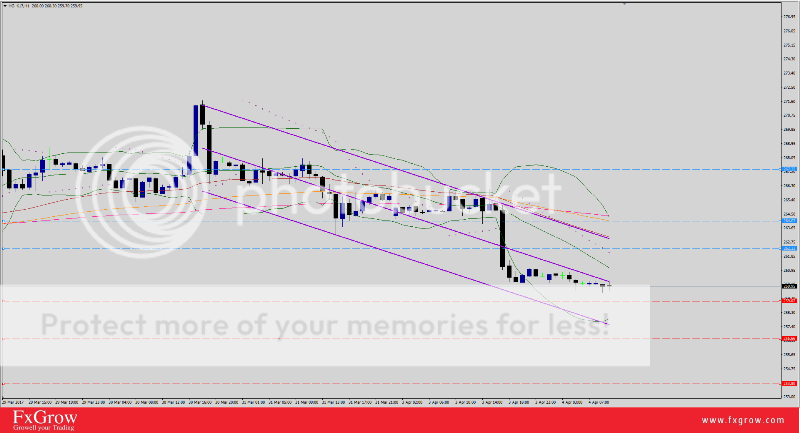
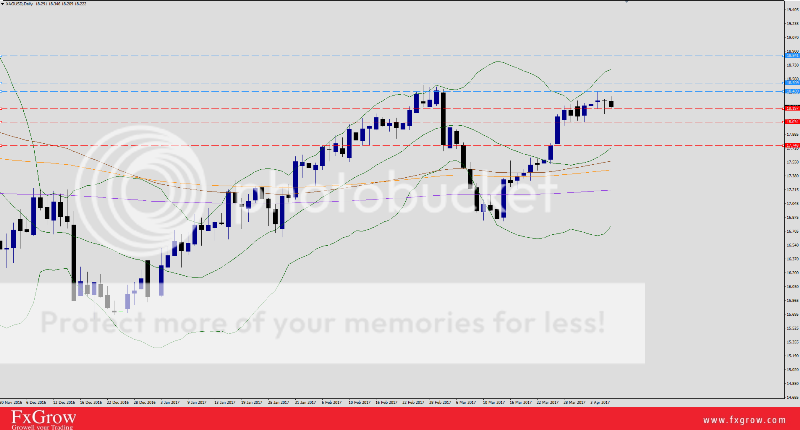
Copper Technical Overview
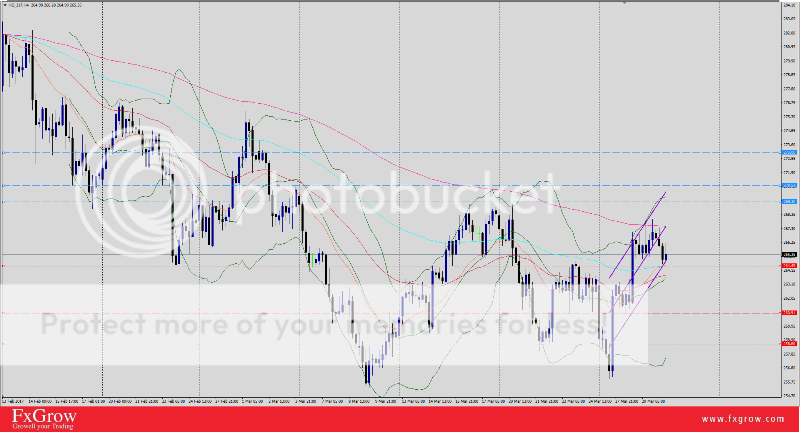
Trend : Sideways Up
Daily Pp : 266.6
Resistance levels : R1 : 269.30 , R2 270.51 , R3 273
Support levels: S1 264.45 , S2 260.90 , S3 258.60
Comment: The rebounds this week are triggering short term reversal, signaling for rallies to 273. Trade is poised to extend rallies today. Any corrective dips that show a sideways day will provide a staging level for rallies. The trend reversal point is 260.91, and a close below is needed to reverse back to negative trade.
For more in depth Research & Analysis please visit FxGrow.http://fxgrow.com/analysis-educatio...cal-analysis-fxgrow-free-forex-analysis-tools
Note: This analysis is intended to provide general information and does not constitute the provision of INVESTMENT ADVICE. Investors should, before acting on this information, consider the appropriateness of this information having regard to their personal objectives, financial situation or needs. We recommend investors obtain investment advice specific to their situation before making any financial investment decision.
By FxGrow Investment Research Desk
Copper Technical Overview
Trend : Sideways Up
Daily Pp : 266.6
Resistance levels : R1 : 269.30 , R2 270.51 , R3 273
Support levels: S1 264.45 , S2 260.90 , S3 258.60
Comment: The rebounds this week are triggering short term reversal, signaling for rallies to 273. Trade is poised to extend rallies today. Any corrective dips that show a sideways day will provide a staging level for rallies. The trend reversal point is 260.91, and a close below is needed to reverse back to negative trade.
For more in depth Research & Analysis please visit FxGrow.http://fxgrow.com/analysis-educatio...cal-analysis-fxgrow-free-forex-analysis-tools
Note: This analysis is intended to provide general information and does not constitute the provision of INVESTMENT ADVICE. Investors should, before acting on this information, consider the appropriateness of this information having regard to their personal objectives, financial situation or needs. We recommend investors obtain investment advice specific to their situation before making any financial investment decision.