fxoday
Recruit
- Messages
- 884
Hello everyone, I hope today is always better than the previous day.
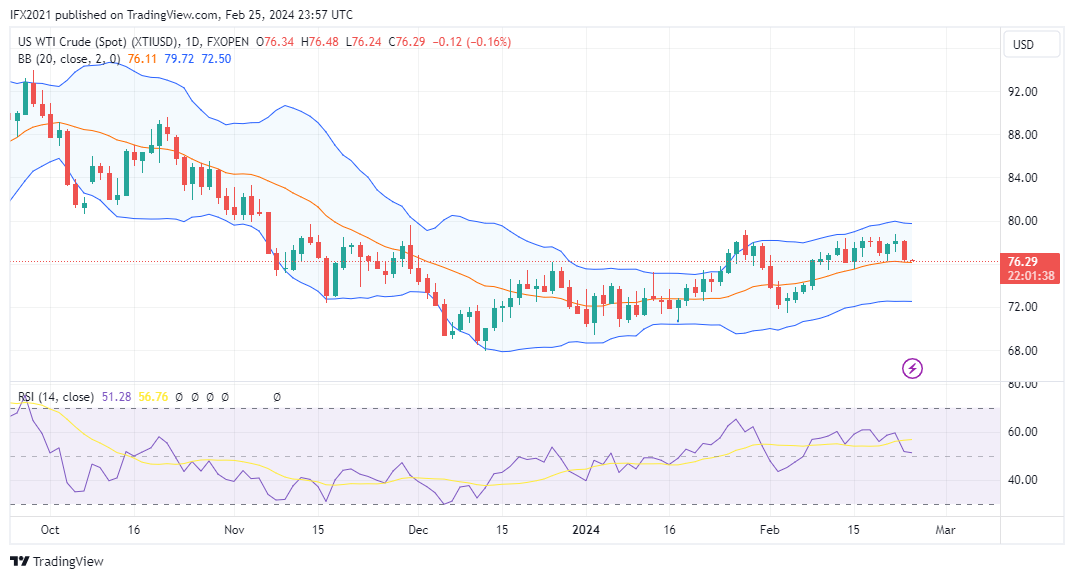
Looking at today's market changes, oil prices for US crude are still moving within the daily price range of 76.79 levels
Citing to Oilprice, Crude oil prices moved slightly higher, after the Energy Information Administration reported an inventory increase of 3.5 million barrels for the week to February 16.
XTIUSD technical analysis
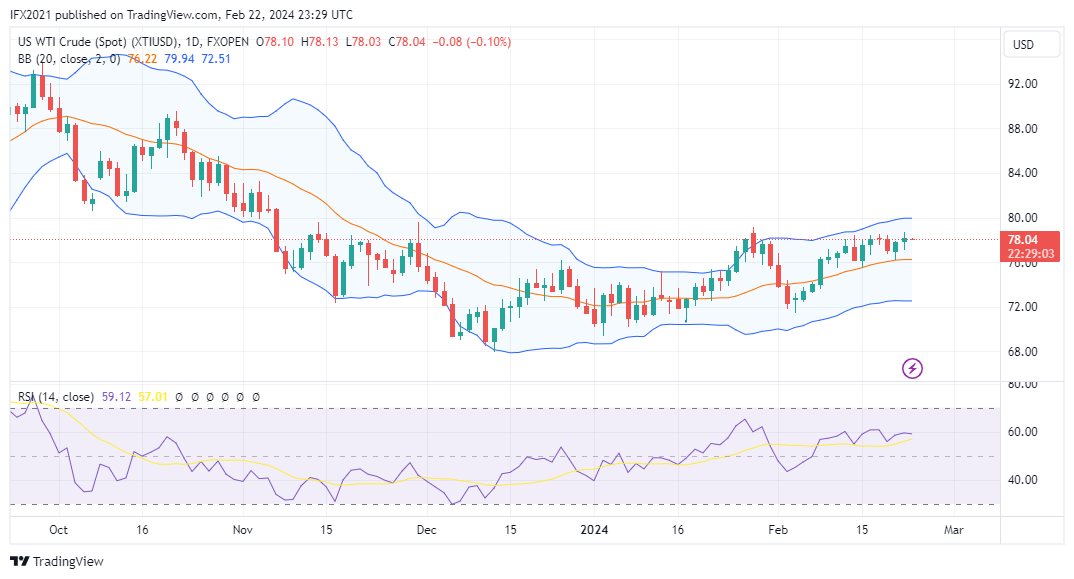
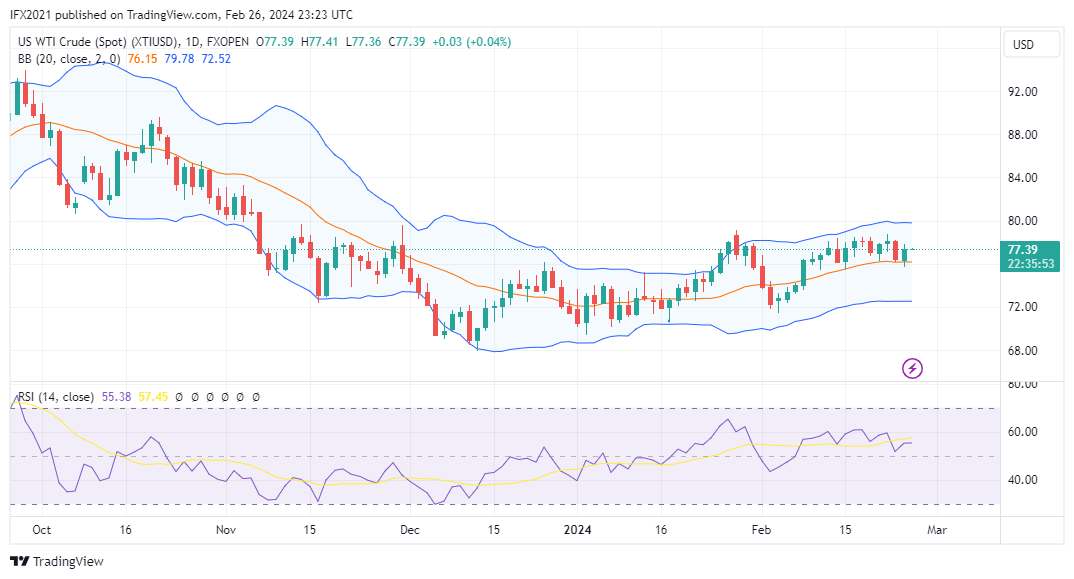
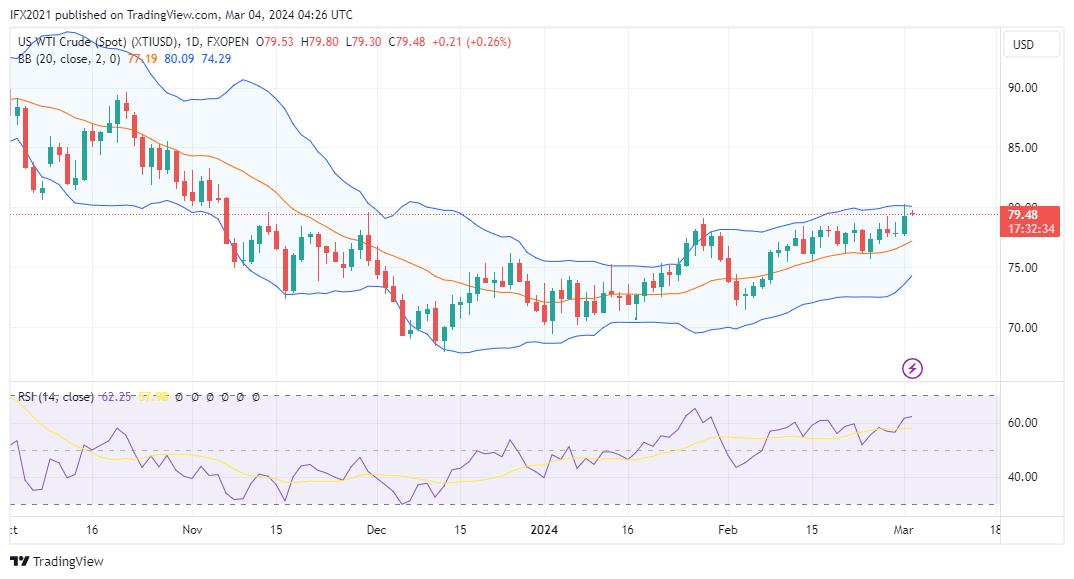
The price of US crude oil formed a Doji candlestick which reflects the Indecision market. The average price still moves between the upper and middle band lines with a swing high at roughly 80 and a swing low at roughly 75.
In the daily time frame, it is clear that the Bollinger bands are forming a slight upward channel with a wide band distance indicating high market volatility.
The MA 50, which takes close data for the past 50 days, forms a slight upward channel below the middle band line, far below the price indicating bullish sentiment.
The RSI indicator, which is an oscillator indicator, shows level 60, which means the price is above the uptrend level.
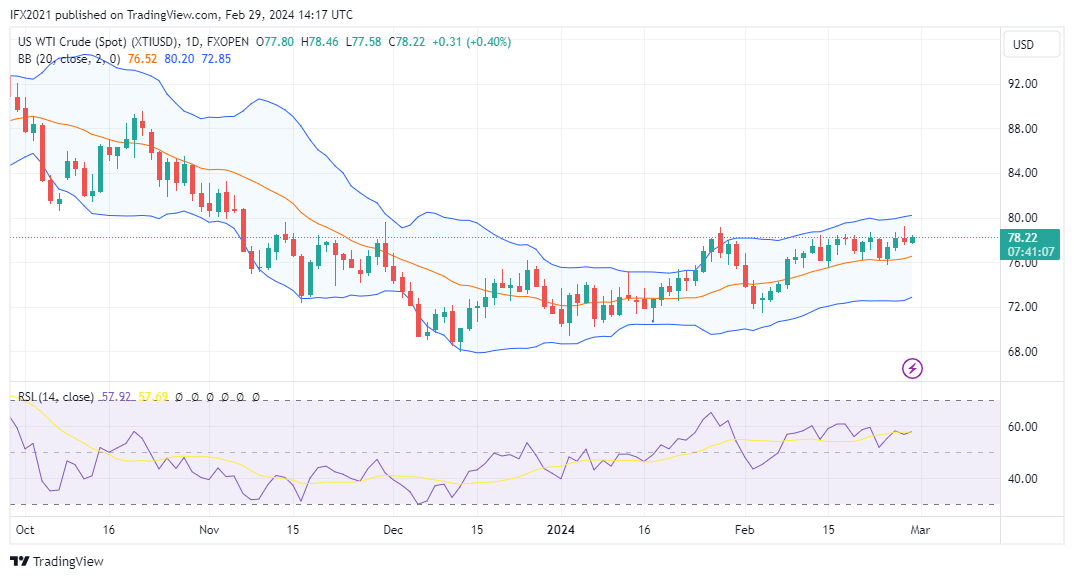
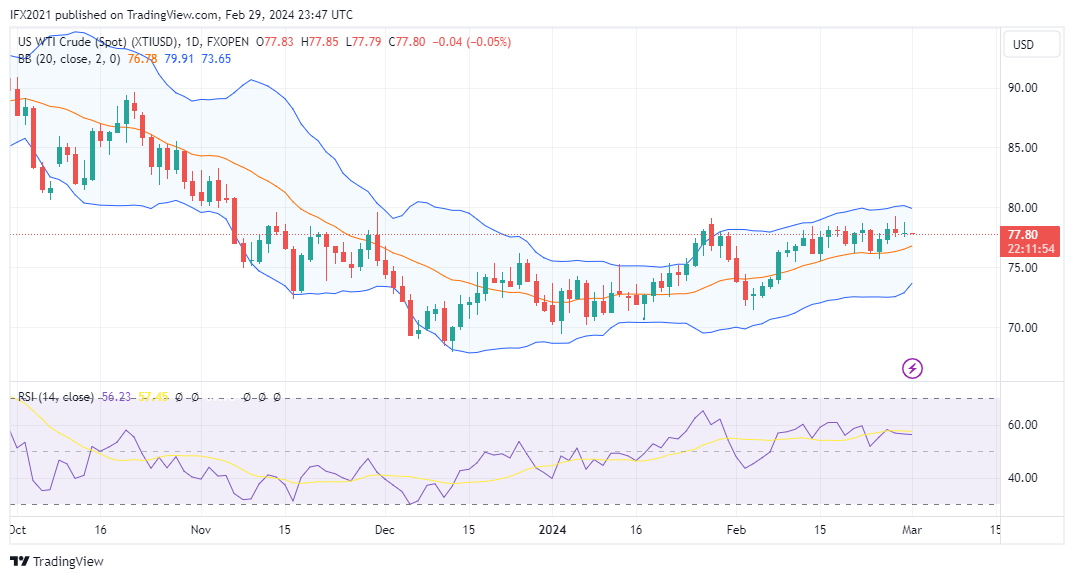
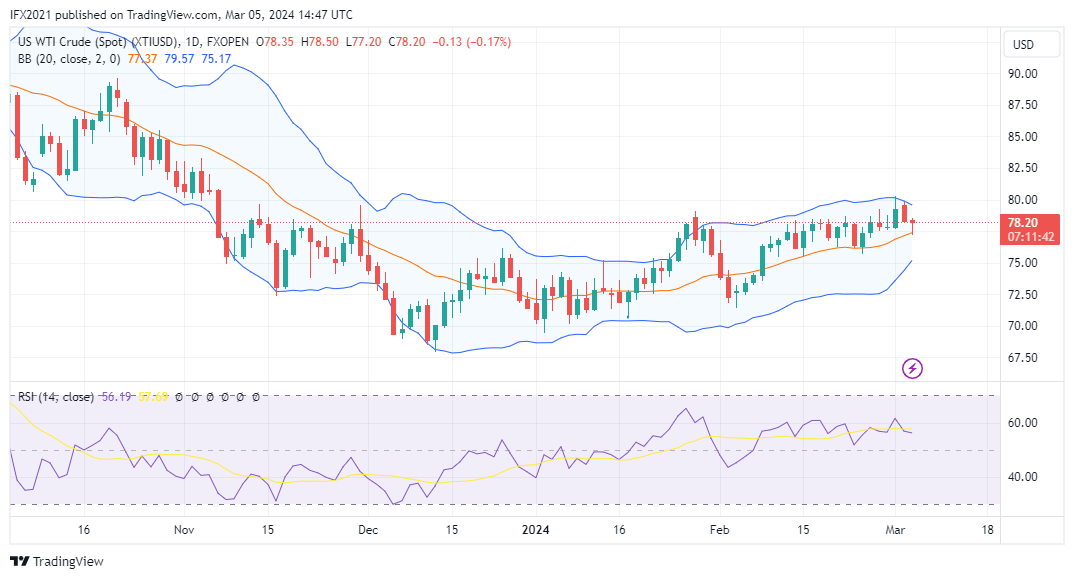
In the H1 timeframe, oil prices formed a retracement pattern after rising to a high of 78.71 and then falling near the middle band line at roughly 78 level price.
The price seems to be consolidating in this area, if there is a downside breakout the price may find new support near the lower band line.
The MA 50 here forms a flat channel below the price reflecting a sideways market, while the RSI shows level 51 which means the price is in the neutral zone slightly above the uptrend level.
#tradingview #fxopenuk
Disclaimer: CFDs are complex instruments and come with a high risk of losing your money.
Looking at today's market changes, oil prices for US crude are still moving within the daily price range of 76.79 levels
Citing to Oilprice, Crude oil prices moved slightly higher, after the Energy Information Administration reported an inventory increase of 3.5 million barrels for the week to February 16.
XTIUSD technical analysis
The price of US crude oil formed a Doji candlestick which reflects the Indecision market. The average price still moves between the upper and middle band lines with a swing high at roughly 80 and a swing low at roughly 75.
In the daily time frame, it is clear that the Bollinger bands are forming a slight upward channel with a wide band distance indicating high market volatility.
The MA 50, which takes close data for the past 50 days, forms a slight upward channel below the middle band line, far below the price indicating bullish sentiment.
The RSI indicator, which is an oscillator indicator, shows level 60, which means the price is above the uptrend level.
In the H1 timeframe, oil prices formed a retracement pattern after rising to a high of 78.71 and then falling near the middle band line at roughly 78 level price.
The price seems to be consolidating in this area, if there is a downside breakout the price may find new support near the lower band line.
The MA 50 here forms a flat channel below the price reflecting a sideways market, while the RSI shows level 51 which means the price is in the neutral zone slightly above the uptrend level.
#tradingview #fxopenuk
Disclaimer: CFDs are complex instruments and come with a high risk of losing your money.