Part III. Divergences with oscillators

Commander in Pips: As I’ve said, this will be the last part dedicated to divergences. I’ve seen that some traders use oscillators to identify divergences, such as Stochastic or RSI. Using oscillators has some nuances, since they are normalized indicators. Personally, I prefer to use MACD, but, if you’ll find that using stochastic or RSI is more suitable for you – pay close attention to some nuances.
Pipruit: Thanks. And what nuances?

Commander in Pips: Now you will see them. Take a look at the first chart:
Chart #1 | weekly EUR/USD and fake divergence with Stochastic
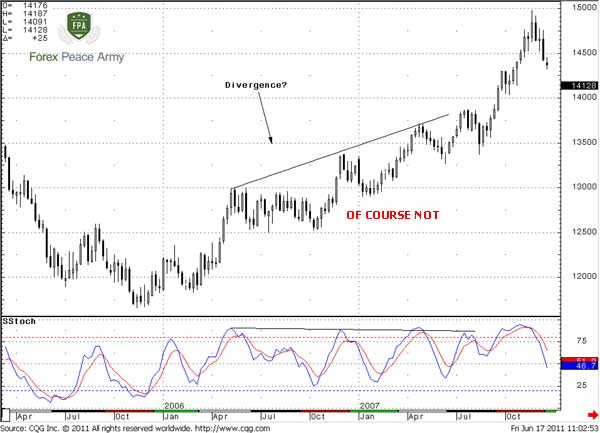
Do you see divergence here?Pipruit: Well, I think mostly yes, then no. But sir, if I’ve taken this signal, I’ve got huge loss!
Pipruit: And what we should to do then?
1. Be careful with using a normalized oscillator for Divergence estimation;
2. Always wait for line crossing and exit of oscillator from overbought /oversold zones.
If you’ve taken the signal after these rules has accomplished – you have the possibility to earn some pips or at least move your stop to breakeven.
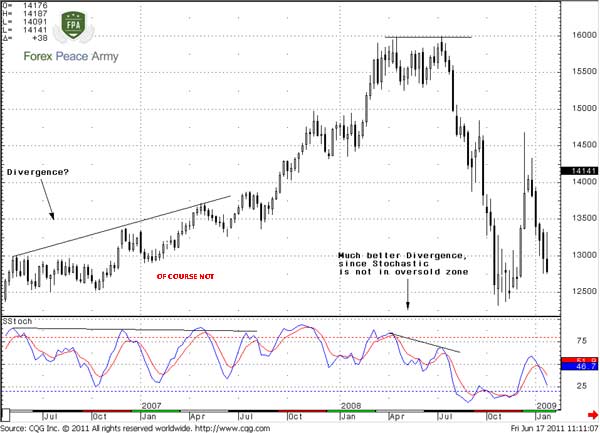
On chart #2 we show much better divergence, because Stochastic stands outside the overbought area:
Chart #2 | weekly EUR/USD better divergence with Stochastic
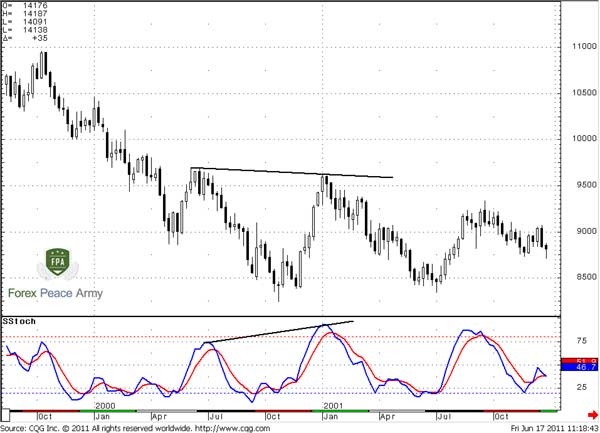
And here is example of hidden bearish divergence with Stochastic. Here again, the first top is not in overbought, hence this divergence has more chances of success. As we can see it has worked well, and the down move has continued:
And here is example of hidden bearish divergence with Stochastic. Here again, the first top is not in overbought, hence this divergence has more chances of success. As we can see it has worked well, and the down move has continued:
Commander in Pips: Oh, right. Let’s do it:
1. Divergence could exist only if market forms:
- Higher highs;
- Lower lows;
- Double top;
- Double bottom;
It’s no sense to break your eyes watching on indicator, till that happens. Also, these tops/bottoms have to be easily defined. So, if you will see something like that – this is not the precedent for divergence:
3. If market makes higher highs – link the highs, if market creates lower lows – link the lows. Don’t mess it up pal!
4. Once you’ve linked price tops/bottoms – take a look at indicator. Here your major interest is tops/bottoms of indicator. Ignore all other price action!
5. You have to link the same extremes on indicator as on price chart. If you have linked on price chart tops – so do the same on indicator. Bottoms – connect indicators bottoms.
6. Use vertical lines so that price tops/bottoms coincide with indicator’s one. Be aware of wrong displacement and taking wrong top/bottoms:
8. If you’ve caught divergence a bit late, so that price has moved some distance in direction of divergence – wait for another one, since divergence is not a signal, but mostly an indicator – it can’t give us a sharp target of price move due to it.
9. The higher the time frame – the more reliable divergence will be. Although some traders use divergences on 15 min or even 5-min charts, probably in the beginning its better stay on not less than an hourly chart, or even daily.
Chart #3 | weekly EUR/USD hidden divergence with Stochastic
Pipruit: Well. I think I’ll better stay with MACD for divergence estimation. Still, I understand that if we use some normalized oscillator we have to wait for accomplishment of these major rules:
1. Wait for lines crossover at close of bar to confirm divergence;
2. Wait for when the oscillator will come out from oversold/overbought area;
3. It’s preferable if divergence forms when the oscillator not at an oversold or overbought area;
4. And, final common rule – be careful with divergences in free space. Divergence that forms at some strong support/resistance area and confirmed by patterns and oversold/overbought indicators is much more reliable.
Commander in Pips: Yes, absolutely.Pipruit: Well. I think I’ll better stay with MACD for divergence estimation. Still, I understand that if we use some normalized oscillator we have to wait for accomplishment of these major rules:
1. Wait for lines crossover at close of bar to confirm divergence;
2. Wait for when the oscillator will come out from oversold/overbought area;
3. It’s preferable if divergence forms when the oscillator not at an oversold or overbought area;
4. And, final common rule – be careful with divergences in free space. Divergence that forms at some strong support/resistance area and confirmed by patterns and oversold/overbought indicators is much more reliable.
Pipruit: Commander, I just want to ask you one more thing. Could you please specify some rules of drawing and recognizing divergences? Probably I should have asked it in the beginning of this chapter but forgot to do it…
Commander in Pips: Oh, right. Let’s do it:
1. Divergence could exist only if market forms:
- Higher highs;
- Lower lows;
- Double top;
- Double bottom;
It’s no sense to break your eyes watching on indicator, till that happens. Also, these tops/bottoms have to be easily defined. So, if you will see something like that – this is not the precedent for divergence:
Chart #4 | 5-min EUR/USD - do not ever search for divergence is such environment
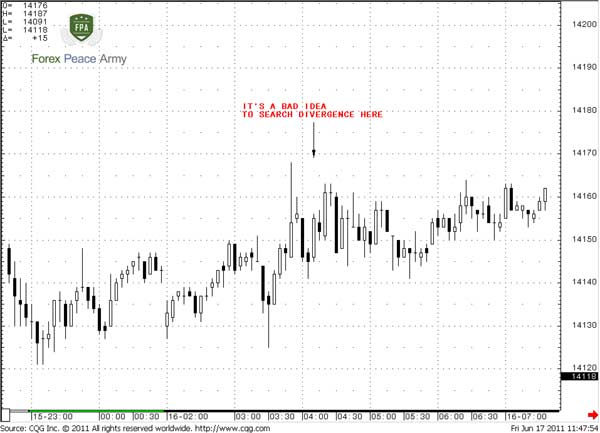
2. If you see well defined tops or bottoms - draw the line that links it from right to left. If you see some bumps, deeps, choppy and sloppy price action as on chart #4 - ignore it.3. If market makes higher highs – link the highs, if market creates lower lows – link the lows. Don’t mess it up pal!
4. Once you’ve linked price tops/bottoms – take a look at indicator. Here your major interest is tops/bottoms of indicator. Ignore all other price action!
5. You have to link the same extremes on indicator as on price chart. If you have linked on price chart tops – so do the same on indicator. Bottoms – connect indicators bottoms.
6. Use vertical lines so that price tops/bottoms coincide with indicator’s one. Be aware of wrong displacement and taking wrong top/bottoms:
Chart #5 | 5-min EUR/USD - wrong displacement of price and indicator tops
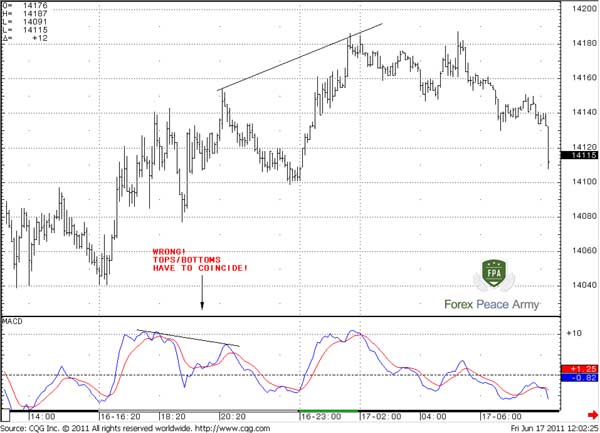
Chart #6 | 5-min EUR/USD - Right!
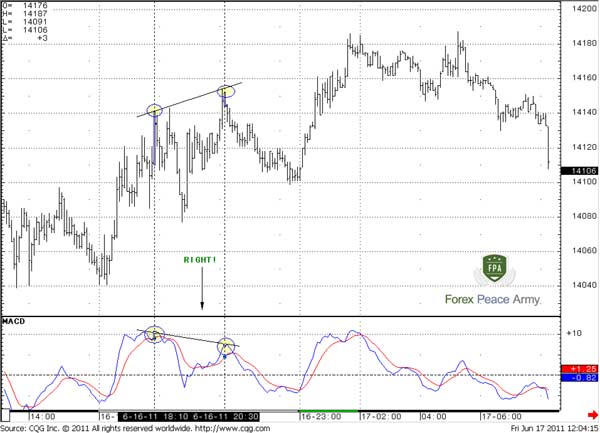
7. Divergence will exist only if there will be difference in the slope of the lines that connect the tops/bottoms or price chart and corresponding tops/bottoms of indicator. Slope could be threefold – ascending, descending and flat.Chart #6 | 5-min EUR/USD - Right!
8. If you’ve caught divergence a bit late, so that price has moved some distance in direction of divergence – wait for another one, since divergence is not a signal, but mostly an indicator – it can’t give us a sharp target of price move due to it.
9. The higher the time frame – the more reliable divergence will be. Although some traders use divergences on 15 min or even 5-min charts, probably in the beginning its better stay on not less than an hourly chart, or even daily.
Comments

Hamza Samiullah
6 years ago,
Registered user
Good work
O
One-fm
5 years ago,
Registered user
finally, i can now trade divergence with ease. Thanks
K
kangara
5 years ago,
Registered user
nice
Table of Contents
- Introduction
- FOREX - What is it ?
- Why FOREX?
- The structure of the FOREX market
- Trading sessions
- Where does the money come from in FOREX?
- Different types of market analysis
- Chart types
- Support and Resistance
- Candlesticks – what are they?
- Mysterious Fibonacci
- Introduction to Moving Averages
- Bollinger Bands
- Leading and Lagging Indicators
- Basic chart patterns
- Pivot points – description and calculation
- Elliot Wave Theory
- Intro to Harmonic Patterns
- Divergence Intro
- Harmonic Approach to Recognizing a Trend Day
- Intro to Breakouts and Fakeouts
- Again about Fundamental Analysis
- Cross Pair – What the Beast is That?
- Multiple Time Frame Intro
- Market Sentiment and COT report
- Dealing with the News
- Let's Start with Carry
- Let’s Meet with Dollar Index
- Intermarket Analysis - Commodities
- Trading Plan Framework – Common Thoughts
- A Bit More About Personality
- Mechanical Trading System Intro
- Tracking Your Performance
- Risk Management Framework
- A Bit More About Leverage
- Why Do We Need Stop-Loss Orders?
- Scaling of Position
- Intramarket Correlations
- Some Talk About Brokers
- Forex Scam - Money Managers
- Graduation!