Daily Technical Analysis by FxGrow

FxGrow Daily Technical Analysis – 14th Sept, 2015
By FxGrow Research & Analysis Team

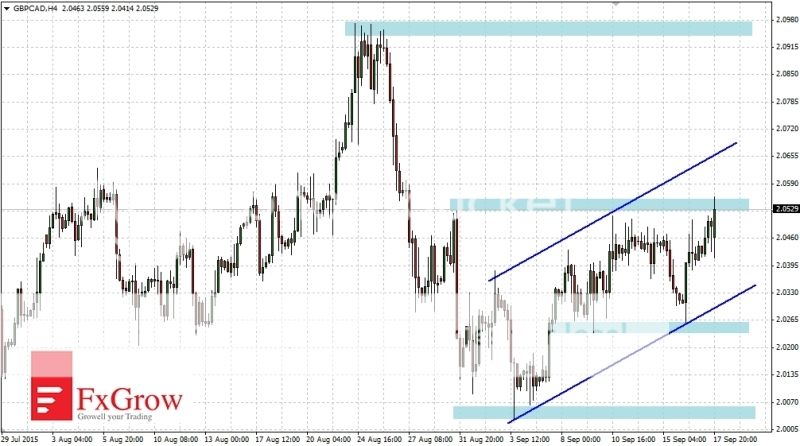
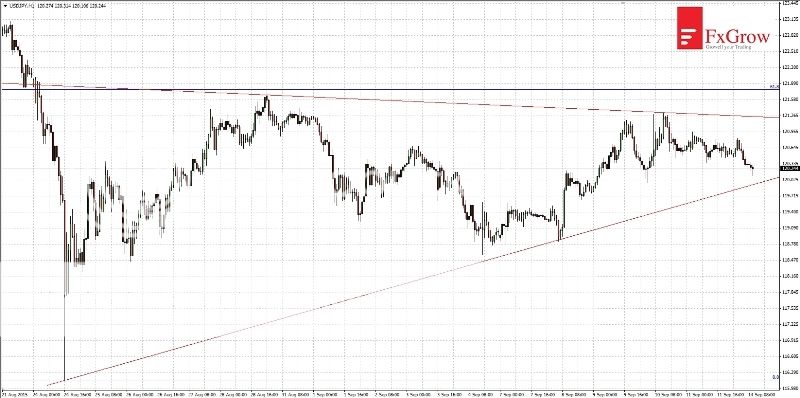
USDJPY breakout of the triangle will point the direction of move

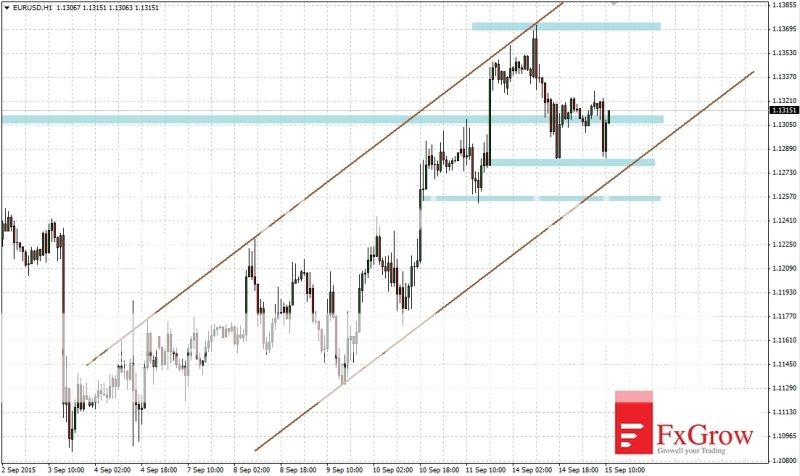
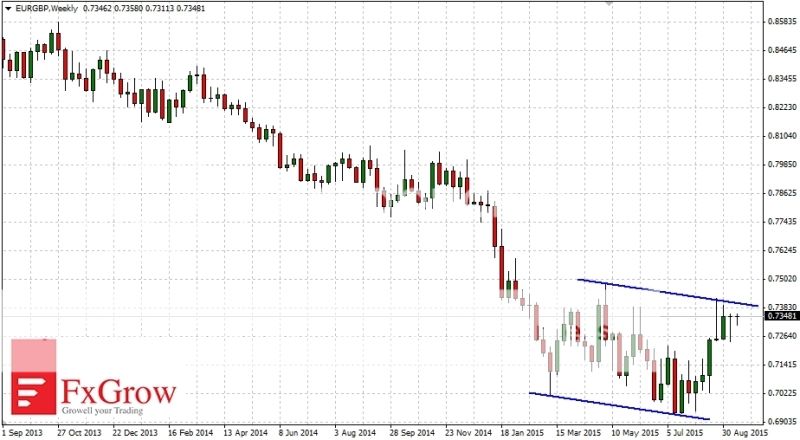
Since 3 weeks USDJPY moves in a triangle, whose lower and upper band have been tested for two times. Correction which lasts for a month was abolished by 61.8% (so amounted to rebound after drop). This suggests that there is still more likely to continue correction than the end of it and return to move up. In the triangle we are slowly running out of space. If the market will react on that formation effective break out will point further movement.
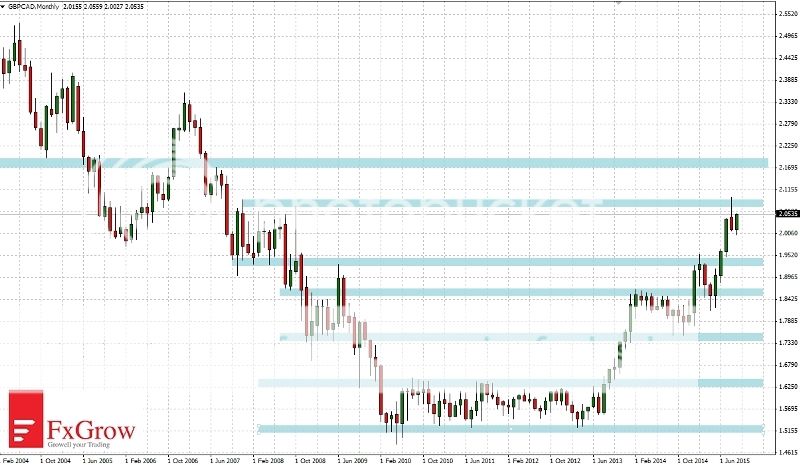
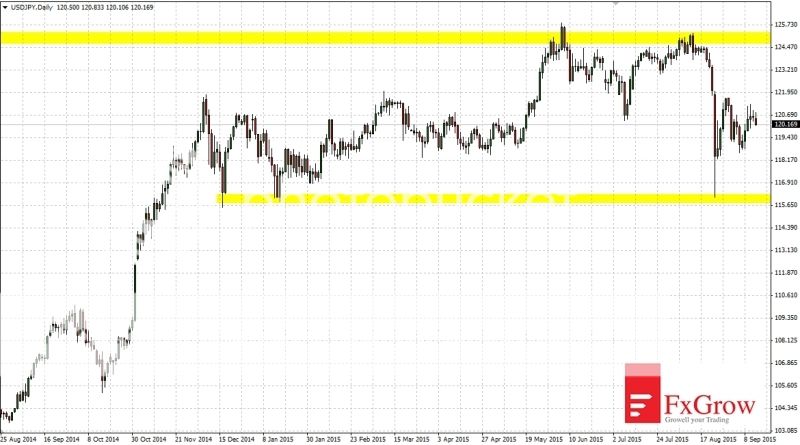
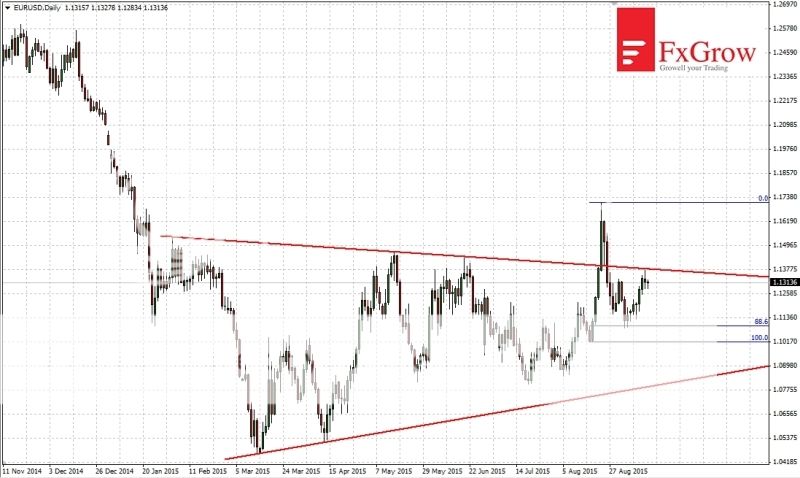
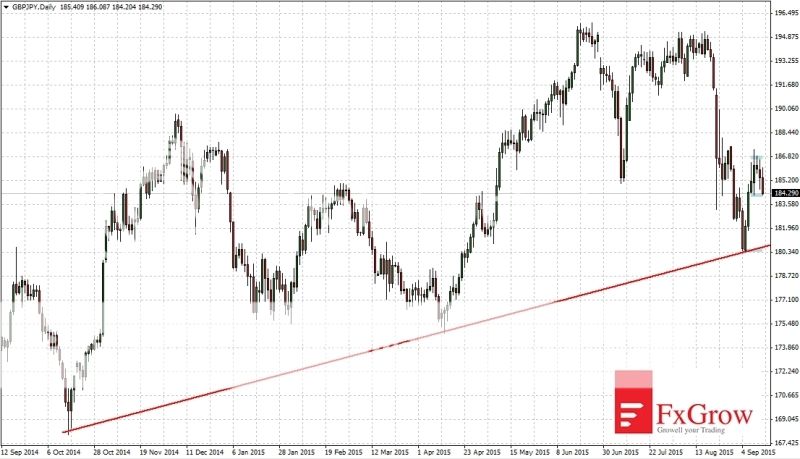
2015-09-14_analiza_USDJPY-H1_zpsdnwv292o.jpg


Wider view D1

Since 2012 USDJPY is moving in an upward trend. At that time the price rose from 76 in January 2012 to 120.50 last Friday. At the level of the maximum of August, price was recently in 2002. For now this resistance stopped further upward movement. On the other hand strong suport is on the level 116. Last time it was tested in 24 August. This support for almost a year does not allow price to fall.

2015-09-14_analiza_USDJPY-D1_zpsetw0yb1b.jpg


For more in depth Research & Analysis please visit FxGrow.

Note: This analysis is intended to provide general information and does not constitute the provision of INVESTMENT ADVICE. Investors should, before acting on this information, consider the appropriateness of this information having regard to their personal objectives, financial situation or needs. We recommend investors obtain investment advice specific to their situation before making any financial investment decision.
 
FxGrow Daily Technical Analysis – 14th Sept, 2015
By FxGrow Research & Analysis Team

AUDCAD current rebound reached to fibo 50%

According to the analysis for the beginning of September the price has tested the support 0.9160 (from 2013). Support was target for the bears and for the bulls. The bears were closing short positions and the bulls were opening a long positions here. As a result, the weekly chart shows the strong bull candle, which stopped at the resistance. On the weekly chart, we can draw quite precisely the downward channel, in which the price moves for 1.5 years. At this moment bulls are trying to break above resistance at 0.9400. If it proves successful the level of 0.9740 will be the target of upward move.

2015-09-14_analiza_AUDCAD-W1_zpsspoudyvt.jpg


At the time-frame H4 we can see smaller channel. An attempt of broke below has failed and today the bulls are trying to break above the channel's top. If the bulls succeeds the next resistance will be at 0.9480. However, the current level is a 50% Fibonacci retracement of last downward move and it may cause bears reaction.

2015-09-14_analiza_AUDCAD-H4_zpsao5dcaqf.jpg


For more in depth Research & Analysis please visit FxGrow.

Note: This analysis is intended to provide general information and does not constitute the provision of INVESTMENT ADVICE. Investors should, before acting on this information, consider the appropriateness of this information having regard to their personal objectives, financial situation or needs. We recommend investors obtain investment advice specific to their situation before making any financial investment decision.
 
FxGrow Daily Technical Analysis – 15th Sept, 2015
By FxGrow Research & Analysis Team

EURUSD - consolidation under the upper arm of the triangle

Time-frame H1

Since September 4 EURUSD moves in an upward channel. Last friday was break above the resistance at level 1.1305, but the bulls joy did not last long because already the next day the price back below resistance. In upcoming days it should be test the lower limit of the channel on 1.1270 and rebound. The target of the rebound will be the level 1.1370 which is the local maximum. High volatility on EURUSD is to be expected on Thursday, after the Fed's decision on interest rates.

2015-09-15_analiza_EURUSD-H1_zps7yo7l89h.jpg


Wider view - interval D1

Since the beginning of the year EURUSD moves in the triangle. In late of August there was an attend to break above the triangle, which ended with a fakey and price returned to the interior of the triangle. The last dynamic upward movement was ended on 24 August at the level of 1.1710. We saw a corrective decrease from that level, which stopped at the 88,6% Fibonacci retracement of last upward move. If the price will keep in area of the upper limit of the triangle it will increase the chance of successful break of resistance and move upward.

2015-09-15_analiza_EURUSD-D1_zpsvp0str12.jpg


For more in depth Research & Analysis please visit FxGrow.

Note: This analysis is intended to provide general information and does not constitute the provision of INVESTMENT ADVICE. Investors should, before acting on this information, consider the appropriateness of this information having regard to their personal objectives, financial situation or needs. We recommend investors obtain investment advice specific to their situation before making any financial investment decision.
 
FxGrow Daily Technical Analysis – 15th Sept, 2015
By FxGrow Research & Analysis Team

GBPJPY - test of the rising trend line

After a period of much volatility in the last few days the movement of price is in the consolidation. The current support defending against falls is in the level of 184.20, and resistance that will stop further rise in the price level is 186.80. If the bears will break below pointed suport, the target of falls will be 180.40. Alternatively, break above of consolidation can bring the price to 195.00.

2015-09-15_analiza_GBPJPY-H1_zpsarjqdd1r.jpg


Wider view D1

At the interval D1 GBPJPY is still moving in an upward trend and the trend line was tested last week. However if the bulls will show weakness, and led to the next level test September minimum break of the trend line could become a reality.

2015-09-15_analiza_GBPJPY-D1_zpsae9ma59e.jpg


For more in depth Research & Analysis please visit FxGrow.

Note: This analysis is intended to provide general information and does not constitute the provision of INVESTMENT ADVICE. Investors should, before acting on this information, consider the appropriateness of this information having regard to their personal objectives, financial situation or needs. We recommend investors obtain investment advice specific to their situation before making any financial investment decision.
 
FxGrow Daily Technical Analysis – 16th Sept, 2015
By FxGrow Research & Analysis Team

EURGBP - weakened bulls and fundamentals confirm the possibility of falls

Since three weeks price moves in consolidation. Near resistance, which stops the upward movement is on 0.7400. Resistance was tested two times, so the third time also should be failed. The nearest support level is 0.7240, and its break below will cause the price movement to 0.7160. Last rebound from the support was not as strong as the previous one. This suggests that the bulls are weakening.

2015-09-16_analiza_EURGBP-H4_zpsmgissrdo.jpg


Wider view W1

Since 2013 EURGBP fall from 0.8765 to 0.7000 in August 2015. This year the falls slowed, from January price moves in the channel. Fundamentally, the euro should continue to weaken because of the divergent policies of central banks. The Bank of England is on the way to interest rate hike. While the European Central Bank is in the middle of monetary policy easing program. For this reason, we are now seeing rather sorth pause of falls than the beginning of a trend reversal.

2015-09-16_analiza_EURGBP-W1_zpsvmpks8fb.jpg


For more in depth Research & Analysis please visit FxGrow.

Note: This analysis is intended to provide general information and does not constitute the provision of INVESTMENT ADVICE. Investors should, before acting on this information, consider the appropriateness of this information having regard to their personal objectives, financial situation or needs. We recommend investors obtain investment advice specific to their situation before making any financial investment decision.
 
FxGrow Daily Technical Analysis – 16th Sept, 2015
By FxGrow Research & Analysis Team

USDTRY - level 3.0000 may cause a correction?

An interesting situation on USDTRY (US dollar to Turkish lira). Price is in impressive upward trend since 2010. At the beginning of September level of 3.00000 was broke above and many investors became interested. Because since two years, there wasn't a bigger correction. For now, at such a strong uptrend short positions would be risky, but USDTRY is worth of attention.

The nearest resistance is at 3.07000. Close support is 3.00000, and after it has been broken below the next support level is on 2.90000. The second support also reinforces the 38,2% Fibonacci retracement of last upward move. However only break below the next support which means fall below the 2.80000 will be a warning of USDTRY deeper correction. The last pointed level is also the 61,8% Fibonacci retracement of last upward move.

Time-frame H4

2015-09-16_analiza_USDTRY-W1_zpsr0sfc5nw.jpg


Time-frame W1

2015-09-16_analiza_USDTRY-H4_zpsvcbfwk6x.jpg


For more in depth Research & Analysis please visit FxGrow.

Note: This analysis is intended to provide general information and does not constitute the provision of INVESTMENT ADVICE. Investors should, before acting on this information, consider the appropriateness of this information having regard to their personal objectives, financial situation or needs. We recommend investors obtain investment advice specific to their situation before making any financial investment decision.
 
I am waiting for the markets to see what is going to happen in the FOMC as i think that it will make major moves today :)
 
FxGrow Daily Technical Analysis – 18th Sept, 2015
By FxGrow Research & Analysis Team

GBPCAD - the bulls are not giving up

Since beginning of August GBPCAD move up 500 pips from the bottom and it is moving in the upward channel. On Thursday upward movement was stopped on the resistance 2.0530. However bulls could break it soon. Upward movement may take place in the channel and bring the price to the August high on 2.0900. Alternatively, if the move up are not continued the supports for the bulls will be at the levels 2.0260 and 2.0030.

2015-09-18_analiza_GBPCAD-H4_zpsbqyxb6ik.jpg


Wider view, interval monthly

Since 2013 GBPCAD moves in upward trend. The next resistance were broke by bulls with success. Last month, the price reached to the next significant resistance at 2.0900 and on the monthly chart appeared downward candle with a long upper shadow. Bulls are not surrending, and after almost three weeks of September recovered half of August candle. Too fast attempt to break through this resistance may end with deeper correction. So the best thing that bulls may do is to wait on the consolidation below the resistance.

2015-09-18_analiza_GBPCAD-M1_zpsiiygy9gd.jpg


For more in depth Research & Analysis please visit FxGrow.

Note: This analysis is intended to provide general information and does not constitute the provision of INVESTMENT ADVICE. Investors should, before acting on this information, consider the appropriateness of this information having regard to their personal objectives, financial situation or needs. We recommend investors obtain investment advice specific to their situation before making any financial investment decision.
 
FxGrow Daily Technical Analysis – 18th Sept, 2015
By FxGrow Research & Analysis Team

AUDJPY in consolidation, nearest resistance could be a chance for a short

After August decreases – which culminated on August 24th – price finally rebounded. Rebound reached 50% Fibonacci retracement of last downward move, then AUDJPY returned to falls. That bottom at 82.10 with an accuracy of 2 pips confirmed its strength as a support. Price approached the resistance of the last 3 weeks. If bears takes the initiative near 87.25 the further test of August's minimum will be possible. However if an attack on the resistance succeeds the next resistances will be on 89.40, 92.40.

2015-09-17_analiza_AUDJPY-H4_zpsfu07xk0d.jpg


Wider view, time-frame W1

In the long term since mid-2009 AUDJPY moves between levels 72 - 104. Last year after getting closer to the upper limit of this range falls occurred. Since then the price moves in a downward channel, the lower limit has been tested in early September. If the bears will take the control now a bottom of 2015 can be deepened. Alternatively, if the bulls shows strength upward move can reach 92.00 in the long term.

2015-09-17_analiza_AUDJPY-W1_zpsntqxvwmz.jpg


For more in depth Research & Analysis please visit FxGrow.

Note: This analysis is intended to provide general information and does not constitute the provision of INVESTMENT ADVICE. Investors should, before acting on this information, consider the appropriateness of this information having regard to their personal objectives, financial situation or needs. We recommend investors obtain investment advice specific to their situation before making any financial investment decision.
 
FxGrow Daily Technical Analysis – 18th Sept, 2015
By FxGrow Research & Analysis Team

NZDUSD - Bulls on the offensive, the target of upward movement is 0.6700

Thursday's Fed meeting turned out to be very negative for the dollar bulls. At NZDUSD shortly after the FED's decision followed attempt of break above resistance at the level 0.6400. The attempt proved to be false and the price returned creating a false breakout on the chart. The dollar weakened today to the main currencies EURUSD has exceeded 1.1400, GBPUSD went over 1.5600. Also on NZDUSD bulls decided to try attacking again on yesterday's resistance. At this moment, the resistance has been broken above and we should see upward move to 0.6500 level, and this area should appear of correction. When it appears it could bring price to re-test of resistance at 0.6400, a level which has now become the new support. If level 0.65 will be also break above, it will open the road to a level 0.6700, which should stop upward movement for a longer time.

Wider perspective

Since the middle of 2014 NZDUSD is in a downward trend therefore the current rally still should be regarded as a rebound.

2015-09-18_analiza_NZDUSD-H4_zps7p164re8.jpg


For more in depth Research & Analysis please visit FxGrow.

Note: This analysis is intended to provide general information and does not constitute the provision of INVESTMENT ADVICE. Investors should, before acting on this information, consider the appropriateness of this information having regard to their personal objectives, financial situation or needs. We recommend investors obtain investment advice specific to their situation before making any financial investment decision.
 
Back
Top