FxGrow Support
Recruit
- Messages
- 58
FxGrow Daily Technical Analysis – 04th Nov, 2015
By FxGrow Research & Analysis Team
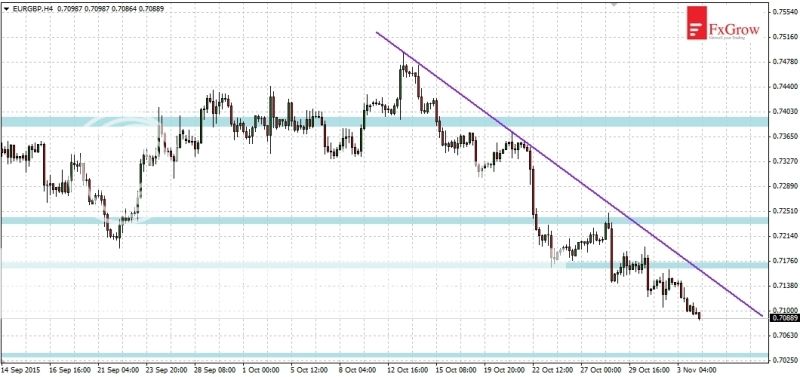
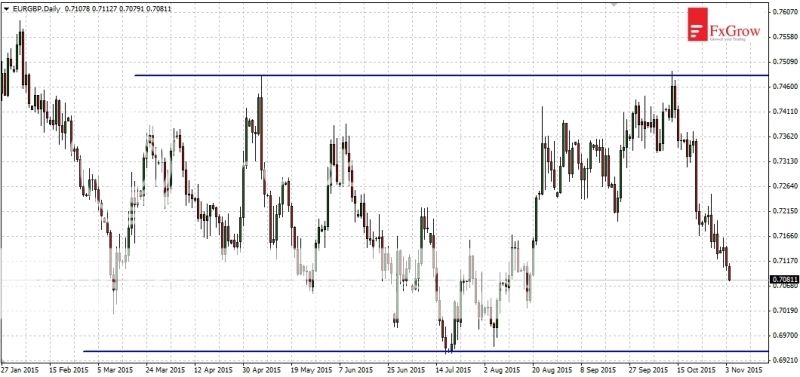
EURGBP moves towards 0.6940
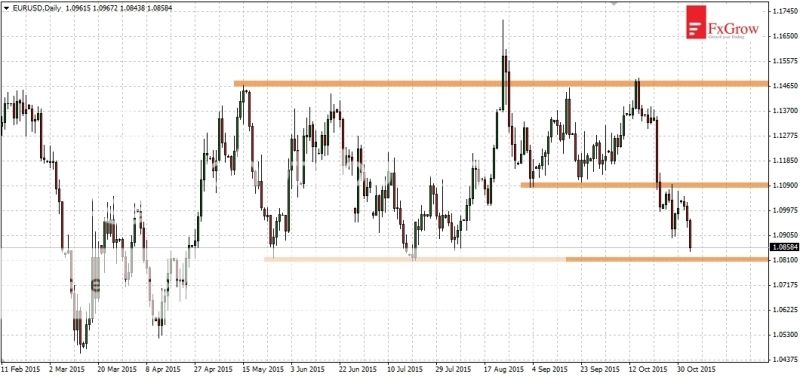
In the previous analysis, I wrote: "If support at 0.7200 has been permanently broken the goal of falls will be the level of 0.6940. Along the way supply will have to deal with supports: 0.7165, 0.7090, 0.7035". And so it happened since February 2015 EURGBP moves in consolidation between the levels 0.7480 - 0.6940. After testing the upper limit of this consolidation in mid-October now falls should reach to the lower limit. The nearest support is at 0.7040. If there was a rebound it should be stopped at the level of 0.7165. There is a downward trend line and the nearest major resistance.
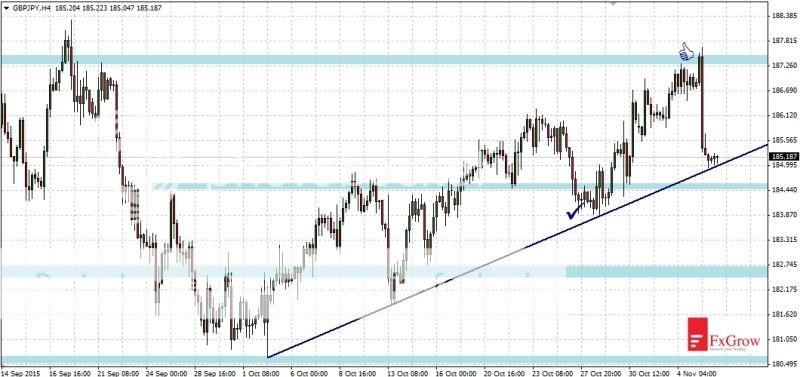
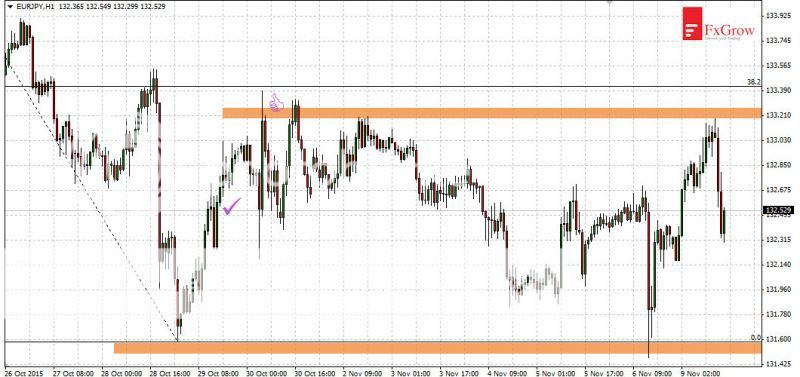
Time-frame H4:
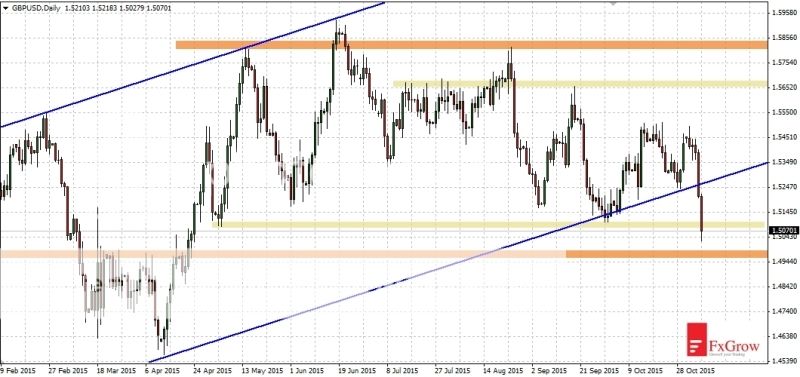
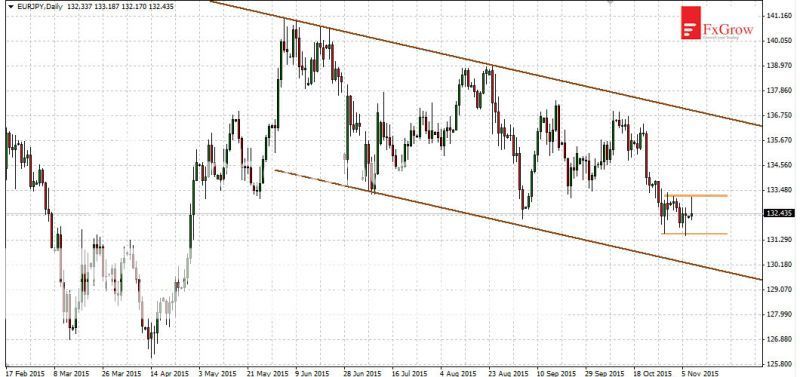
Time-frame D1:
For more in depth Research & Analysis please visit FxGrow.
Note: This analysis is intended to provide general information and does not constitute the provision of INVESTMENT ADVICE. Investors should, before acting on this information, consider the appropriateness of this information having regard to their personal objectives, financial situation or needs. We recommend investors obtain investment advice specific to their situation before making any financial investment decision.
By FxGrow Research & Analysis Team
EURGBP moves towards 0.6940
In the previous analysis, I wrote: "If support at 0.7200 has been permanently broken the goal of falls will be the level of 0.6940. Along the way supply will have to deal with supports: 0.7165, 0.7090, 0.7035". And so it happened since February 2015 EURGBP moves in consolidation between the levels 0.7480 - 0.6940. After testing the upper limit of this consolidation in mid-October now falls should reach to the lower limit. The nearest support is at 0.7040. If there was a rebound it should be stopped at the level of 0.7165. There is a downward trend line and the nearest major resistance.
Time-frame H4:
Time-frame D1:
For more in depth Research & Analysis please visit FxGrow.
Note: This analysis is intended to provide general information and does not constitute the provision of INVESTMENT ADVICE. Investors should, before acting on this information, consider the appropriateness of this information having regard to their personal objectives, financial situation or needs. We recommend investors obtain investment advice specific to their situation before making any financial investment decision.