FxGrow Support
Recruit
- Messages
- 58
FxGrow Daily Technical Analysis – 21st Sept, 2015
By FxGrow Research & Analysis Team
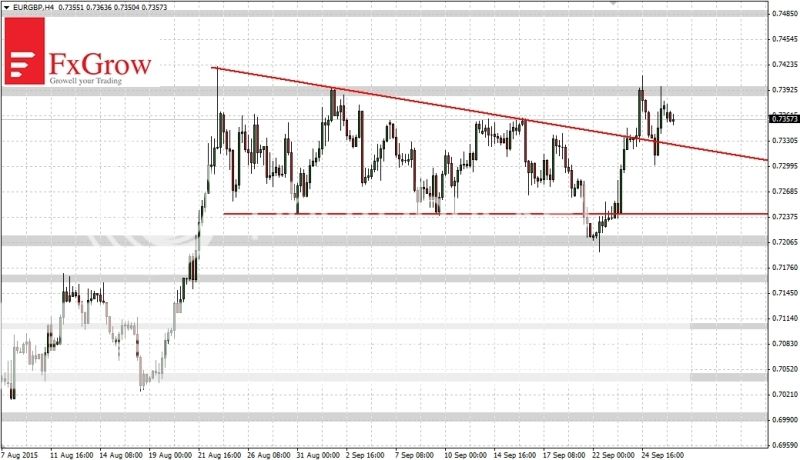
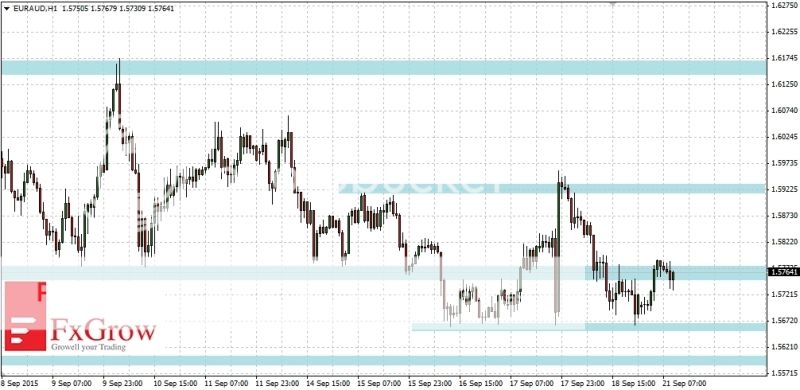
EURAUD - breakout from the consolidation will indicate the direction of movement
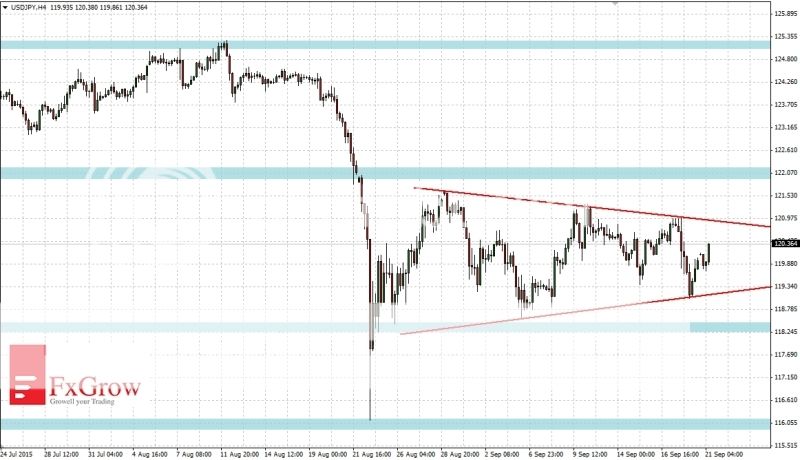
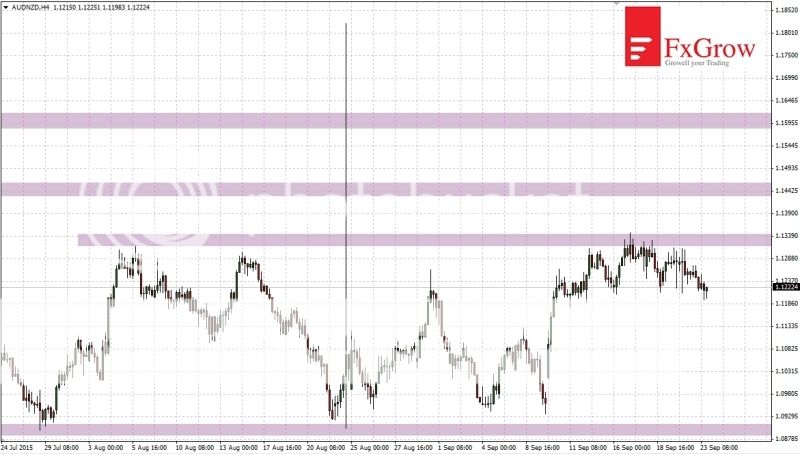
Since last week EURAUD can't go away from the level of 1.5770. The downward movement stops at support 1.5660, and move up stops at resistance 1.5940. Dynamic upward candle, which took place on Thursday after the Fed decision also does not help with consolidation breakout. If break below that consolidation will be successfully next support on 1.5600 has a chance to cause a rebound. On the other hand, the break above resistance 1.5940 will take price first to 1.6160 and next to 1.6600.
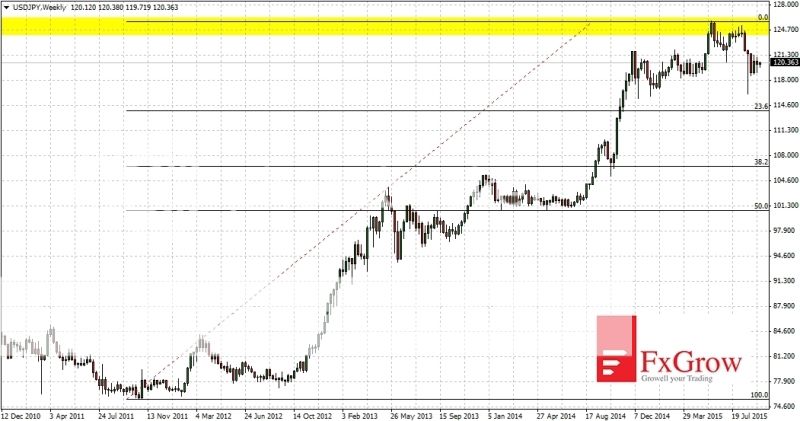
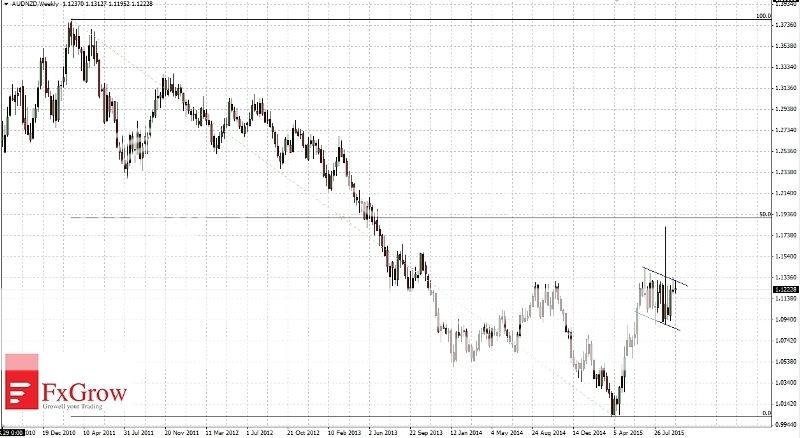
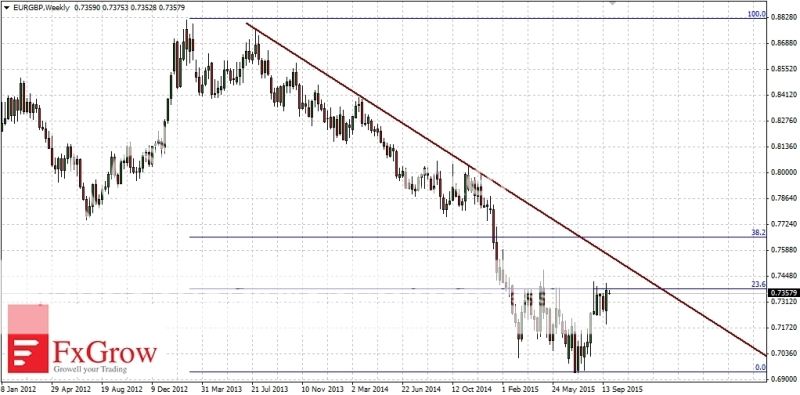
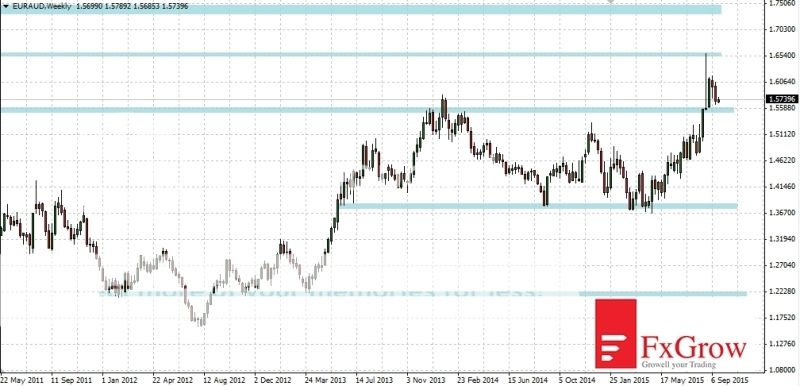
Wider view, interval W1
At weekly interval we can indicate another significant levels. After breaking down the 1.5600 level, the downward movement may reduce price to 1.3800. But break above the level 1.6600 will bring the price to 1.7400.
For more in depth Research & Analysis please visit FxGrow.
Note: This analysis is intended to provide general information and does not constitute the provision of INVESTMENT ADVICE. Investors should, before acting on this information, consider the appropriateness of this information having regard to their personal objectives, financial situation or needs. We recommend investors obtain investment advice specific to their situation before making any financial investment decision.
By FxGrow Research & Analysis Team
EURAUD - breakout from the consolidation will indicate the direction of movement
Since last week EURAUD can't go away from the level of 1.5770. The downward movement stops at support 1.5660, and move up stops at resistance 1.5940. Dynamic upward candle, which took place on Thursday after the Fed decision also does not help with consolidation breakout. If break below that consolidation will be successfully next support on 1.5600 has a chance to cause a rebound. On the other hand, the break above resistance 1.5940 will take price first to 1.6160 and next to 1.6600.
Wider view, interval W1
At weekly interval we can indicate another significant levels. After breaking down the 1.5600 level, the downward movement may reduce price to 1.3800. But break above the level 1.6600 will bring the price to 1.7400.
For more in depth Research & Analysis please visit FxGrow.
Note: This analysis is intended to provide general information and does not constitute the provision of INVESTMENT ADVICE. Investors should, before acting on this information, consider the appropriateness of this information having regard to their personal objectives, financial situation or needs. We recommend investors obtain investment advice specific to their situation before making any financial investment decision.