Daily Technical Analysis by FxGrow

FxGrow Daily Technical Analysis – 04th Jan, 2017
By FxGrow Research & Analysis Team

Kiwi Collapses on Negative local GDT
NZDUSD4_zpsem39dtfz.png


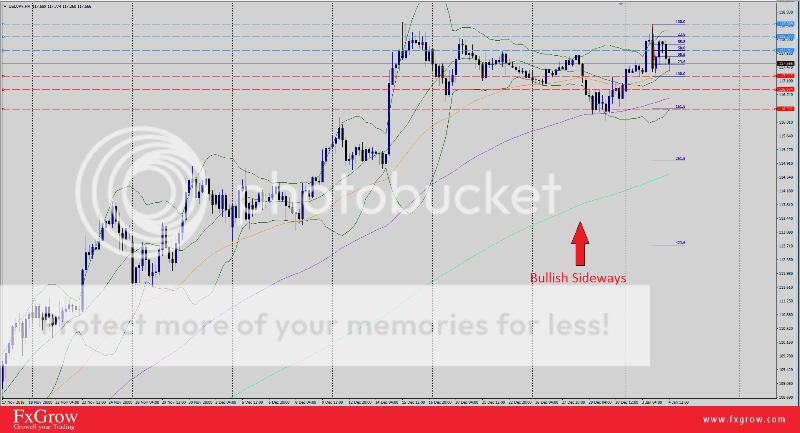
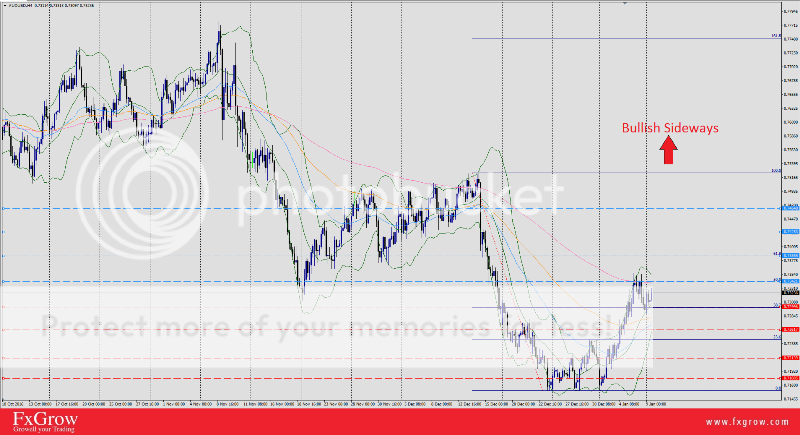
NZD/USD extended bearish momentum following negative local GDT, not meeting expectations. Diary price index scored -3.9% compared -0.5% in previous sessions, causing the pair to plunge to 0.6884 low, after clocking a high 0.6973. NZD/USD opened trading session with a surge at 0.6951 high, at which the cable is currently trading, taking advantage of weaker US dollar as US index dropping from 103.42 high to 102.91 low. Although the pair is showing some short-term-up-trend correction, it's still to be considered bearish taking into consideration strong US dollar even though the index is taking a rest right now after peeking to 103.81 at the end of 2016.

Trend : Bearish Sideways

Key levels to watch : Weekly Pp 0.6933

Resistance levels : R1 0.6973, R2 0.7044, R3 0.7118

Support levels : S1 0.6880, S2 0.6833, S3 0.6766

Remark : Overall the market remains bearish even though the cable is showing some slight recovery. US index is still to be considered relatively high with minor down correction. A break below S1 will cause further selloffs and wash towards S2 & S3. However, if the pair closes above R2 level, price level will trigger towards R3 level and above it the NZD/USD will shift to bullish momentum. Keep eye on US index.


For more in depth Research & Analysis please visit FxGrow.http://fxgrow.com/analysis-educatio...cal-analysis-fxgrow-free-forex-analysis-tools

Note: This analysis is intended to provide general information and does not constitute the provision of INVESTMENT ADVICE. Investors should, before acting on this information, consider the appropriateness of this information having regard to their personal objectives, financial situation or needs. We recommend investors obtain investment advice specific to their situation before making any financial investment decision.
 
FxGrow Daily Technical Analysis – 04th Jan, 2017
By FxGrow Research & Analysis Team

Japanese Yen Strengthen on Kuroda's Positive Comments, NFP Eyed
USDJPY4_zpsjxcfgow8.png


Japanese Yen received a positive shock earlier this morning with hints by Governor Kuroda on behalf of BOJ that progress is being made to end deflation. Yesterday, USD/JPY spiked yesterday to 118.60 April-2016-fresh-highs following strong US index peeking to 103.81, highest since March 2003 after receiving +1.5 on ISM PMI compared to 53.2 previous session. On today's opening sessions, the pair showed minor short-term-down correction following the path of Kuroda's positive comments first, second collapsing US index today at 102.93 low. Japanese Yen was energized by Nekkei index peeking today to 19594 Dec-2015-fresh-highs. USD/JPY is currently trading 117.51 intraday, above weekly Pp 116.91.

Key Headlines:

"More confident will make progress ending deflation"

"More confident will make progress in 2017 on deflation "

Trend : Bullish Sideways

Key levels to watch : Weekly Pp 116.91

Fibonacci resistance levels : R1 117.91, R2 118.27, R3 118.60

Fibonacci Support levels : S1 117.22, S2 116.87, S3 116.35

Remark : The market remains Bullish. Short term minor-downtrend correction is expected due to the ebb and flow between strong US dollar and excessive effort by BOJ to support Japanese Yen. Long positions above R1 will spark additional boost for the cable towards R2 & R3 levels. A break under S3 is needed for USD/JPY to shift into bearish momentum. US index strength is the main player. Also today's FOMC minute meetings is a hint of Friday's NFP which will have a huge impact on US dollar strength.

For more in depth Research & Analysis please visit FxGrow.http://fxgrow.com/analysis-educatio...cal-analysis-fxgrow-free-forex-analysis-tools

Note: This analysis is intended to provide general information and does not constitute the provision of INVESTMENT ADVICE. Investors should, before acting on this information, consider the appropriateness of this information having regard to their personal objectives, financial situation or needs. We recommend investors obtain investment advice specific to their situation before making any financial investment decision.
 
FxGrow Daily Technical Analysis – 05th Jan, 2017
By FxGrow Research & Analysis Team

Oil Plunges Over Doubts of OPEC Allocated Quotas Commitment, Awaiting US Inventories
crudeoil_zpsny1zfkxk.png


Crude oil started 2017 with a significant rally reaching 56.22 March-2015-fresh-highs following 2016 finale as OPEC reaches final decision regarding allocating shared quotas by OPEC and NON-OPEC cartel producers. Oil prices bulls were under one condition, monitoring production shares as decided without cheating, although doubts were aroused on how far the members will stick to the so anticipated OPEC-deal taking previous history of non compliance. The first domino stone that fell was the Kurds after comments by Iraqi oil minister Haider Al-Abadi delivering on late-Tuesday, citing that the Kurdish region was exporting more than its allocated share of oil as the country seeks to abide by OPEC output cut deal that kicked-in on Jan 1.

Iraqi PM noted, “The region is exporting more than its share, more than the 17 percent stated in the budget.”

Under the terms of the 2017 budget, which passed despite a boycott from a key Kurdish party, the autonomous region is allocated 250,000 bpd exports from oilfields under its control.

Other Rumors on CNBC livesquawk Russia will not start oil cuts until they see proven actions by OPEC.
Yesterday, The American Petroleum Institute (API) has reported a sizable draw on U.S. crude oil inventories, down 7.4 million barrels over the previous week—a much larger draw that expected, and the fifth draw in seven weeks.

Analysts expected a draw of around 1.7-2.2 million barrels for the week, and right ahead of the API data dump, oil prices responded upwards nearly 2 percent, in anticipation of a draw on a smaller scale.

Crude oil prices has entered a vague tunnel with too many factors affecting oil levels.

1- OPEC and Non-OPEC cut production.

2- OPEC and Non-OPEC commitment and compliance to allocated oil production Quotas.

3- US crude inventories that will be published today at 4:00 PM GMT will either support oil bulls or add further losses to price levels.

If OPEC and Non-OPEC cartels combined their efforts respecting cut production with further monitoring, then we will witness new high levels at 2017.

Trend: Sideways

Resistance level : R1 53.84, R2 55.20, R3 56.81

Support levels : S1 52.41, S2 51.74, S3 50.92

Remark : look forward for US crude inventories today scheduled for a release at 4:00 PM GMT.

For more in depth Research & Analysis please visit FxGrow.http://fxgrow.com/analysis-educatio...cal-analysis-fxgrow-free-forex-analysis-tools

Note: This analysis is intended to provide general information and does not constitute the provision of INVESTMENT ADVICE. Investors should, before acting on this information, consider the appropriateness of this information having regard to their personal objectives, financial situation or needs. We recommend investors obtain investment advice specific to their situation before making any financial investment decision.
 
FxGrow Daily Technical Analysis – 06th Jan, 2017
By FxGrow Research & Analysis Team

USD/CAD Dips on Weaker US Dollar, Awaiting NFP
USDCAD_zpsesgeped7.png


The loonie extended hawkish tone against its south greenback neighbor. USD/CAD dilated the bearish momentum further more, dropping yesterday from 1.3456 high, and landed today on 1.3254 low, currently trading 1.3292 intraday. Canadian dollar took advantage first on weaker US index performance after strong tone by the US fed on Trump's fiscal policy boost, warning that it might poses inflation risk. As a result, the US index sank today to 101.73 15-Dec-fresh-lows, currently trading 102.26. Second, crude oil prices sustaining 53 levels which boosted the loonie further more.

Trend: Bearish Sideways

Key levels to watch : Weekly Pp 1.3477

Resistance levels : R1 1.3318, R2 1.3360, R3 1.3400, R4 1.3441

Support levels : S1 1.3277, S2 1.3244, S3 1.3202, S4 1.3171

Remark : USD/CAD is highly volatile today due first to US index levels, second crude oil inventories today that will settle oil levels which will impact Canadian economy, third US NFP report tomorrow, finally Canadian local data represented by the trade balance and employment rate. These are the main fundamentals that will effect USD/CAD cable. Price levels above R2 will shift the pair to bullish trend and will spark further bulls towards R3 level. On the other hand, long positions below S1 will favors additional wash towards S2 and S3 levels.

For more in depth Research & Analysis please visit FxGrow.http://fxgrow.com/analysis-educatio...cal-analysis-fxgrow-free-forex-analysis-tools

Note: This analysis is intended to provide general information and does not constitute the provision of INVESTMENT ADVICE. Investors should, before acting on this information, consider the appropriateness of this information having regard to their personal objectives, financial situation or needs. We recommend investors obtain investment advice specific to their situation before making any financial investment decision.
 
FxGrow Daily Technical Analysis – 06th Jan, 2017
By FxGrow Research & Analysis Team

Trade on US NFP news today, Technical Levels to Watch
6-jan_zpsxqvazfod.jpg


NFP is released by Bureau of Labor Statistics. It measures change in the number of employed people during the previous month, excluding the farming industry. This is vital economic data released shortly after the month ends. The combination of importance and earliness makes for hefty market impacts. When NFP is released, the market is highly volatile shortly before and after the release.

EUR/USD technical levels to watch:

Resistance levels : R1 1.0626, R2 1.0679, R3 1.0732, R4 1.800

Support levels : S1 1.0547, S2 1.0478. S3 1.0420, S4 1.0354

Remark : R2 and S2 levels are the psychological levels where they both will support bulls and bears attacks.
GBP/USD technical levels to watch :

Resistance levels : R1 116.23, R2 117.43, R3 118.37

Support levels : S1 114.84, S2 114.15, S3 112.83

Remark : long positions above R1 will boost further rallies to previous high levels (R2&R3). S1 is a hard level, any penetration will prevail further dips towards S2&S3 levels.

USD/CHF technical levels to watch:

Resistance levels : R1 1.0146, R2 1.0212, R3 1.0291

Support levels : S1 1.0081, S2 1.0006, S3 0.9934
USD/CAD technical levels to watch :

Resistance levels : R1 1.3277, R2 1.3396, R3 1.3400, R4 1.3455

Support levels : S1 1.3235, S2 1.3202, S3 1.3157, S4 1.3080

Remark: The cable is highly volatile due to crude oil levels + US NFP today + Canadian local data

AUD/USD technical levels to watch :

Resistance levels : R1 0.7369 , R2 0.7439, R3 0.7496, R4 0.7564

Support levels : S1 0.7259, S2 0.7198, S3 0.7135, S4 0.7064

Remark : long positions under S1 will increase further selloffs and wash towards lower supporr levels. On the other hand stalling above R1 will trigger further confidence for Aussie and bullish attack towards R2 & R3.

NZD/USD technical levels to watch :

Resistance levels : R1 0.7072 , R2 0.7153, R3 0.7223

Support levels : S1 0.6967 , S2 0.6885, S3 0.6808

Gold Technical levels to watch :

Resistance levels : R1 1181.25, R2 1193.14, R3 1202.70, R4 1214.07

Support levels : S1 1170.26, S2 1160.79, S3 1149.92, S4 1136.94

Remark : Gold or XAUUSD is highly volatile against US dollar. Long positions above R1 will favor more bullish trend towards R2 level which is articular and above it with targets towards R3, but be careful for a set back from R2 level on the first test. Below S2 level, gold will turn bearish and more wash towards S3&S4.

For more in depth Research & Analysis please visit FxGrow.http://fxgrow.com/analysis-educatio...cal-analysis-fxgrow-free-forex-analysis-tools

Note: This analysis is intended to provide general information and does not constitute the provision of INVESTMENT ADVICE. Investors should, before acting on this information, consider the appropriateness of this information having regard to their personal objectives, financial situation or needs. We recommend investors obtain investment advice specific to their situation before making any financial investment decision.
 
FxGrow Daily Technical Analysis – 09th Jan, 2017
By FxGrow Research & Analysis Team

EUR/USD Twitches on Confusing US Dollar, Awaiting Local Data
EURUSD_zpsokzh9qpc.png


EUR/USD is confusing the market and traders are finding hard time to predict the cable trend. On Friday, USD awaited major news and NFP was the main focus but what was unexpected is the mix data between negative NFP scoring 156K compared to 204K previously, and positive unemployment rate at 4.7%. But lets re-visit what happened shortly before Friday's US news, the FOMC minute meeting on Wednesday raising doubts that Trump fiscal might poses inflation risk. As a result, the US index dropped heavily from 103.42 high, hitting 101.30 13-Dec-fresh-low. Currently, US index is showing signs of recovery, trading 102.39. EUR/USD is currently trading 1.0520 after peeking to 1.0622 on Friday.

Trend : Bearish Sideways

Key levels to watch : Weekly Pp 1.0499

Resistance levels : R1 1.0545, R2 1.0572 , R3 1.0622

Support levels : S1 1.0514, S2 1.0481, S3 1.0426

Remark : keep an eye on US index which has turned strong again awaiting further economic data. Closing above R1 will spark further attacks above R2&R3 levels. On the other hand, stalling near S2 level will depress EUR/USD level and wash towards S3 level.

For more in depth Research & Analysis please visit FxGrow.http://fxgrow.com/analysis-educatio...cal-analysis-fxgrow-free-forex-analysis-tools

Note: This analysis is intended to provide general information and does not constitute the provision of INVESTMENT ADVICE. Investors should, before acting on this information, consider the appropriateness of this information having regard to their personal objectives, financial situation or needs. We recommend investors obtain investment advice specific to their situation before making any financial investment decision.
 
FxGrow Daily Technical Analysis – 09th Jan, 2017
By FxGrow Research & Analysis Team

Australian Dollar Poised ahead of Local Data
AUDUSD_zpsiatyhzi7.png


The Aussie strengthened on Friday after a remarkable surge on local trade balance release scoring 1.24B compared with -1.12B on previous session which energized AUD/USD clocking a high 0.7354. The pair couldn't foothold the 0.73 level as US index reclaimed the reins peeking to 102.30 high right before it dropped to 101.30 13-Jan-fresh-lows on Thursday after FOMC late meeting with comments that Trump's policy withholds the possibility of inflation risk being bullish at highly pace. AUD/USD opened with a strong tone with positive building approvals giving the Aussie additional boost as the pair peeked to 0.7327 ignoring US index which is trading 102.41 intraday. Australian dollar awaits local retail sales tomorrow early morning, 12:30 AM GMT, shortly followed by Chinese CPI which could give further charge for the Aussie facing strong US dollar.

Trend : Bullish Sideways

Resistance levels : R1 0.7342 , R2 0.7385, R3 0.7425, R4 0.7464

Support levels : S1 0.7299, S2 0.7261, S3 0.7213 S4, 0.7180

Remark : Keep an eye on Australian retail sales followed by Chinese CPI. R1 is 200 SMA, touching and stalling above it will fuel further rally bulls towards R2&R3 levels. Below S2 level rekindles bear trend forces & the cable will shift to bearish momentum.

For more in depth Research & Analysis please visit FxGrow.http://fxgrow.com/analysis-educatio...cal-analysis-fxgrow-free-forex-analysis-tools

Note: This analysis is intended to provide general information and does not constitute the provision of INVESTMENT ADVICE. Investors should, before acting on this information, consider the appropriateness of this information having regard to their personal objectives, financial situation or needs. We recommend investors obtain investment advice specific to their situation before making any financial investment decision.
 
FxGrow Daily Technical Analysis – 10th Jan, 2017
By FxGrow Research & Analysis Team

Gold Bulls Supported By Weaker USD and Disappointing Asian Data
Gold10_zpsvg2x38sg.png


Gold rallies is the talk of the market since Monday's early trading sessions. The yellow shiny metal is on best performance compared to all rivals and has proven once more being a safe haven when traders are disappointed with currencies performance. On Monday, US dollar was on weakest performance after peeking on 2017 to 103.81, the US index dropped yesterday to 101.84, then extended bearish momentum further more to 101.48, closing to 2017 lows 101.30. The collapsing USD was first boosted by comments late Wednesday FOMC's short meeting hinting that Trump's fiscal policy poses inflation risk, second by Boston Fed President Eric Rosengren calling for the U.S. central bank to step up its pace of interest rate increases from the once-a-year pattern, adding warns of inflation risks if it does not. As a result gold surged from 1171.99 low and peeked to 1186.22 high.

In early trading sessions, Asian markets data was disappointing first by Australian retail sales at 0.2% compared with 0.5% on previous sessions, second Chinese CPI scoring a shortage by 0.3% on 0.5% last session. This gave additional charge for gold to dilate bullish trend, clocking a high today 1187.69.

Trend : Bullish Sideways

Key levels to watch : Daily Pp 1180.33

Resistance levels : R1 1188.58, R2 1198.02, R3 1207.15

Support levels : S1 1180.14, S2 1170.02, S3 1159.71

Remark : Keep an eye on US index. Stalling above R1 will fuel further attacks towards R2&R3 levels and increase strong buying but be careful from false alarms and setbacks above 1188 as a first test. Closing below S2 level is needed to shift into bearish trend with additional selloffs towards S3 level.

For more in depth Research & Analysis please visit FxGrow.http://fxgrow.com/analysis-educatio...cal-analysis-fxgrow-free-forex-analysis-tools

Note: This analysis is intended to provide general information and does not constitute the provision of INVESTMENT ADVICE. Investors should, before acting on this information, consider the appropriateness of this information having regard to their personal objectives, financial situation or needs. We recommend investors obtain investment advice specific to their situation before making any financial investment decision.
 
FxGrow Daily Technical Analysis – 11th Jan, 2017
By FxGrow Research & Analysis Team

Sterling Shortens as US Dollar strengthens, Local Data in Sight
flaxbr.jpg


The curse of Brexit adds negative weight on UK pound further more as GBP/USD plunges yesterday 1.2107 Nov-2016-fresh-lows. British Pound took a short breath-break yesterday as the pair rallied to 1.2189 high, taking advantage of minor tripping US index sank to 101.84 low. US index recovered again in today in opening sessions causing further depression for the cable. GBP/USD made a first test on R1 1.2197, currently trading 1.2160, slightly above its daily Pp 1.2157

GBP awaits local data today with manufacturing production in spot light, scheduled at 9:30 AM GMT. Later today, governor Carney will make a speech on behalf of BOE discussing monetary policy.

Trend : Bearish

Key levels to watch : Daily Pp 1.2157

Resistance levels : R1 1.2197, R2 1.2264, R3 1.2363

Support levels : S1 1.2145, S2 1.2070 , S3 1.2018

Remark : Look forward for British local today today, later on Carney speech which can might give a positive injection for the pair depending on the outcomes. also Trump's speech today at 4:00 PM GMT which will impact US index levels.

For more in depth Research & Analysis please visit FxGrow.http://fxgrow.com/analysis-educatio...cal-analysis-fxgrow-free-forex-analysis-tools

Note: This analysis is intended to provide general information and does not constitute the provision of INVESTMENT ADVICE. Investors should, before acting on this information, consider the appropriateness of this information having regard to their personal objectives, financial situation or needs. We recommend investors obtain investment advice specific to their situation before making any financial investment decision.
 
FxGrow Daily Technical Analysis – 12th Jan, 2017
By FxGrow Research & Analysis Team

Japanese Yen Sharpened on Collapsing US Dollars
j92681.jpg


USD/JPY was on a roller coaster yesterday before and after Trump's speech bringing back memories of US election but the scenario was less severe. On Wednesday, the pair rallied to 116.86 high as analysis expected USD will strengthen on Trump's speech but the president, instead of giving the supposed speech, he made an attack on local US companies causing a major loss of their stock value which shortened US dollar as the Index tumbled from 102.96 and anchored at 101.16 today. Yen received additional charge with positive local data first with bank lending added +0.2% to initial 2.4%, second the Japanese current account 180T while forecasts were 148T. As a result USD/JPY extended bearish momentum hitting 114.35 Dec-12-fresh-lows. The pair is currently trading 114.32, below daily Pp 115.50.

Trend: Bullish Sideways

Key levels to watch : Daily Pp 115.50

Resistance levels : R1 115.05, R2 115.89, R3 116.94, R4 117.94

Support levels : S1 113.90, S2 113.30, S3 112.70, S4 112.10

Remark: Keep an eye on heavy US data today and tomorrow both at 1:30 PM GMT. Also, Yellen's speech today at midnight on behalf of US FED. Price range between S1 and R1 but expect more volatility on economic data release. Long positions below S1 level, the cable will shift to bearish but be careful of false alarms as first test. A penetration for R2 level will rapid bull attacks forces towards R3&R4 levels.

All upcoming economic events are Automatically updated when new data is released.

For more in depth Research & Analysis please visit FxGrow.http://fxgrow.com/analysis-educatio...cal-analysis-fxgrow-free-forex-analysis-tools

Note: This analysis is intended to provide general information and does not constitute the provision of INVESTMENT ADVICE. Investors should, before acting on this information, consider the appropriateness of this information having regard to their personal objectives, financial situation or needs. We recommend investors obtain investment advice specific to their situation before making any financial investment decision.
 
Back
Top