Elliott Wave Analysis by Admiral Markets

EUR/USD Bullish Thrust Capped by Wedge Resistance

EUR/USD

4 hour

1zvqr9i.png

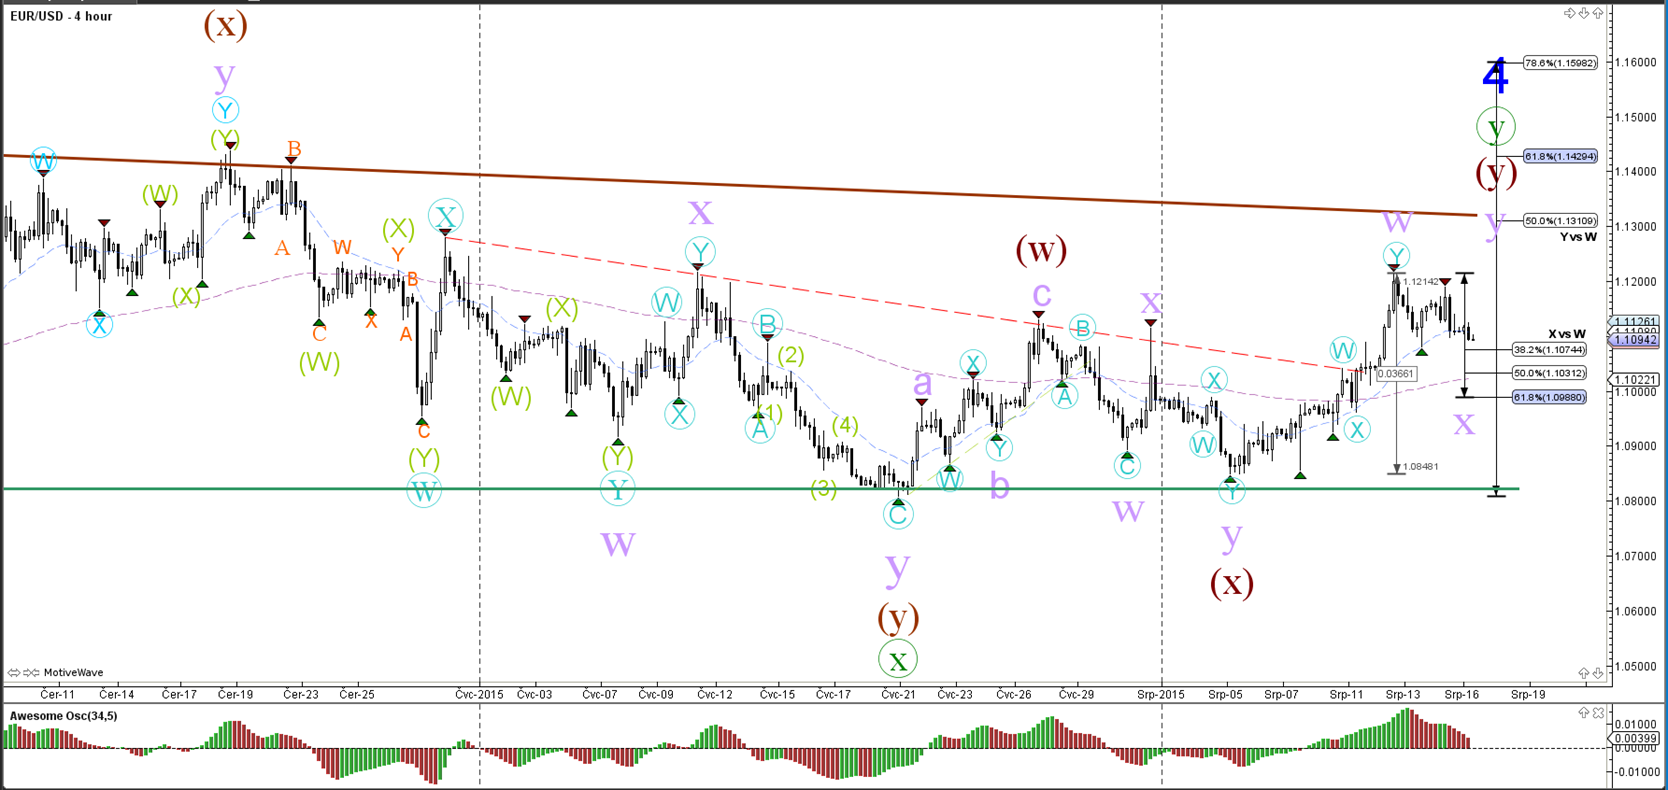
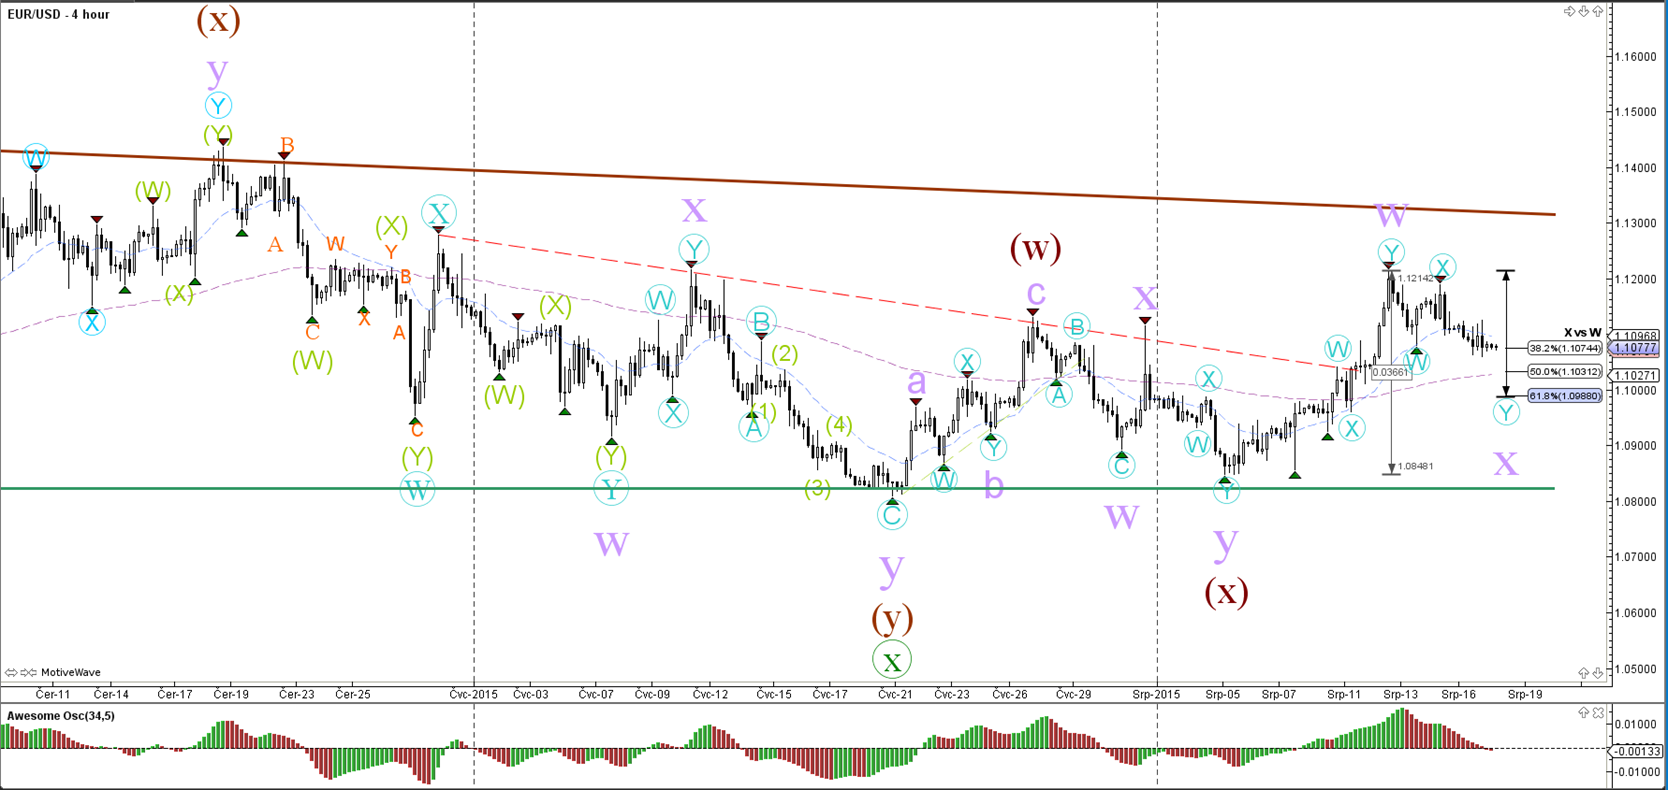
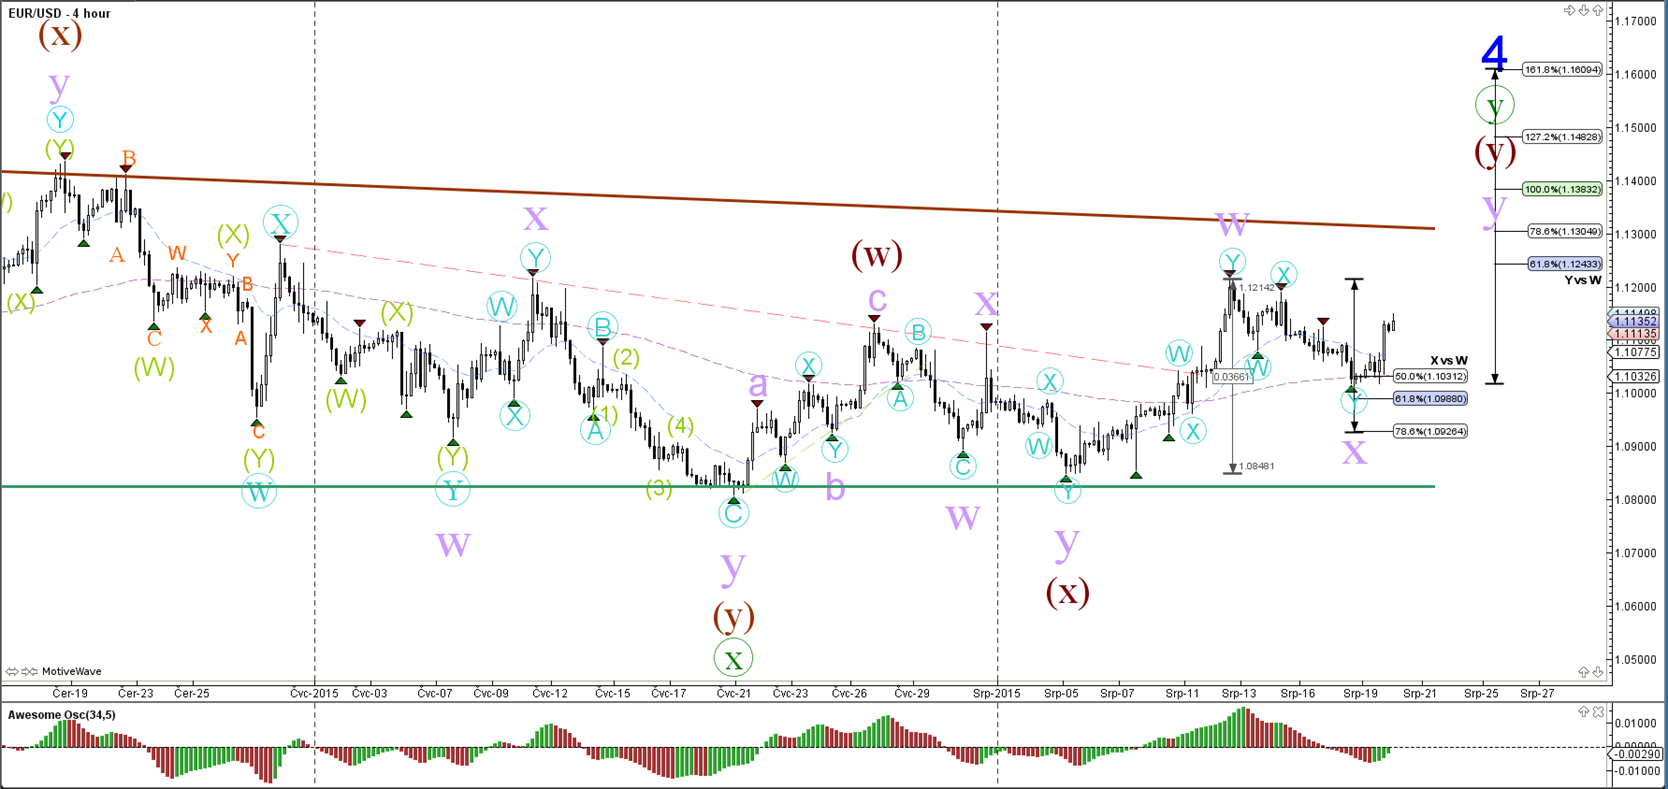
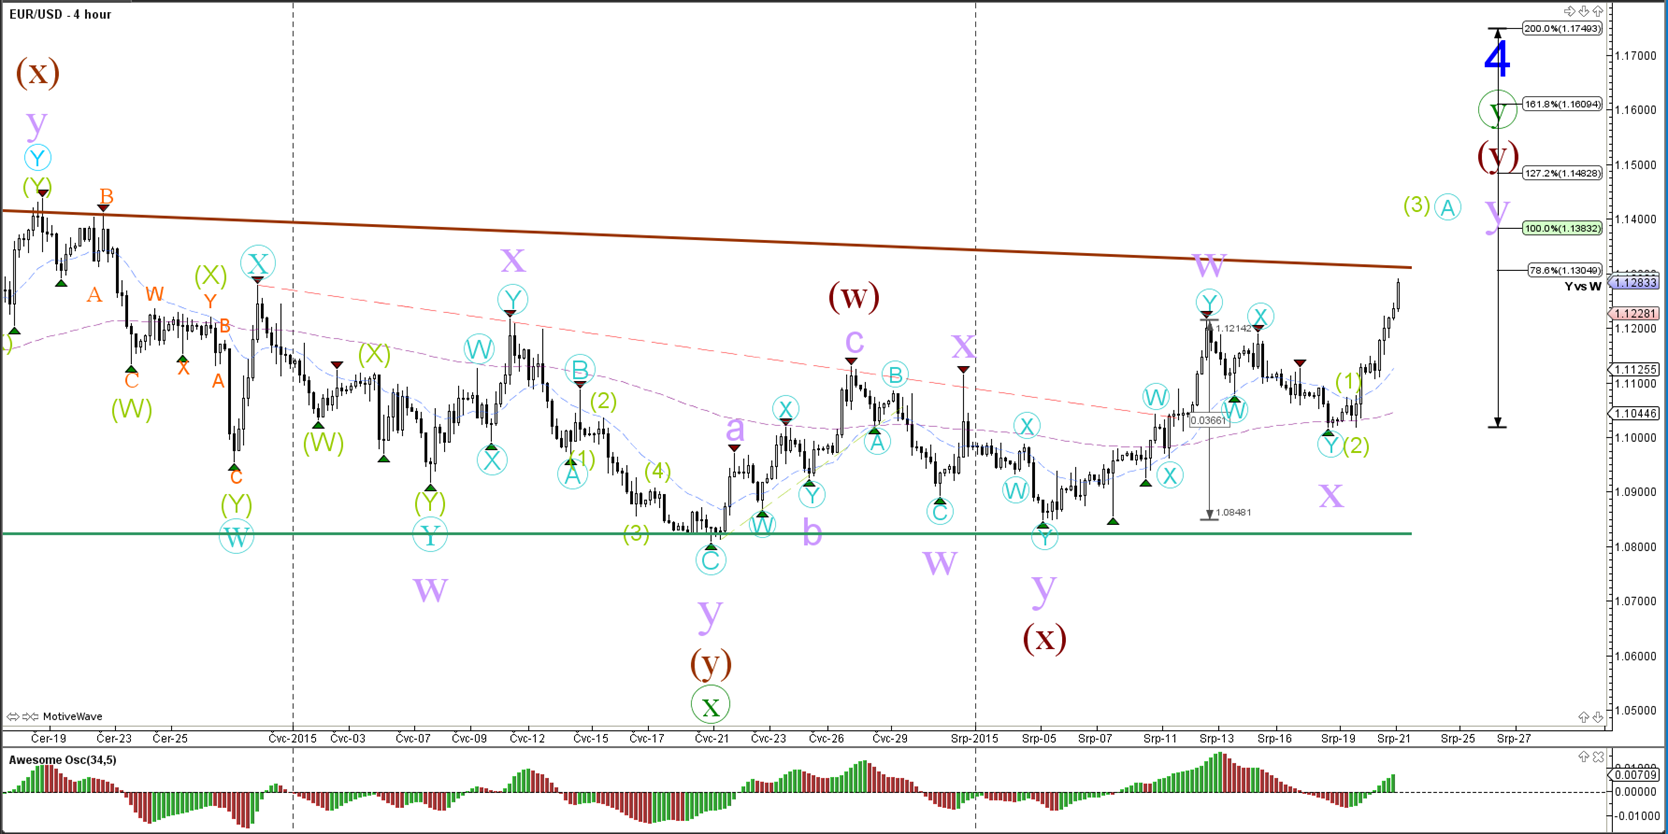
The EUR/USD broke above the internal resistance (red) within a bigger wedge (brown/green) which could be explained by a WXY wave pattern (purple). The top of wedge (brown) could be a major resistance spot.

1 hour

nbte8h.png

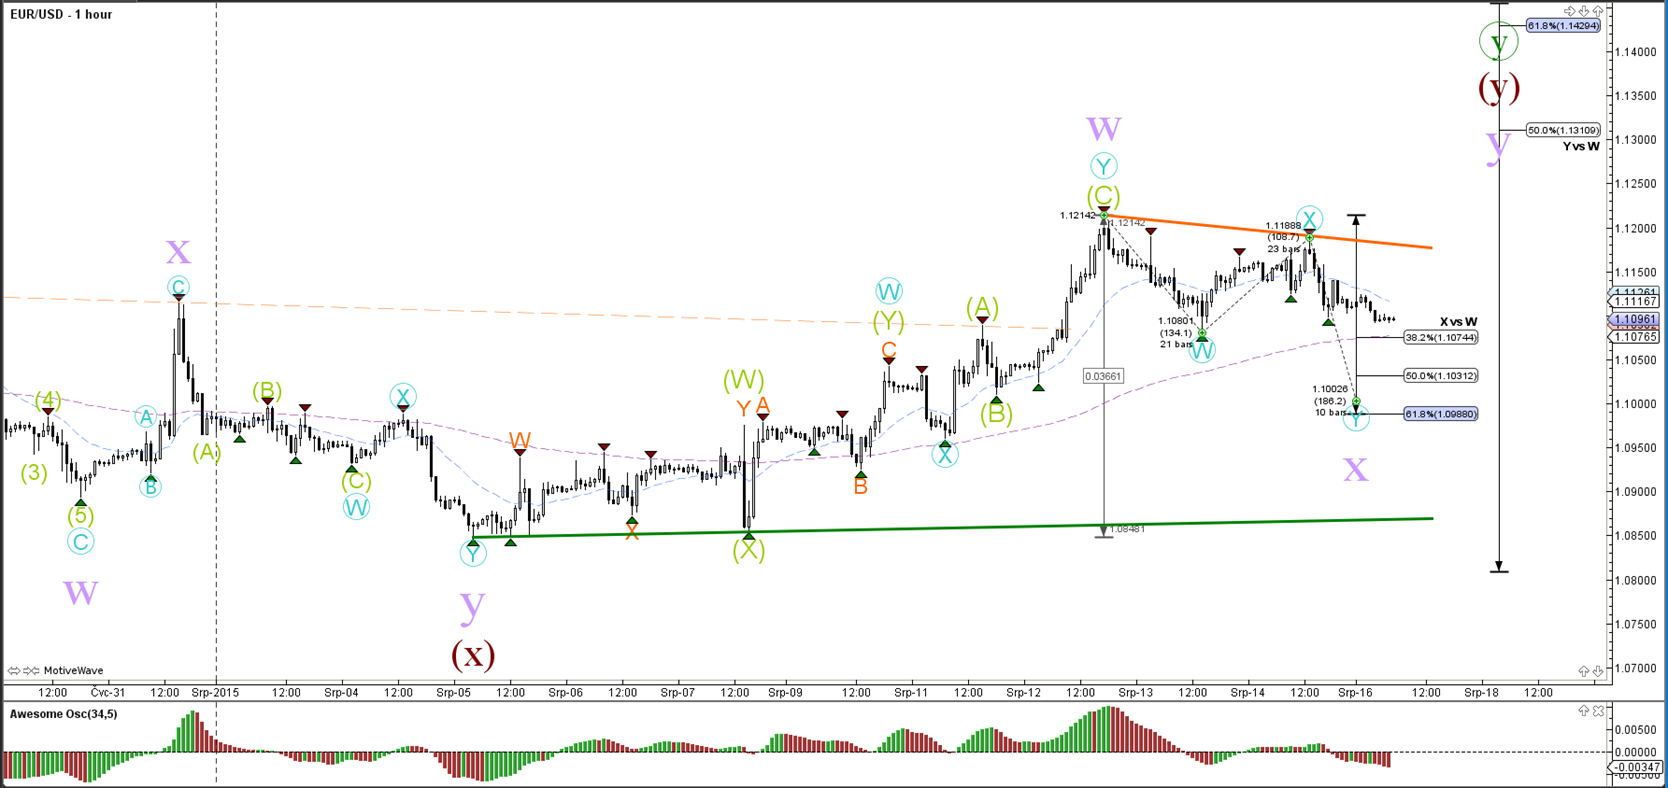
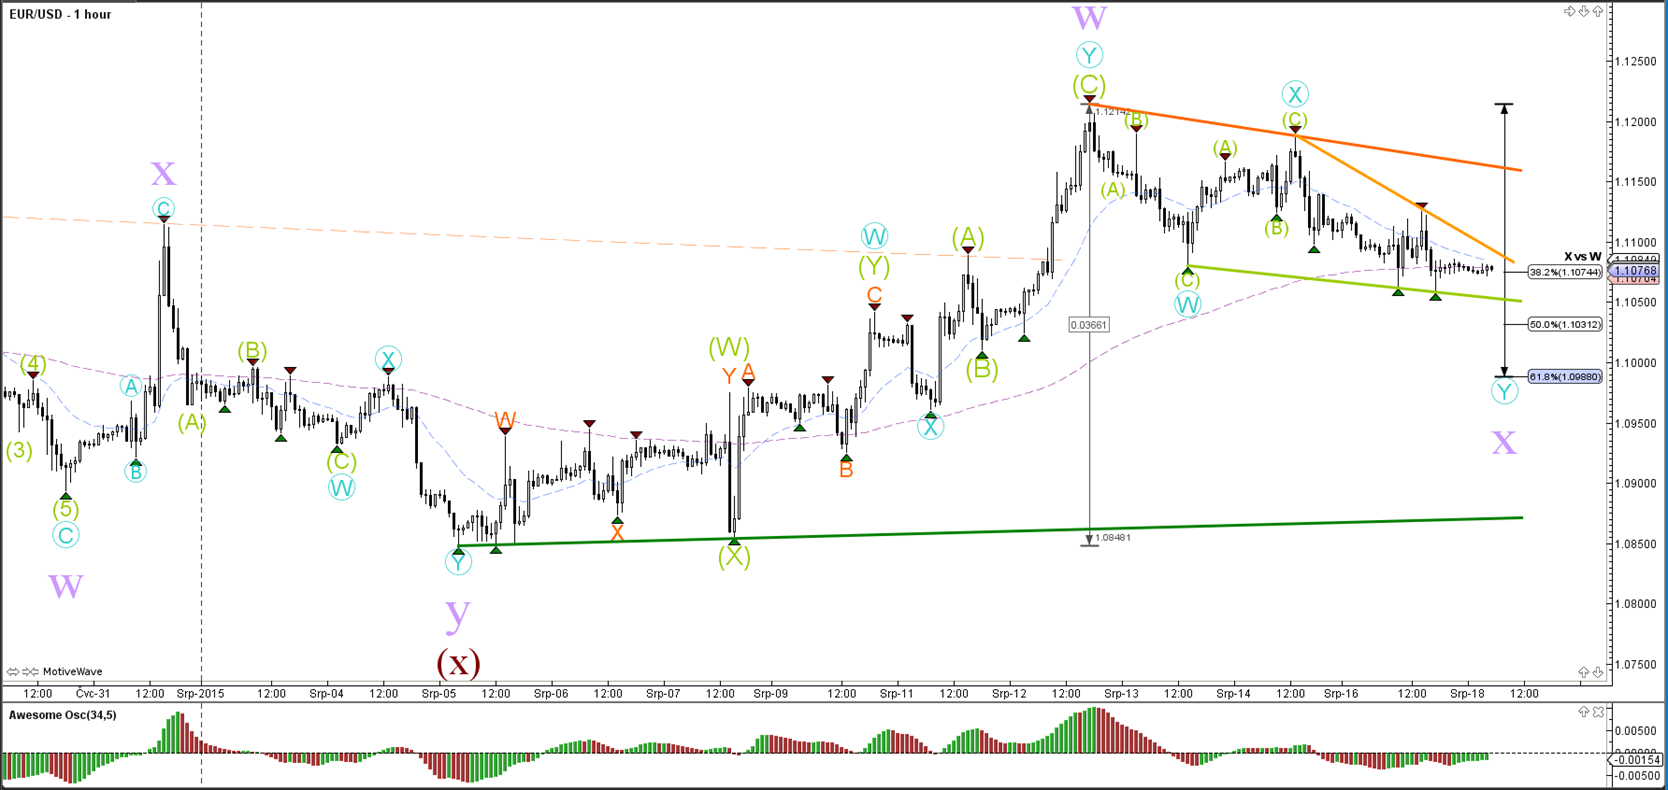
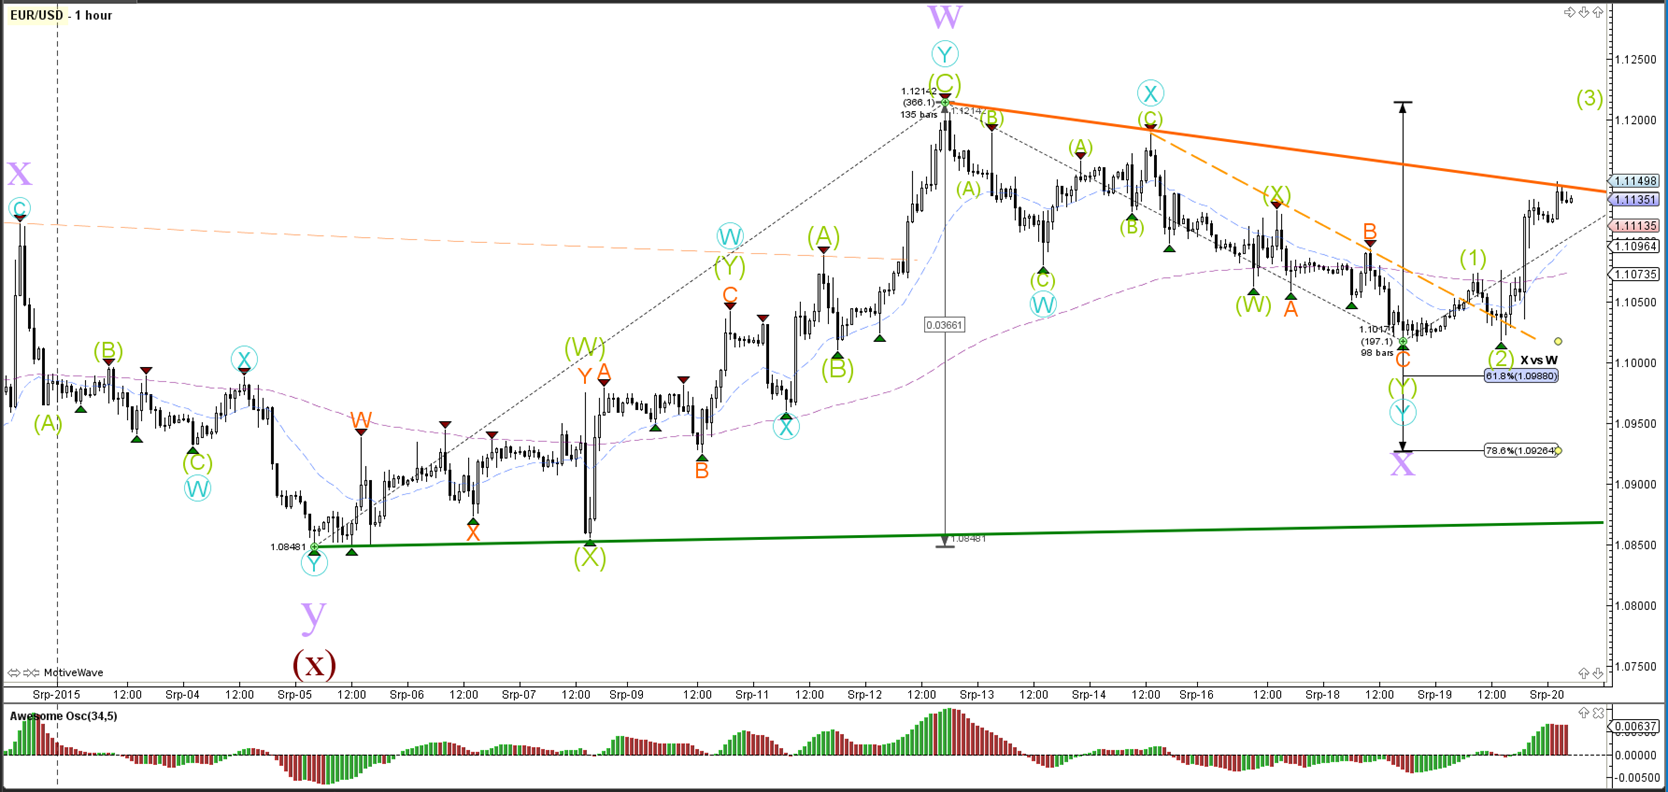
The EUR/USD bounced at the 38.2% Fibonacci retracement level of wave X (purple) and could be moving up as part of wave Y (purple).

GBP/USD

4 hour

2hringi.png

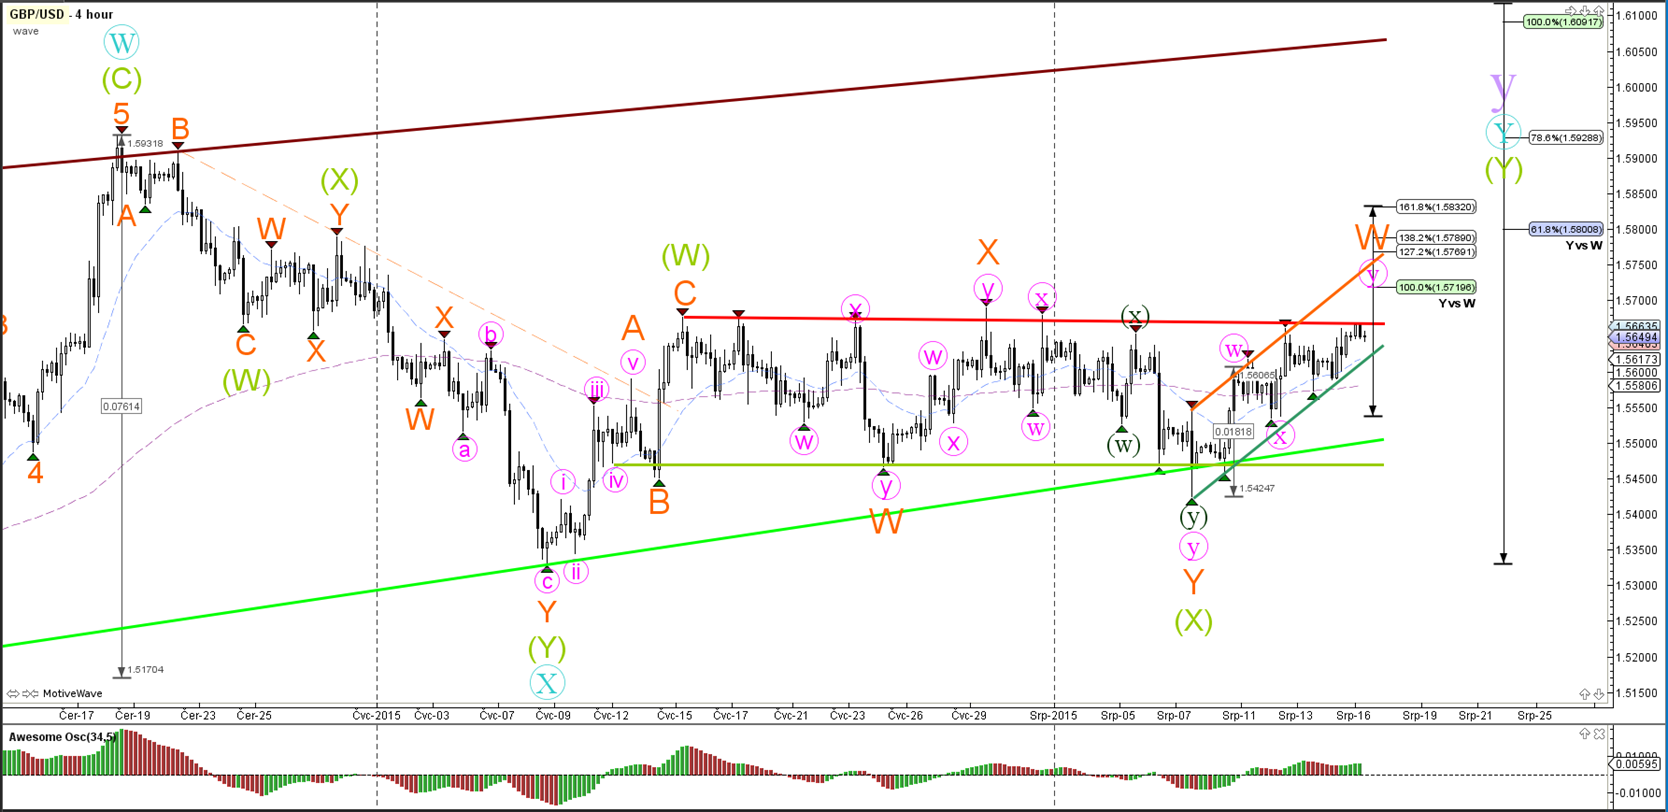
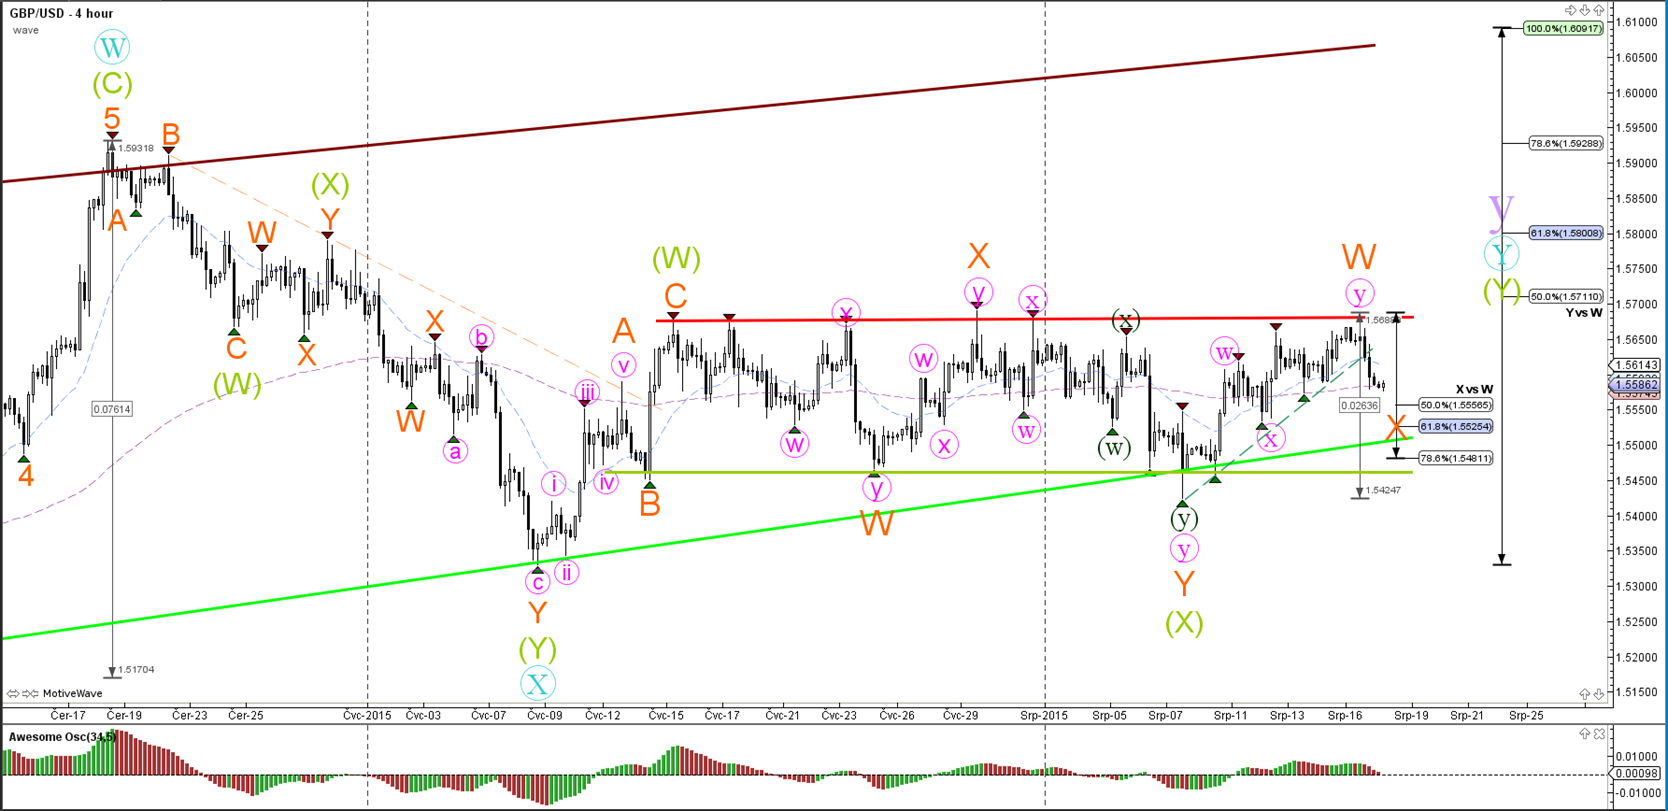
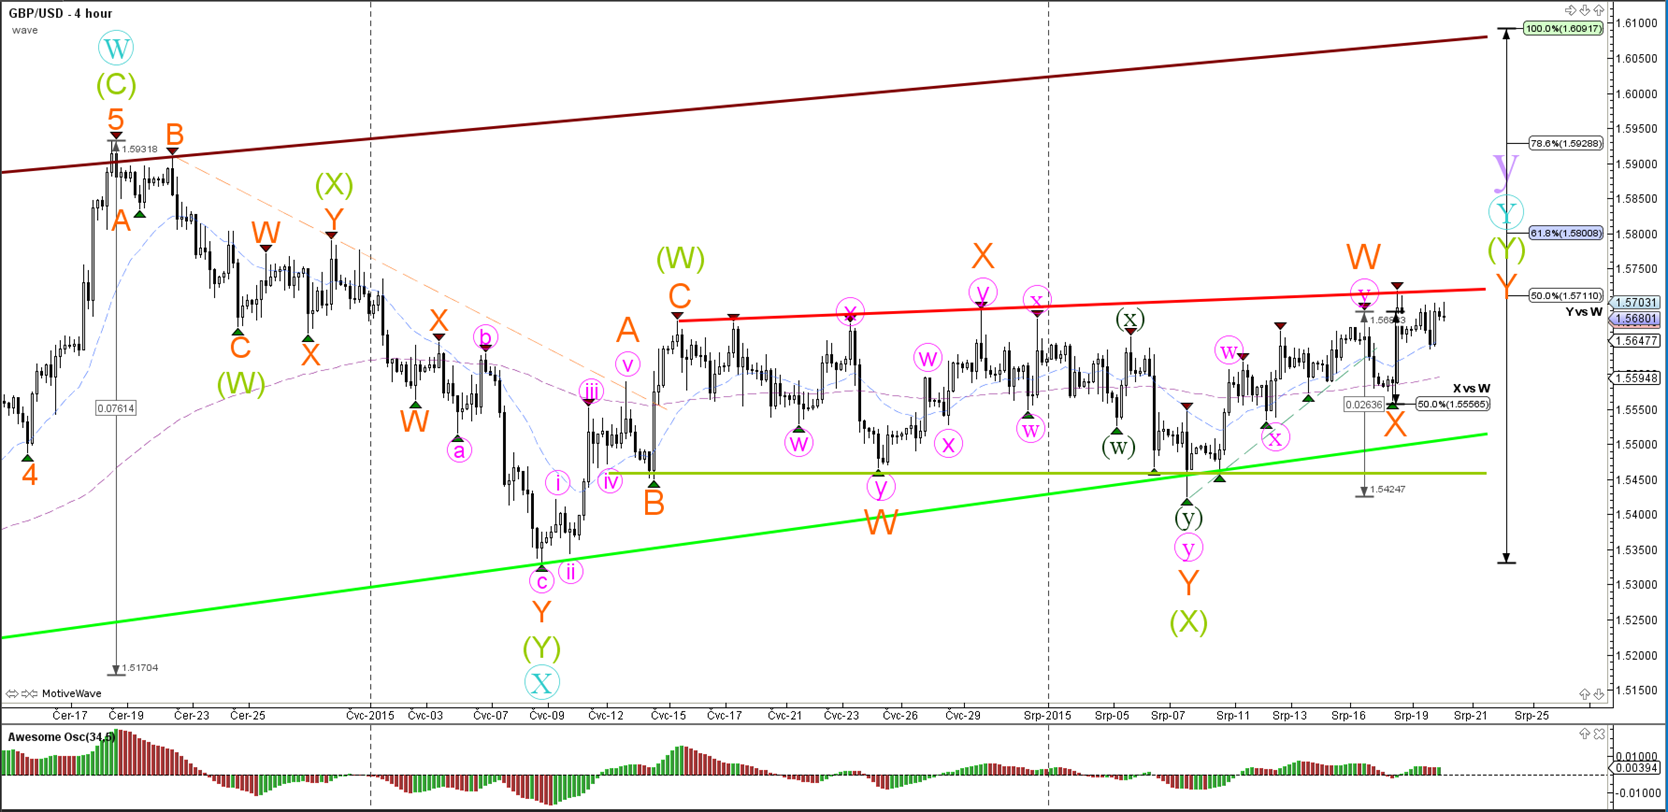
The GBP/USD remains positioned in a choppy range (red/green).

1 hour

21bjcis.png

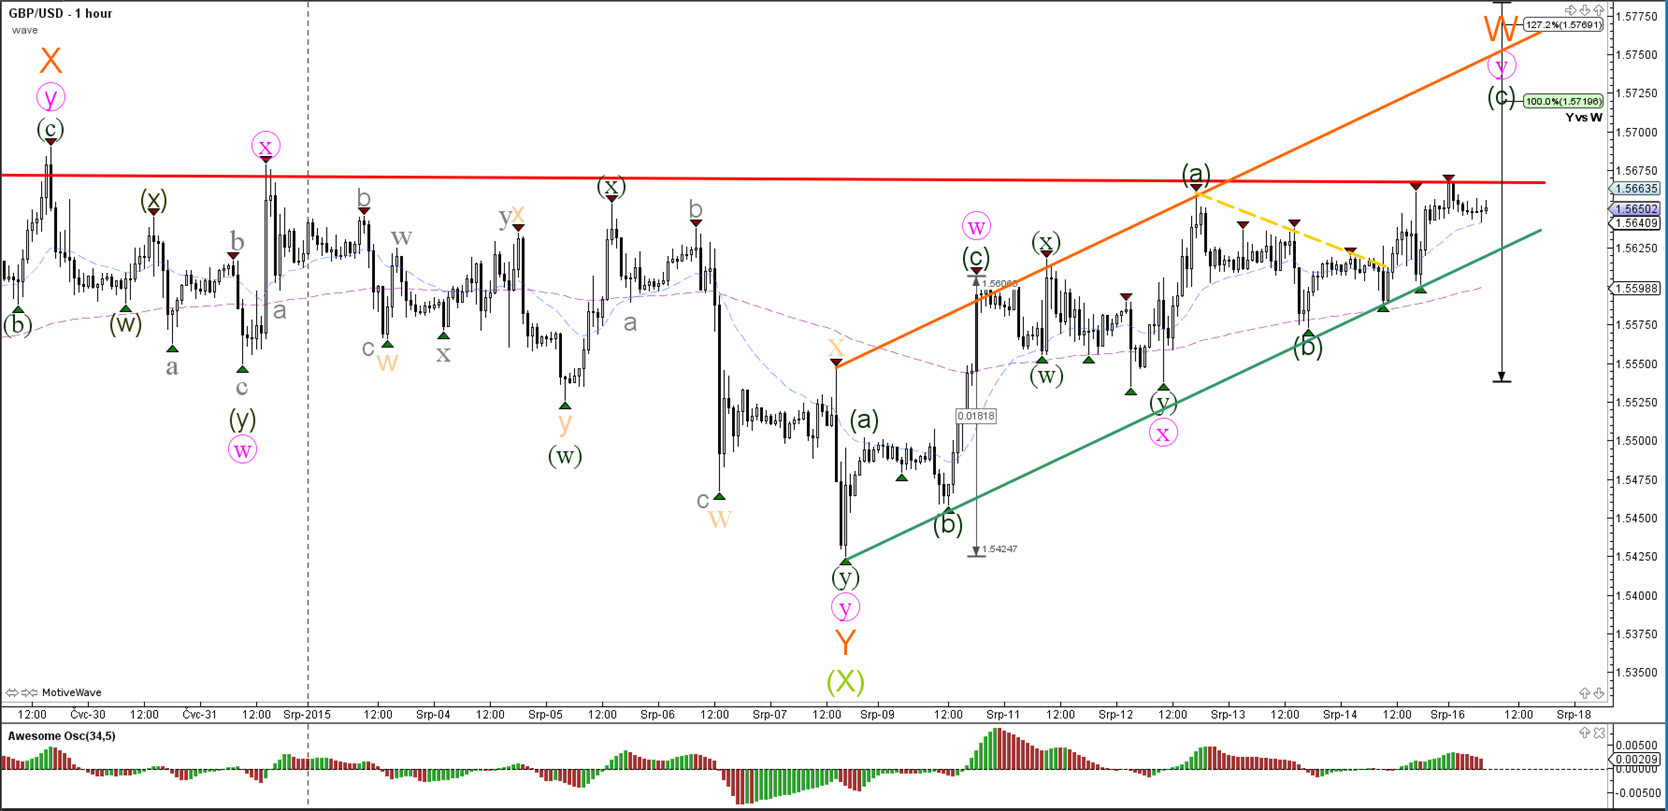
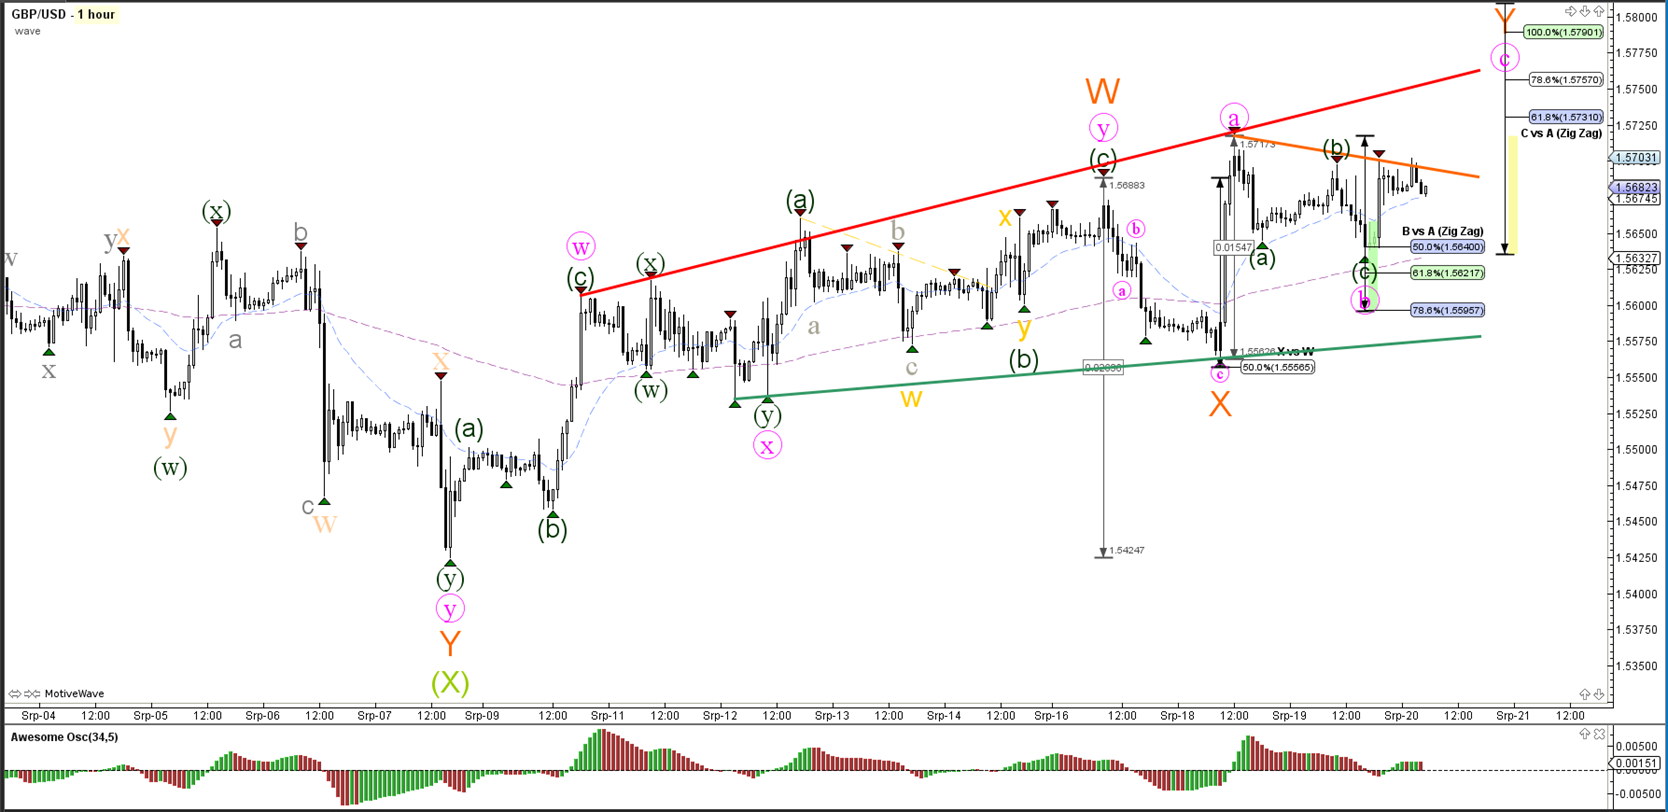
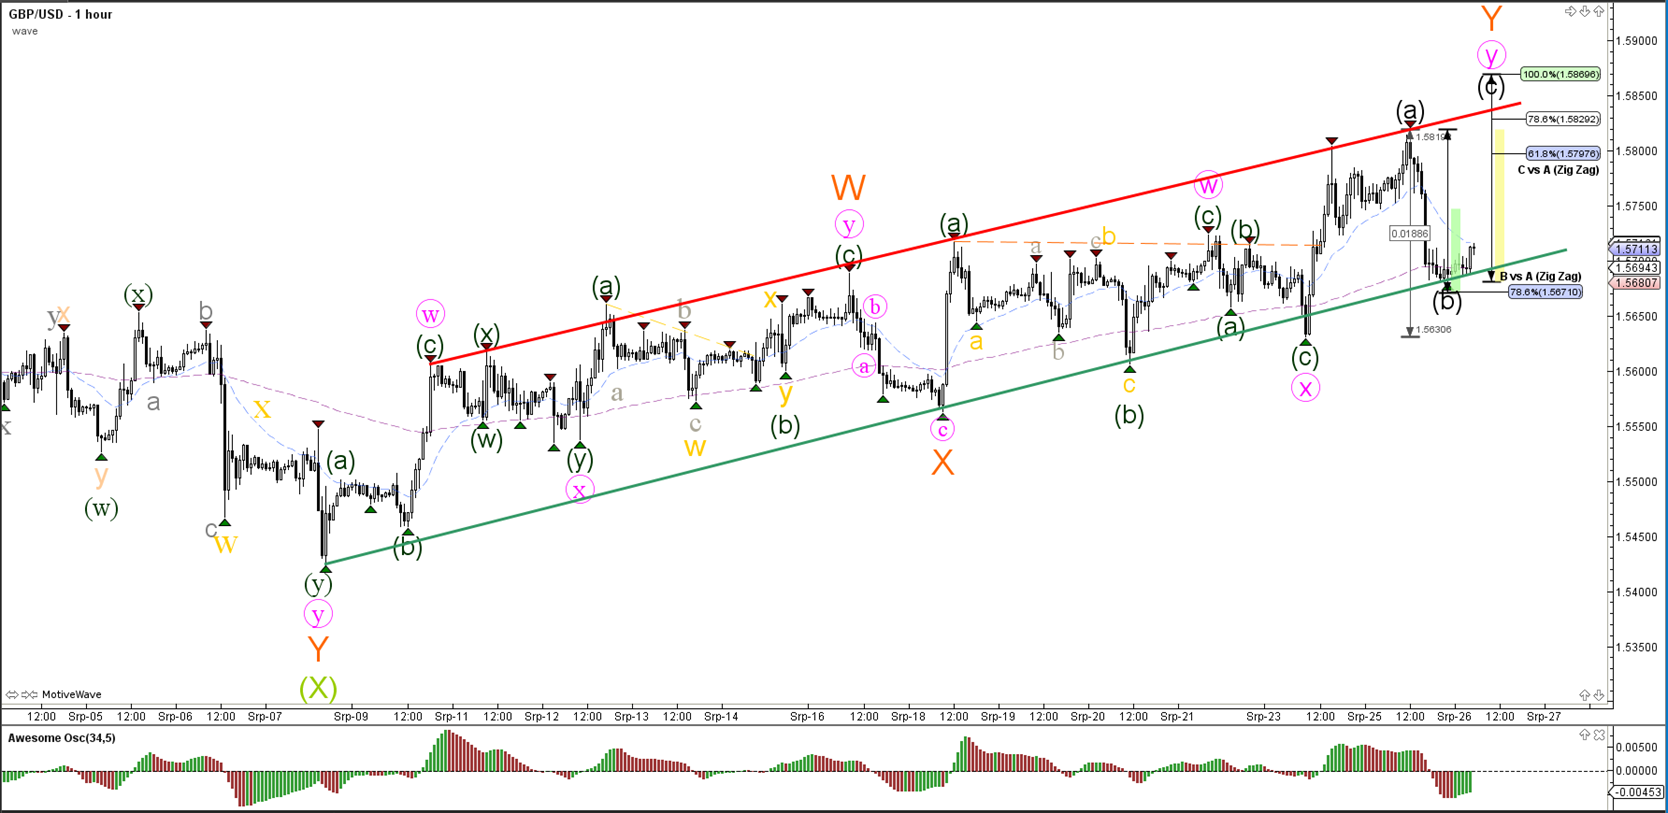
The GBP/USD made a bearish retracement back to the bottom of the uptrend channel (green). The ABC (dark green) wave count is invalidated if price breaks below the 100% point.

USD/JPY

4 hour

2h2i9sl.png

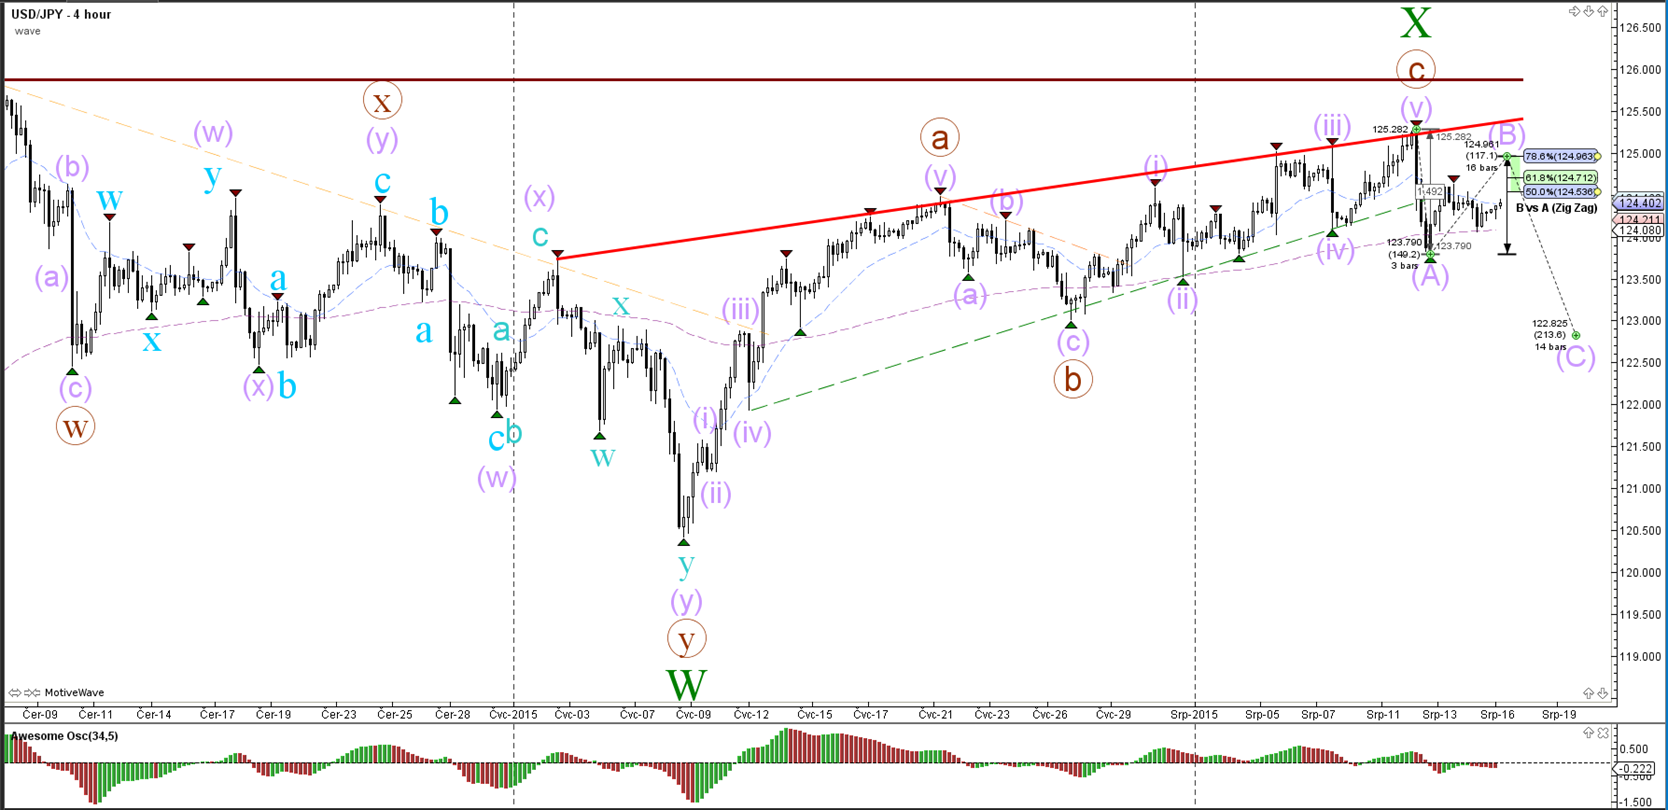
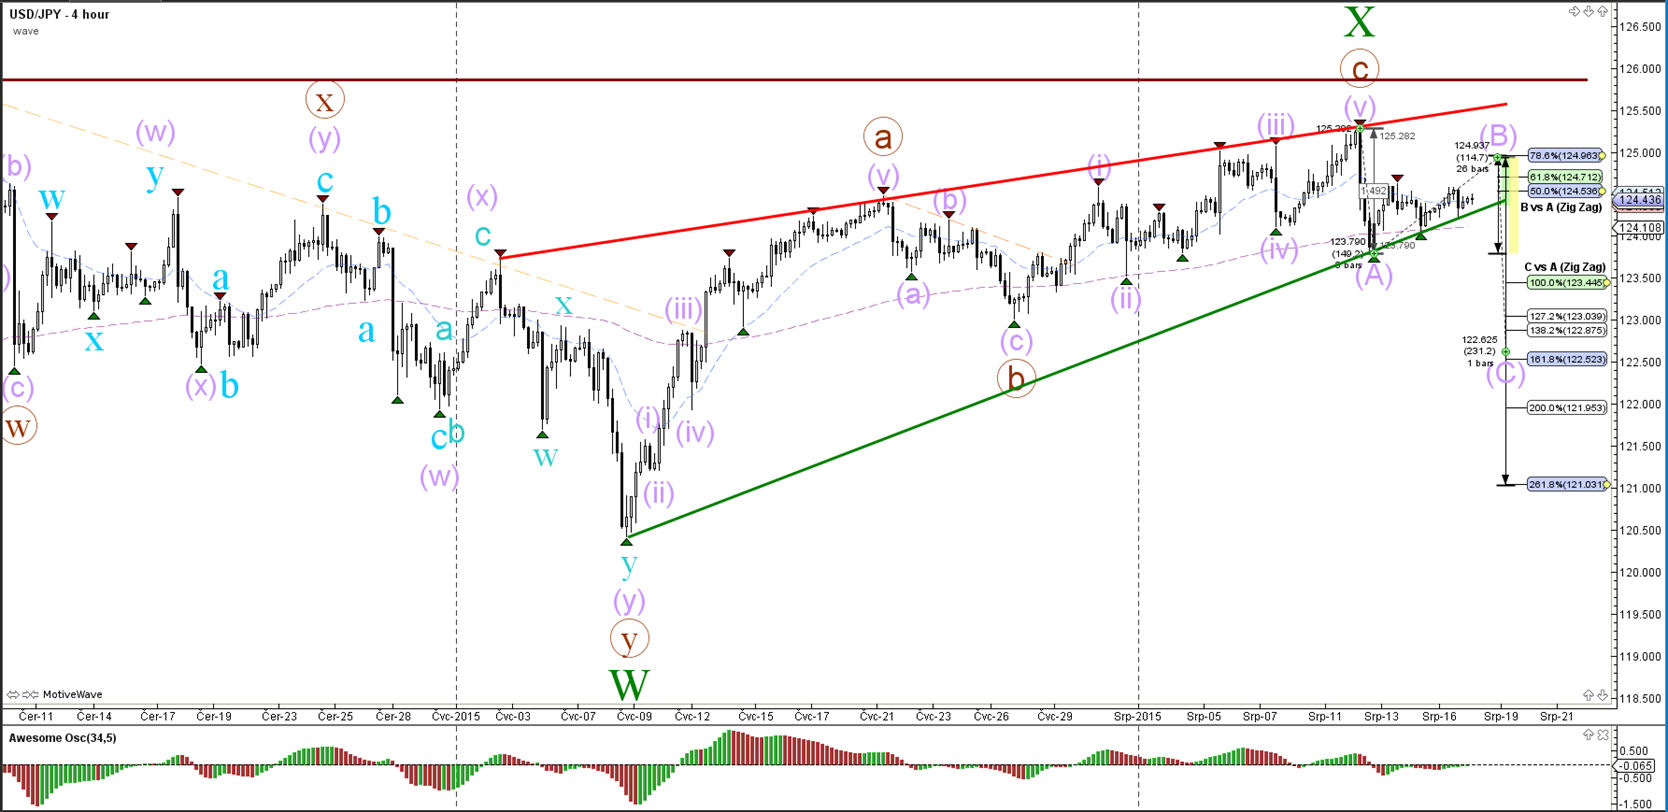
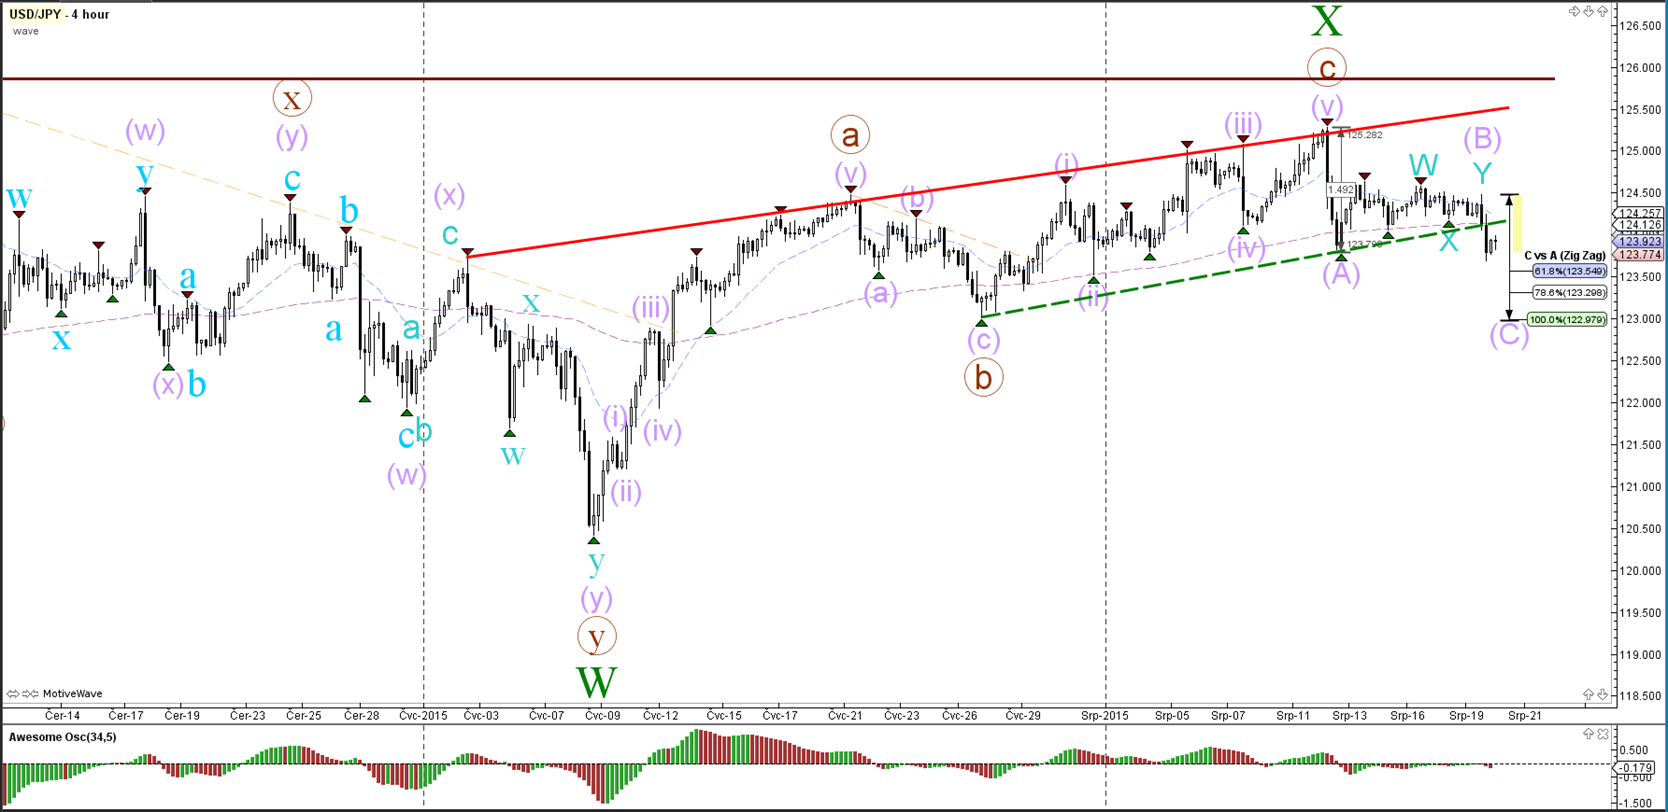
The USD/JPY broke below the support trend line (dotted green) close to the major top (brown). This could indicate a potential ABC correction with an invalidation level at the beginning of wave A (purple).


“Original analysis is provided by Admiral Markets
 
GBP/USD Reaches Resistance within Ascending Wedge Pattern

EUR/USD
4 hour


The EUR/USD seems to be building a bearish correction (wave X purple) within a bigger wedge formation (trend lines green and brown).

1 hour


The EUR/USD has clear levels that market the invalidation of wave X (purple) via the support (green) and resistance (orange).

GBP/USD
4 hour


The GBP/USD is in a wider uptrend channel as indicated by the light green and brown trend lines. A bullish breakout could complete the wave Y (magenta) pattern within the wave W (orange).

1 hour


The GBP/USD is in an uptrend channel but has a strong zone of resistance above it (red).

USD/JPY
4 hour


The USD/JPY broke below the support trend line (dotted green) close to the major top (brown). This could indicate a potential ABC correction with an invalidation level at the beginning of wave A (purple).


“Original analysis is provided by Admiral Markets
 
Major Currency Pairs Linger in Wedge Chart Patterns

EUR/USD

4 hour


The EUR/USD is in a middle of a wedge formation (trend lines green and brown). The most recent momentum was bullish and could therefore suggest a bullish wave count.

1 hour


The EUR/USD is building a slow bearish correction which resembles a falling wedge chart pattern (light orange and green trend lines).

GBP/USD

4 hour


The GBP/USD failed to break the resistance (red) yesterday which competed the wave W (orange). The Fibonacci levels of wave X (orange) and trend lines (green) are potential support levels.

1 hour


The GBP/USD broke below the support trend line (green) and could build a bigger zigzag correction within wave X (orange).

USD/JPY

4 hour


The USD/JPY is showing a rising wedge chart pattern, which is indicated by the support (green) and resistance (red) trend lines. A bearish break could price fall towards the wave C (purple) targets whereas a bullish break above the top (brown) would indicate an uptrend continuation and necessitate a wave count change.


“Original analysis is provided by Admiral Markets
 
USD Weakens and Meets Break or Bounce Spot

EUR/USD

4 hour


The EUR/USD bounced and rallied from the wave X (purple) support levels, which could indicate the potential start of wave Y (purple).

1 hour


Price is facing a break or bounce spot at the resistance trend line (orange).

GBP/USD

4 hour


The GBP/USD recently bounced at the 50% Fibonacci level as part of wave X (orange) but has not been able to break above resistance (red).

1 hour


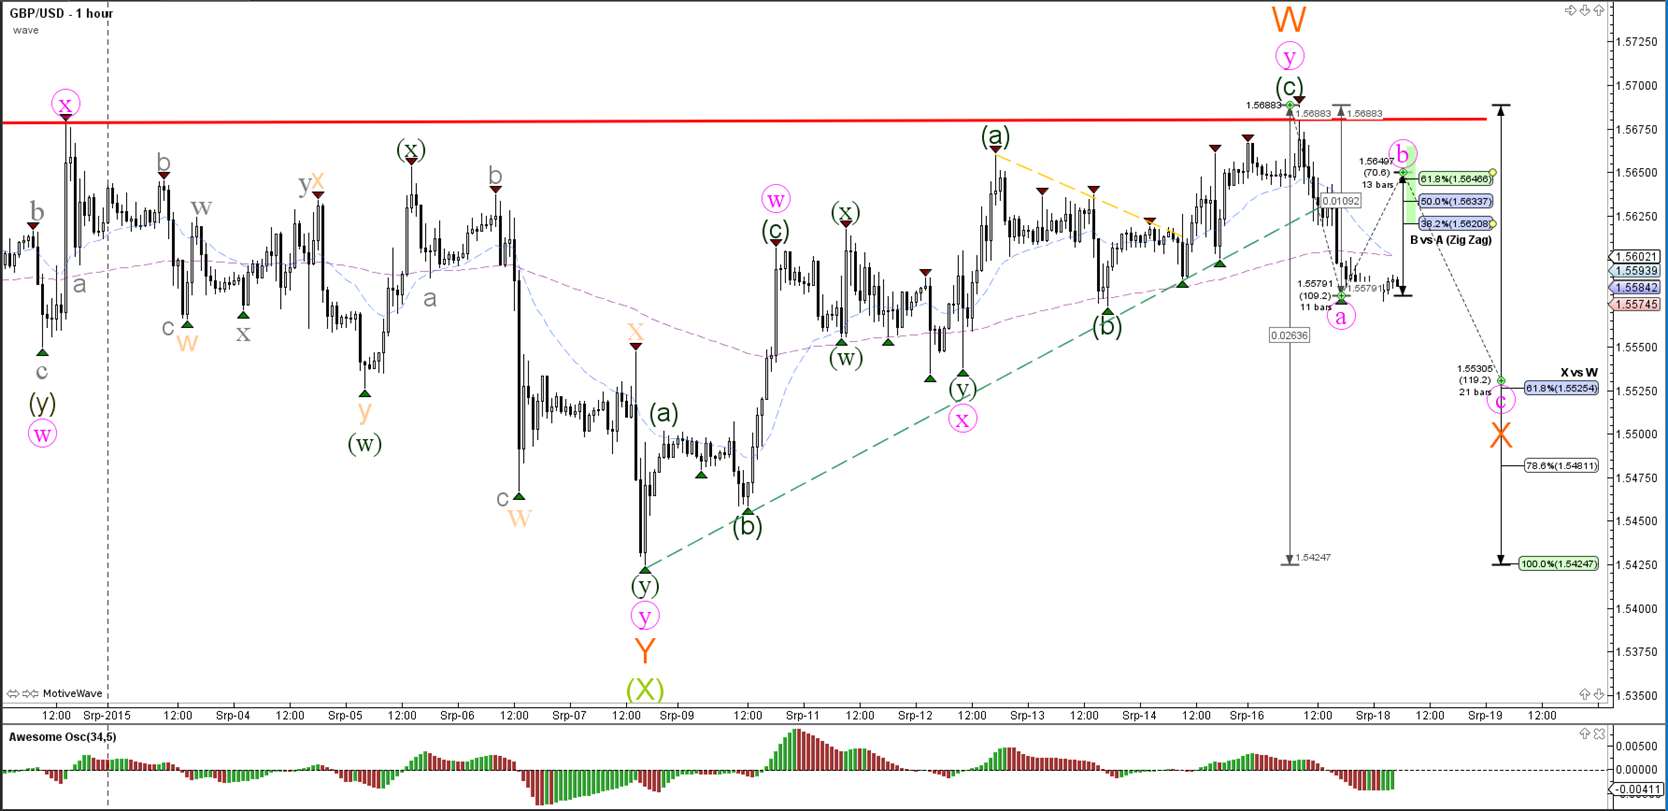
The GBP/USD completed an ABC correction within wave B (magenta) recently before bouncing up higher. Price is now at a break or bounce spot at the resistance trend line (orange).

USD/JPY

4 hour


The USD/JPY is continuing its ABC correction (purple) after failing to break above the top of wave X (green).


“Original analysis is provided by Admiral Markets
 
EURUSD and USDJPY Accelerate Momentum Within Wave 3

EUR/USD
4 hour


The EUR/USD is building on a bullish rally which is taking price to the top of the contracting wedge (brown/green lines).

1 hour


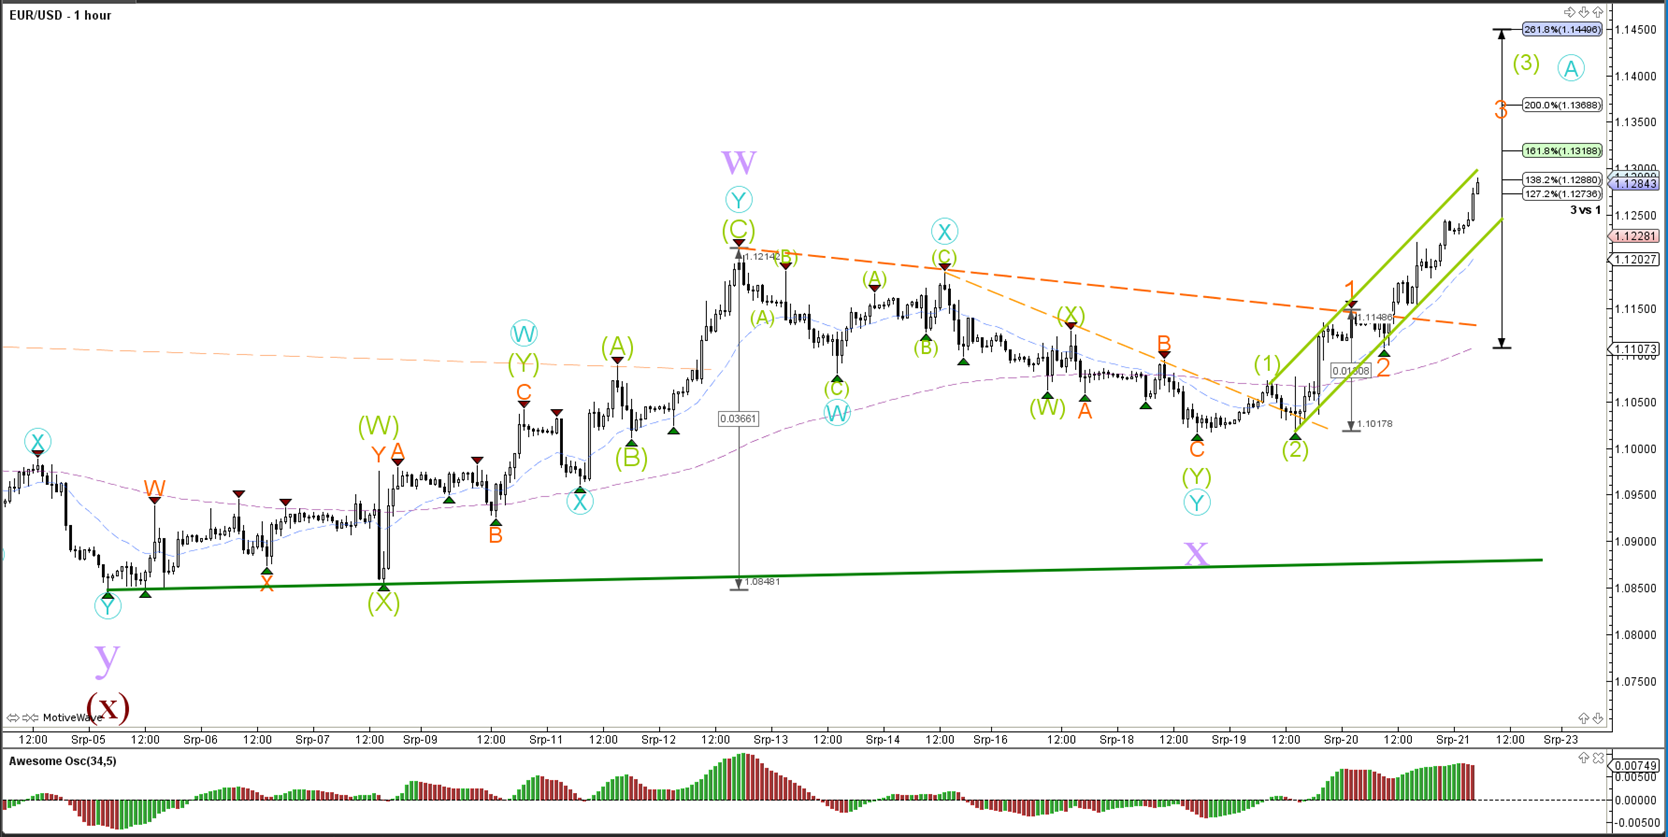
Price broke out of multiple resistance trend lines (dotted orange) and is now building a bullish channel (green lines). The speed of the movement suggests the potential for the wave count to be a wave 3 (orange) of wave 3 (green).

GBP/USD
4 hour


The GBP/USD has recently shown bullish impulsive price action (wave A magenta) but the top of the wedge acts as a major resistance (red).

1 hour


The GBP/USD is in a bullish channel which is indicated by the red and green trend lines. Price is now facing a resistance top (orange line). A bullish breakout could indicate the potential for price to move to one of the Fibonacci targets.

USD/JPY
4 hour


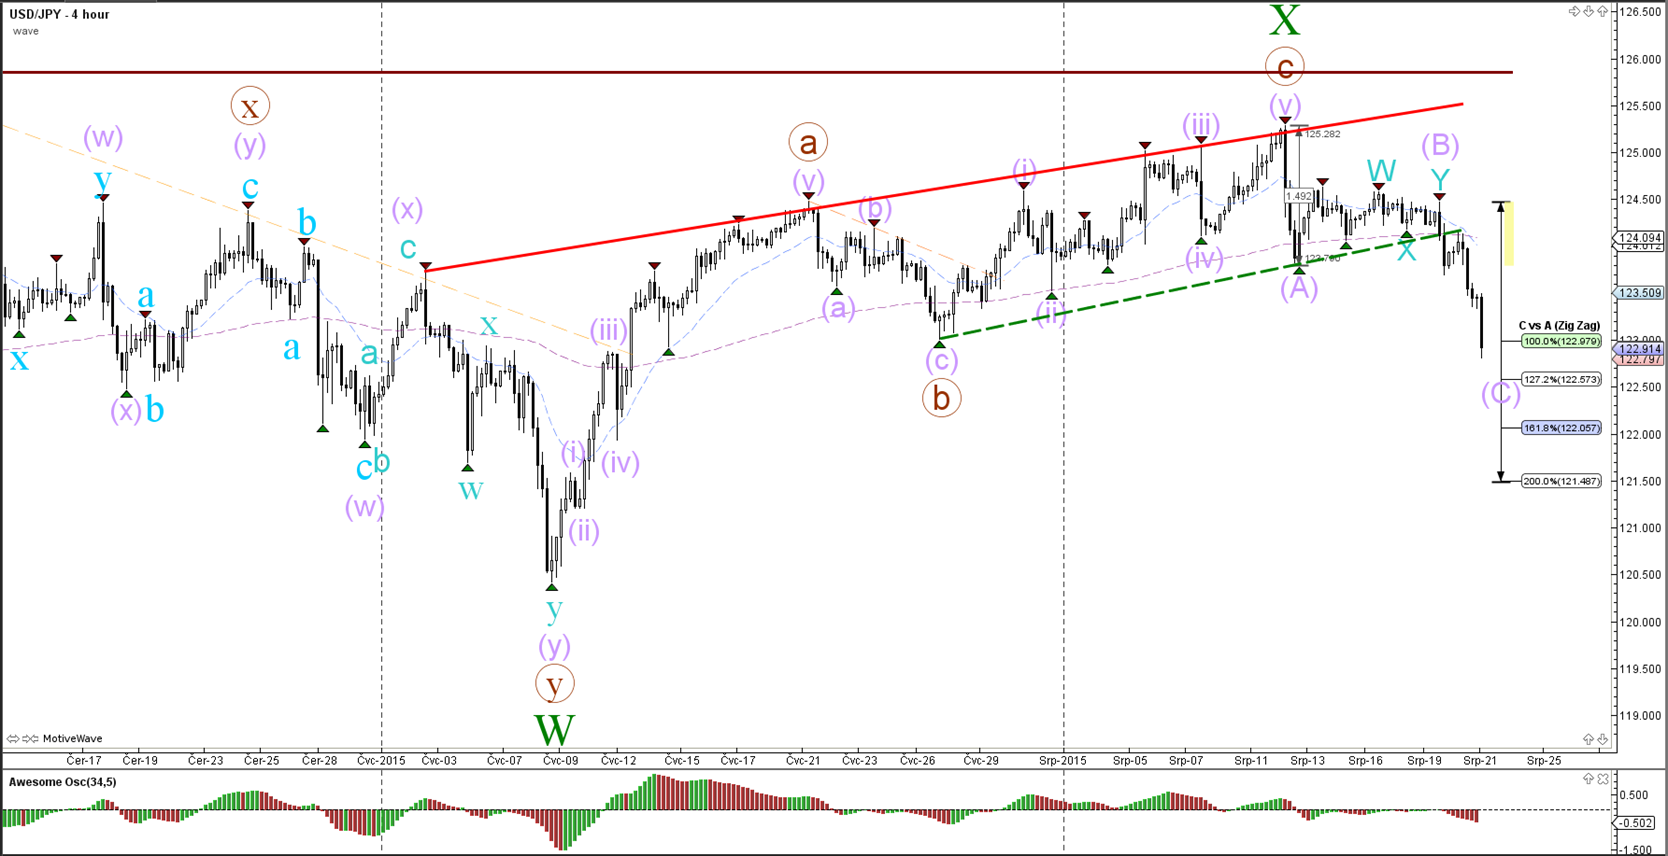
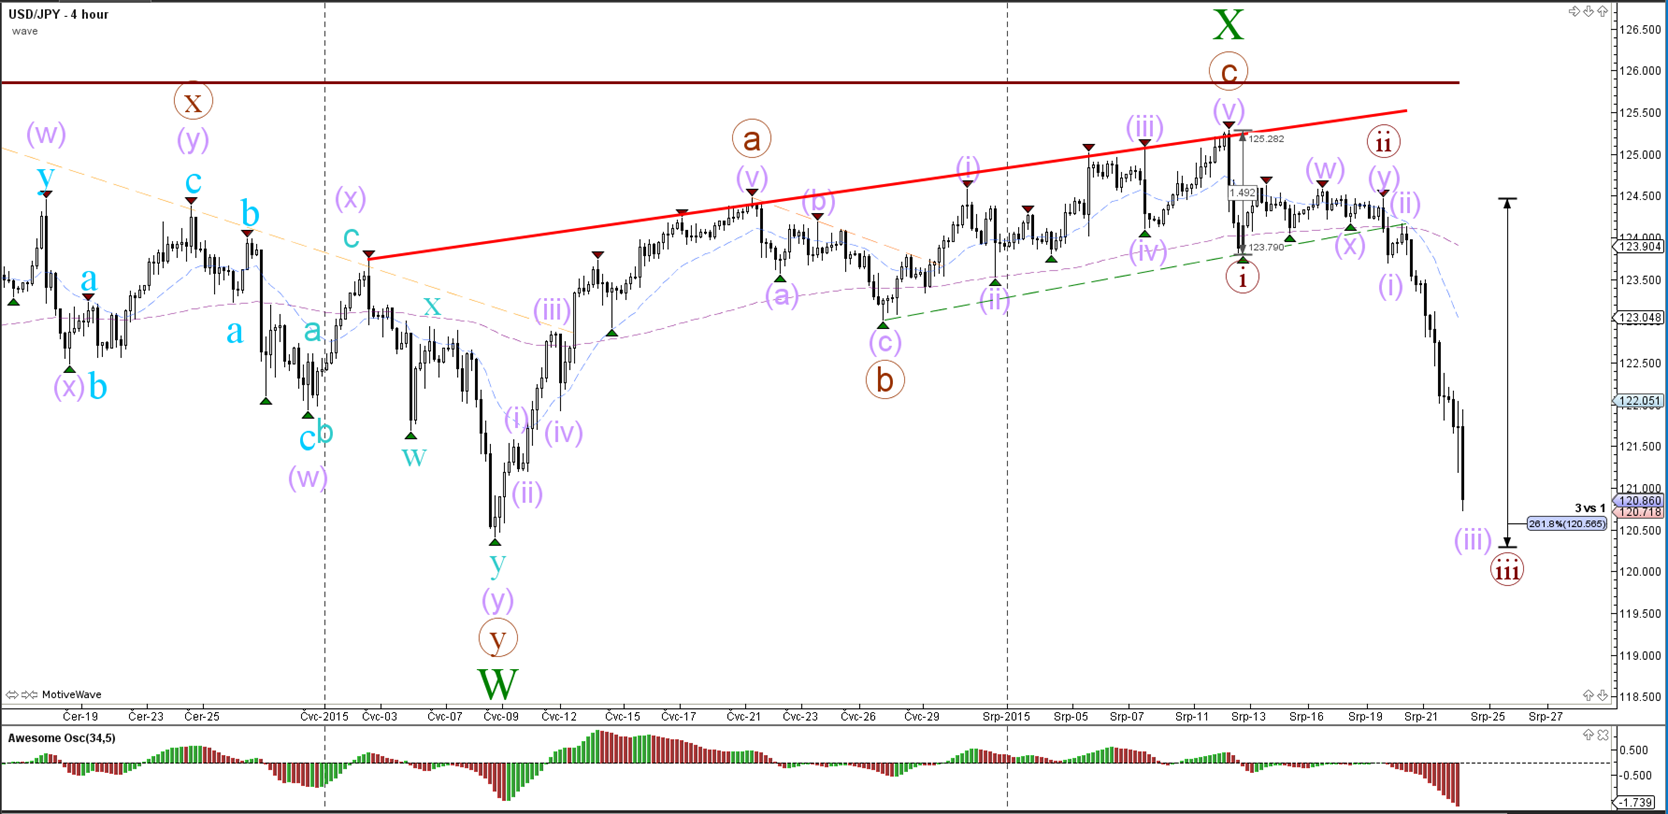
The USD/JPY is making bearish price movement as indicated by the wave count in the recent weeks. The acceleration below the trend channel confirms its impulsiveness which makes it a wave C (purple) or perhaps even a wave 3. This will depend on how far price pushes lower.


“Original analysis is provided by Admiral Markets
 
EURUSD and USDJPY Impulsiveness Continues without Pause

EUR/USD

4 hour


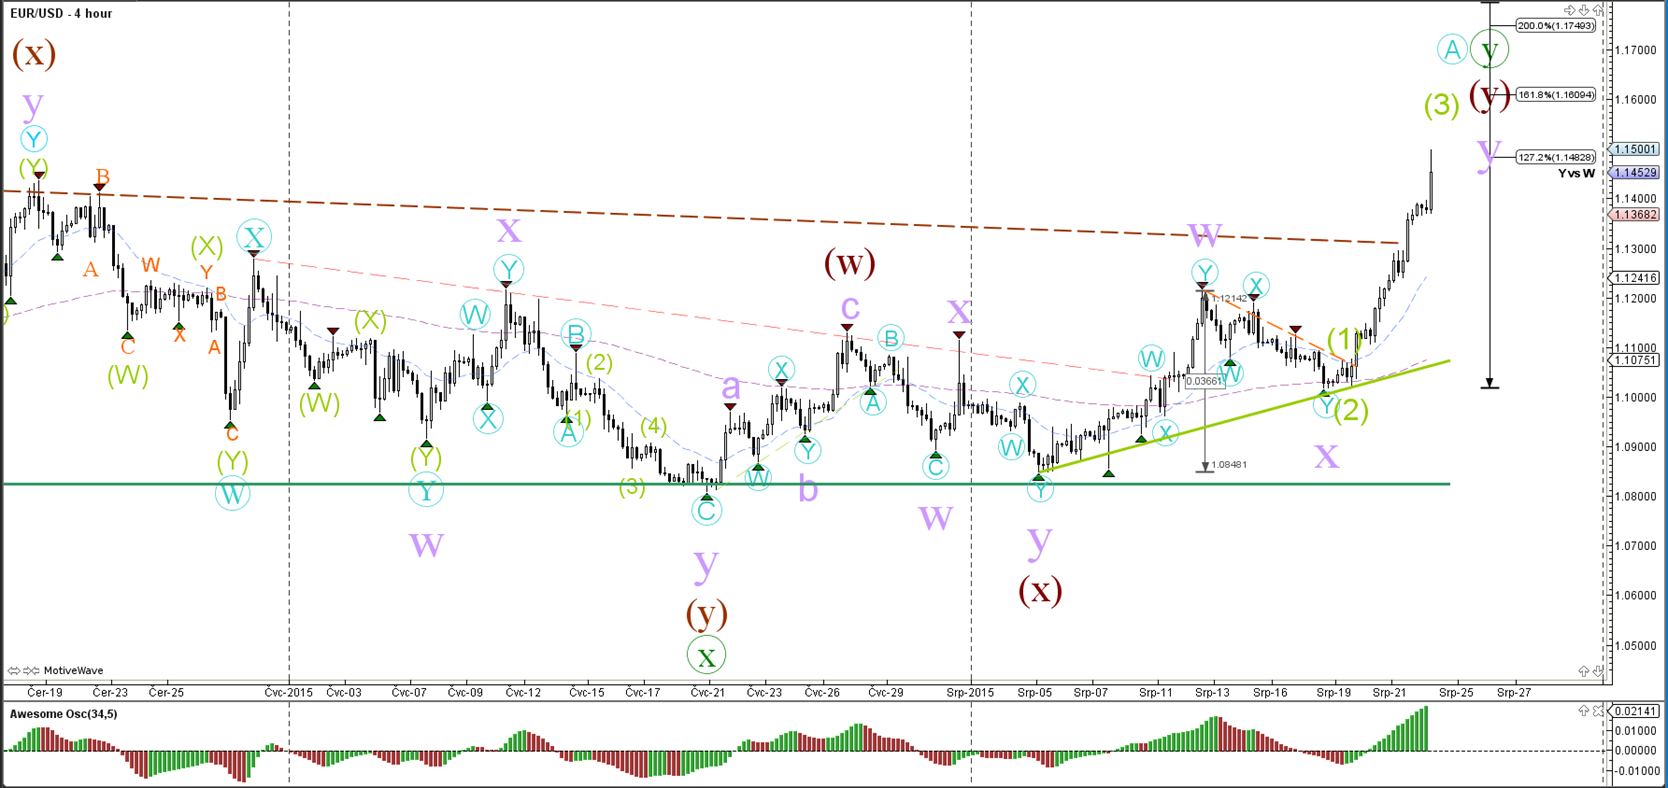
The EUR/USD bullish momentum broke above the resistance trend line and accelerates its speed within a strong wave 3 (green).

1 hour


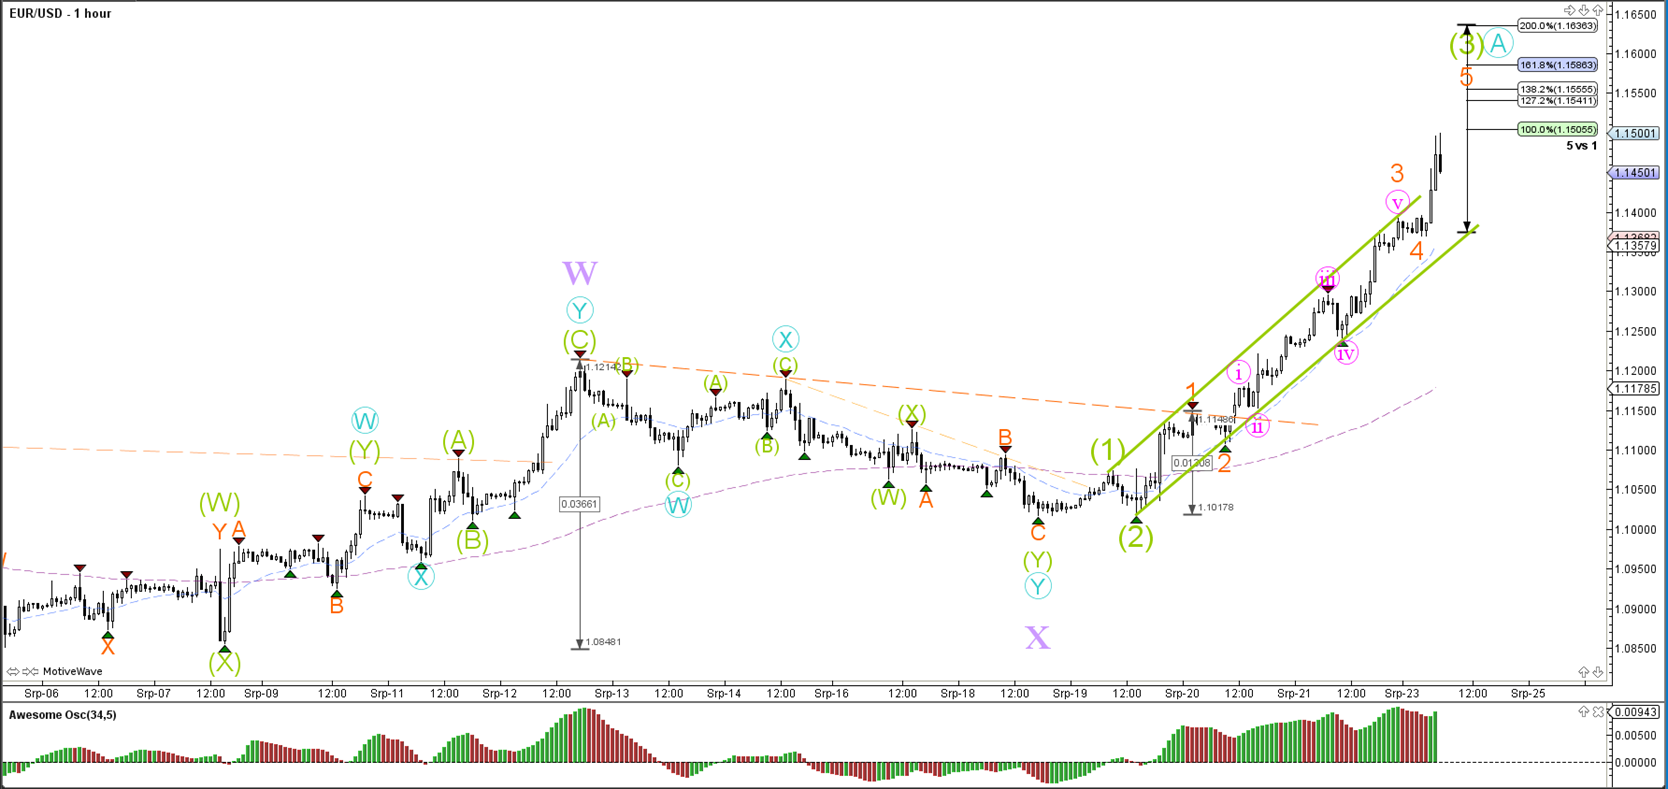
The strength of the bullish momentum can be seen in the steep angle of the bullish channel (green lines).

GBP/USD

4 hour


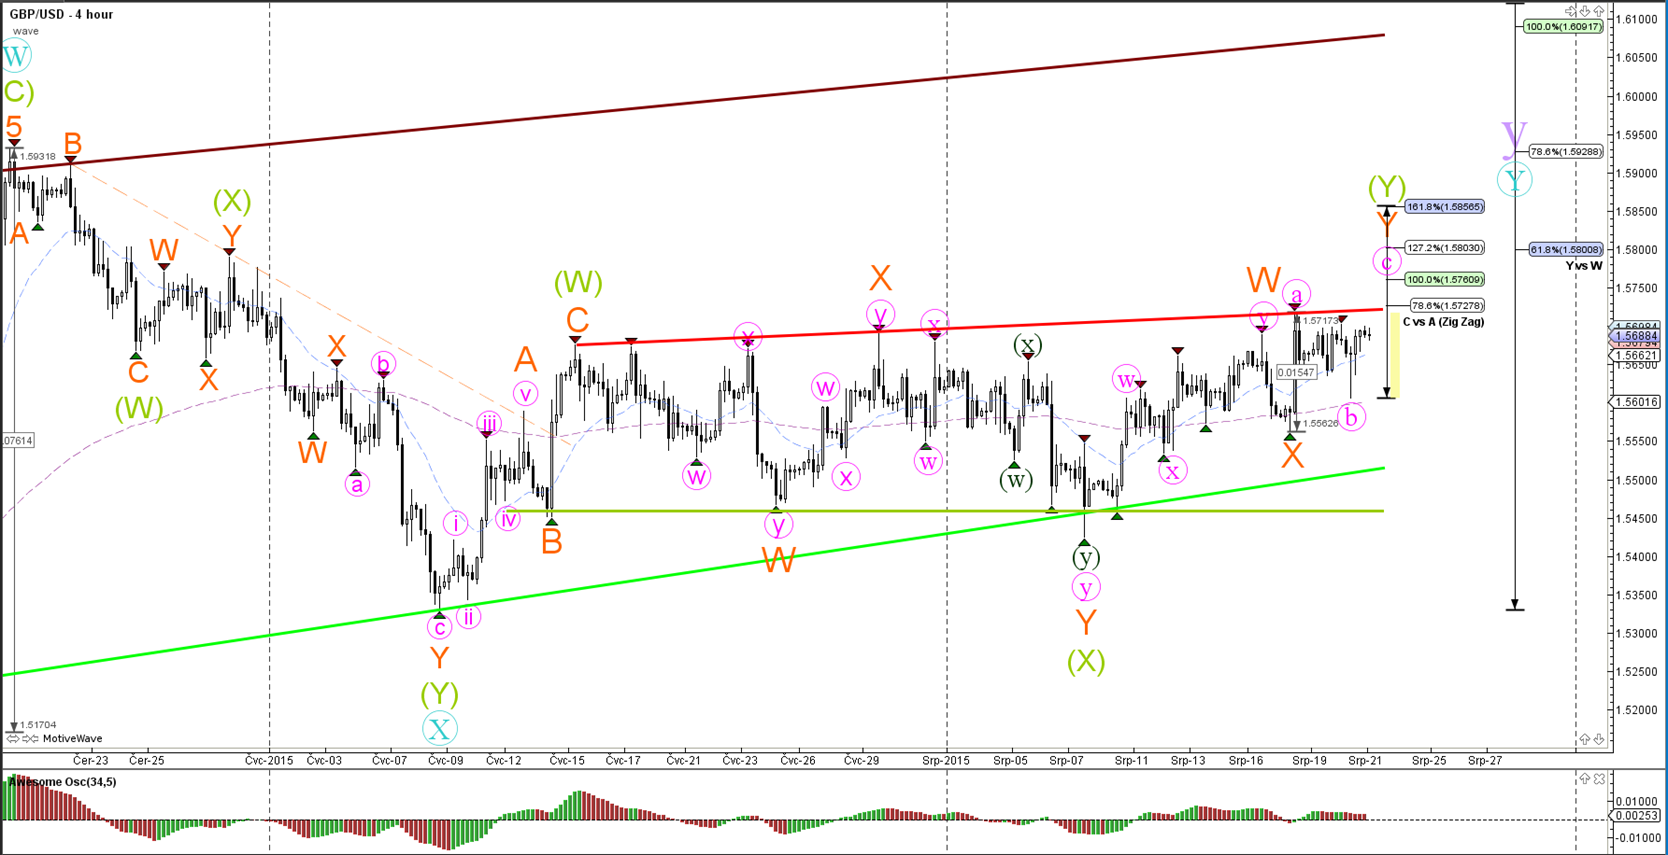
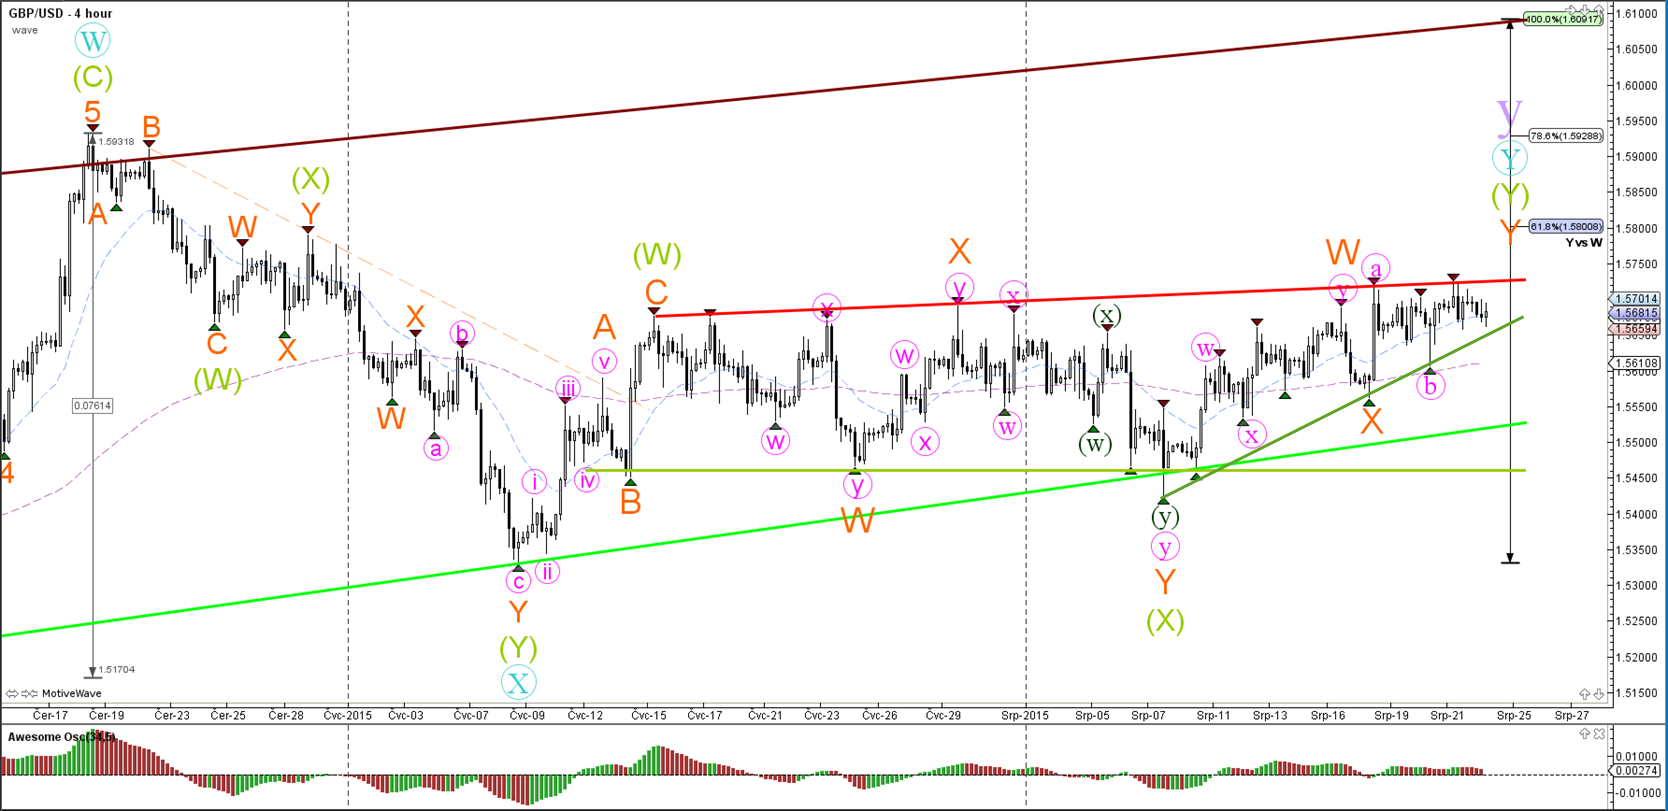
The GBP/USD price action remains choppy and cluttered. Within this wedge resistance (red) and support (green) trend lines are nearby.

1 hour


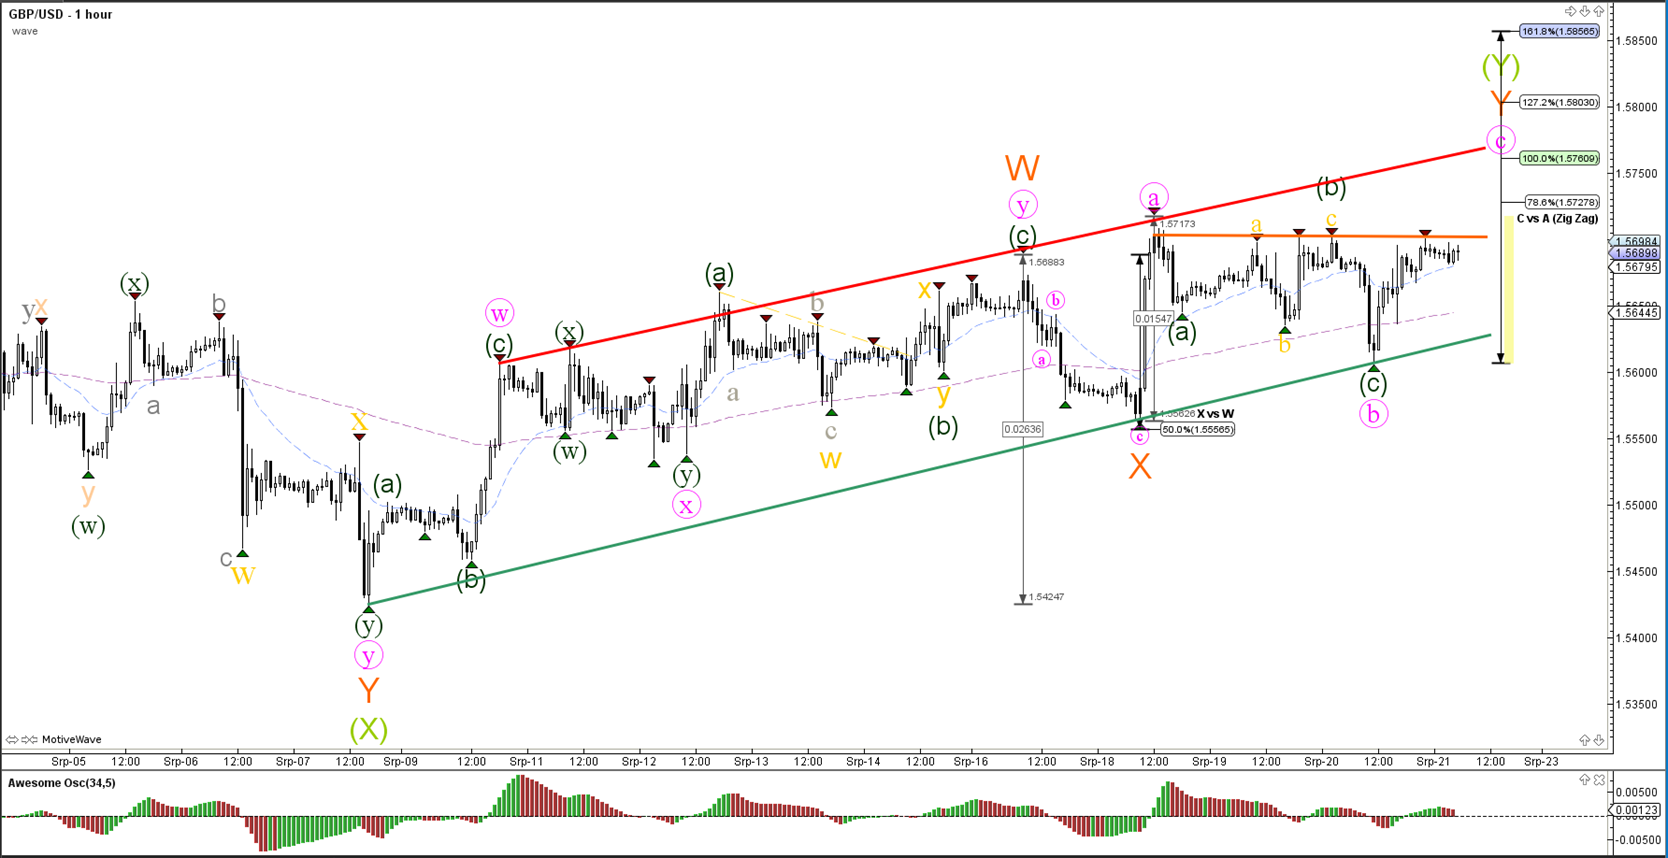
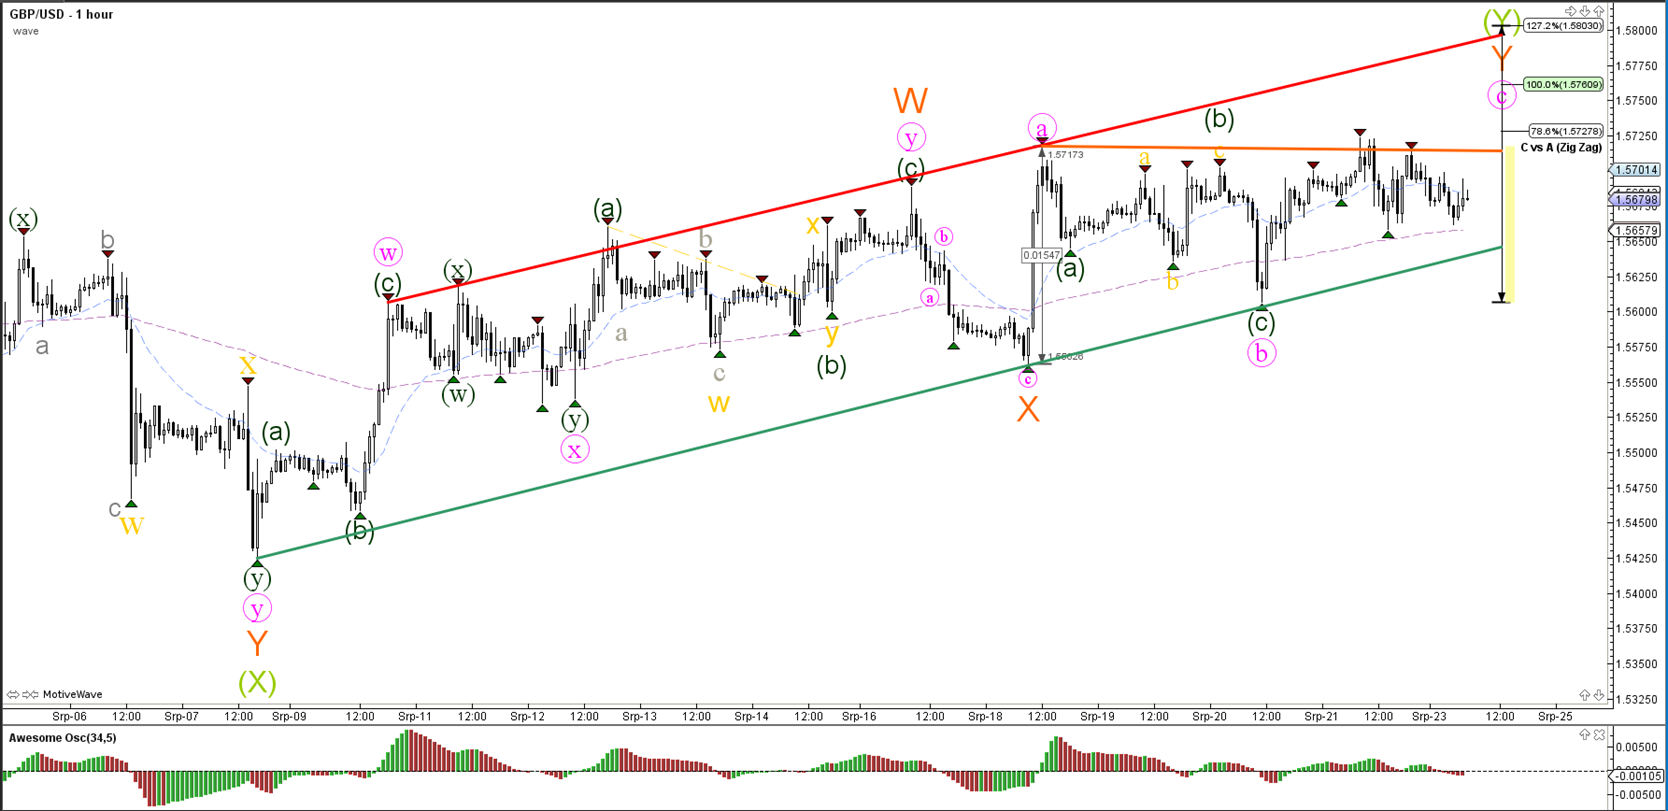
The GBP/USD remains in a bullish channel, which is indicated by the red and green trend lines, but price is unable to break above the resistance top (orange line). Price remains in a "grey" and indecisive area.

USD/JPY

4 hour


The USD/JPY wave count has been changed from an ABC to a 123 pattern (brown) due to the recent steep decline that has taken price down to the 261.8% Fibonacci target (wave 3 vs 1). Such an extended move is typical for a wave 3.


“Original analysis is provided by Admiral Markets
 
EURUSD and USDJPY Impulsiveness Continues without Pause

EUR/USD

4 hour

24-08-2015eu4.png


The EUR/USD bullish momentum broke above the resistance trend line and accelerates its speed within a strong wave 3 (green).

1 hour

24-08-2015eu1.png


The strength of the bullish momentum can be seen in the steep angle of the bullish channel (green lines).

GBP/USD

4 hour

24-08-2015gu4.png


The GBP/USD price action remains choppy and cluttered. Within this wedge resistance (red) and support (green) trend lines are nearby.

1 hour

19-08-2015gu1.png


The GBP/USD remains in a bullish channel, which is indicated by the red and green trend lines, but price is unable to break above the resistance top (orange line). Price remains in a "grey" and indecisive area.

USD/JPY

4 hour

24-08-2015uj4.png


The USD/JPY wave count has been changed from an ABC to a 123 pattern (brown) due to the recent steep decline that has taken price down to the 261.8% Fibonacci target (wave 3 vs 1). Such an extended move is typical for a wave 3.

1 hour

24-08-2015uj1.png


The bearish momentum is strong and there seems to be an internal wave 3 (purple) within the bigger wave 3 (brown).

“Original analysis is provided by Admiral Markets"
 
EUR/USD Long-term Resistance at 38.2% Fib Wave 4

EUR/USD
4 hour


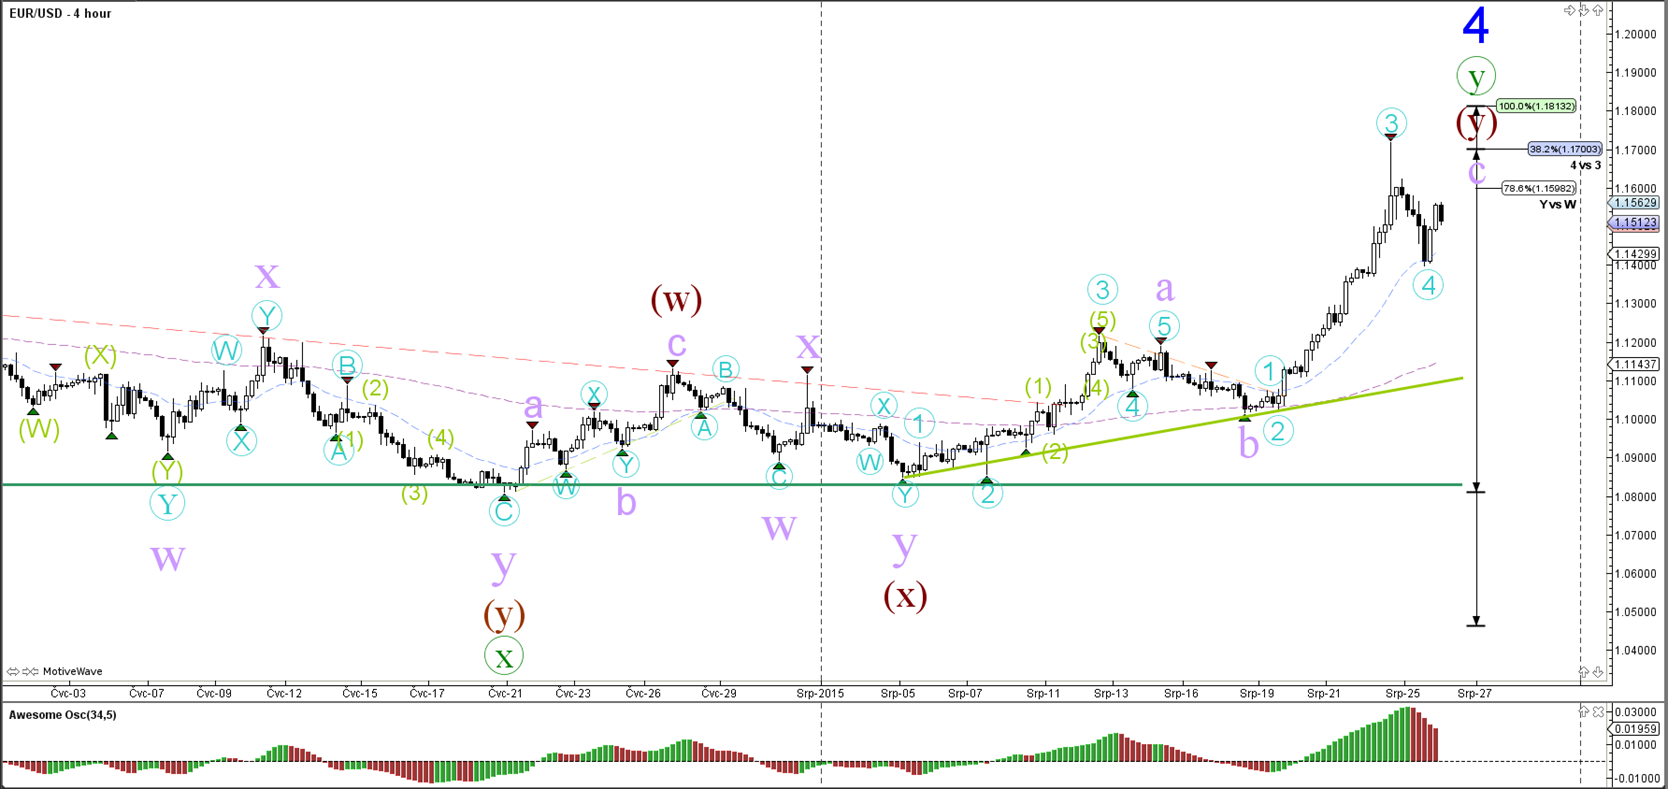
The EUR/USD momentum burst has moved price up to the long-term 38.2% Fibonacci retracement level of wave 4 (blue). A bearish turn around for a blue wave 5 could potentially occur anywhere between 1.17 and 1.18, which is a strong resistance zone.

1 hour


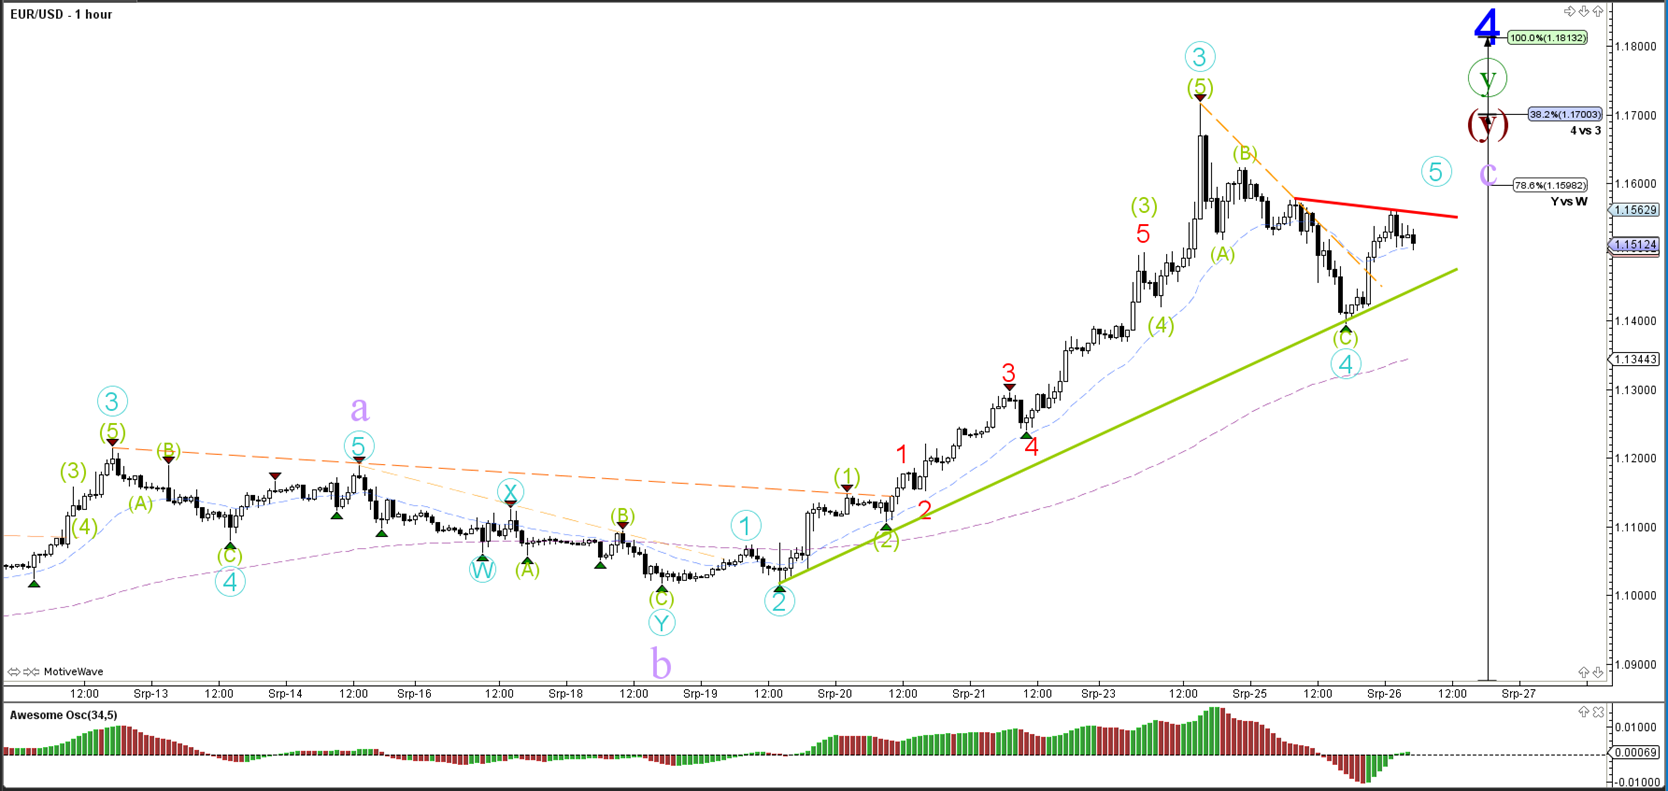
The strong momentum could indicate the potential for one more bullish push to complete wave 5 (light blue), which could turn out to be truncated (unable to break the top) due to the wave 4 (blue) resistance.

GBP/USD
4 hour


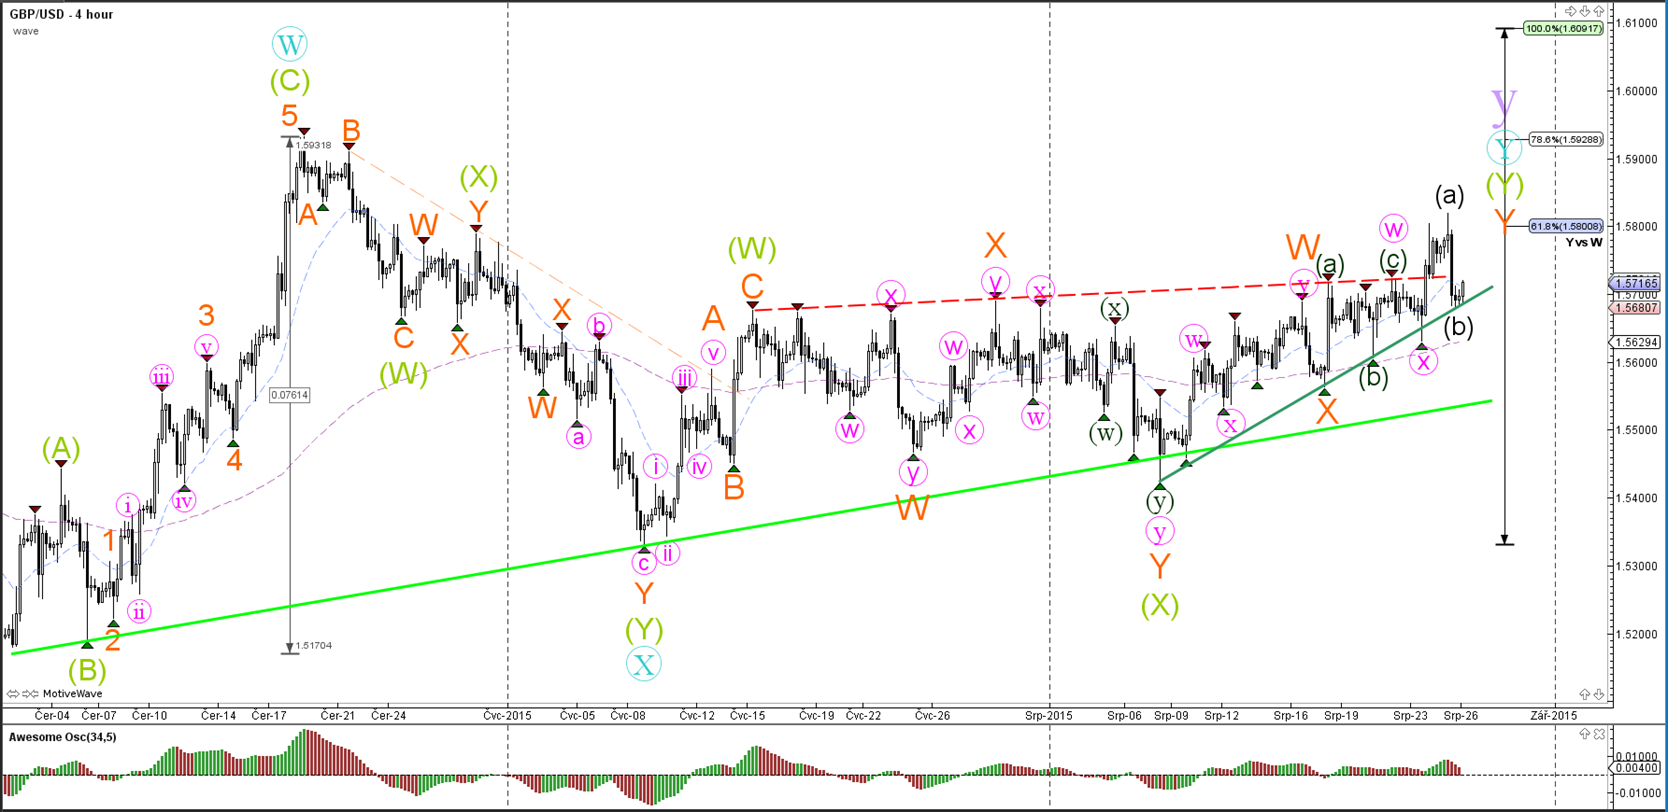
The GBP/USD showed a bearish retracement after hitting the 61.8% Fibonacci level. A bullish continuation could indicate the potential for price to move up to the 100% Fibonacci target.

1 hour


The GBP/USD made a deep retracement back to the 78.6% Fibonacci level and bottom of the uptrend channel (green).

USD/JPY
4 hour


The USD/JPY's bearishness could be part of a larger ABC correction. For the moment the wave count is favoring a wave 3 (purple) within a wave 3 (brown), which later on could complete a bigger wave A (not on the chart yet).


“Original analysis is provided by Admiral Markets
 
Wave Count after GBP/USD Plunge below Support

EUR/USD

4 hour


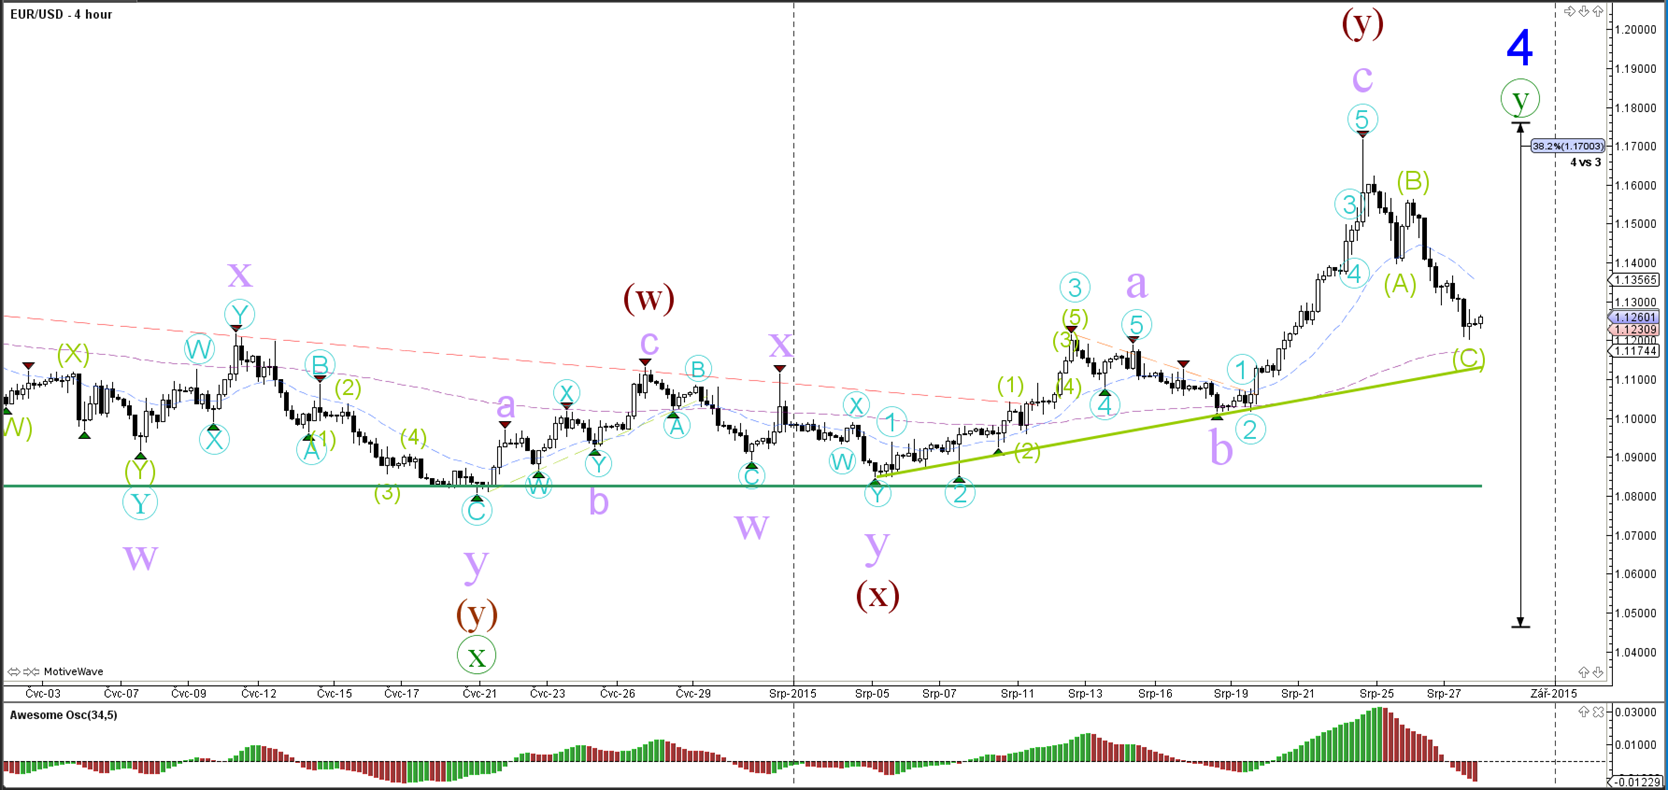
The EUR/USD bullish run has respected the long-term 38.2% Fibonacci retracement level of wave 4 (blue). The wave 5 could therefore turn out to be relatively choppy price movement as price retests a strong resistance zone.

1 hour


A deeper bearish retracement than the current 61.8% level might need to lead a change of the current wave count. The current wave count is expecting one more push up for wave 5 (light blue) due to the strong bullish momentum marked as wave 3 (light blue).

GBP/USD

4 hour


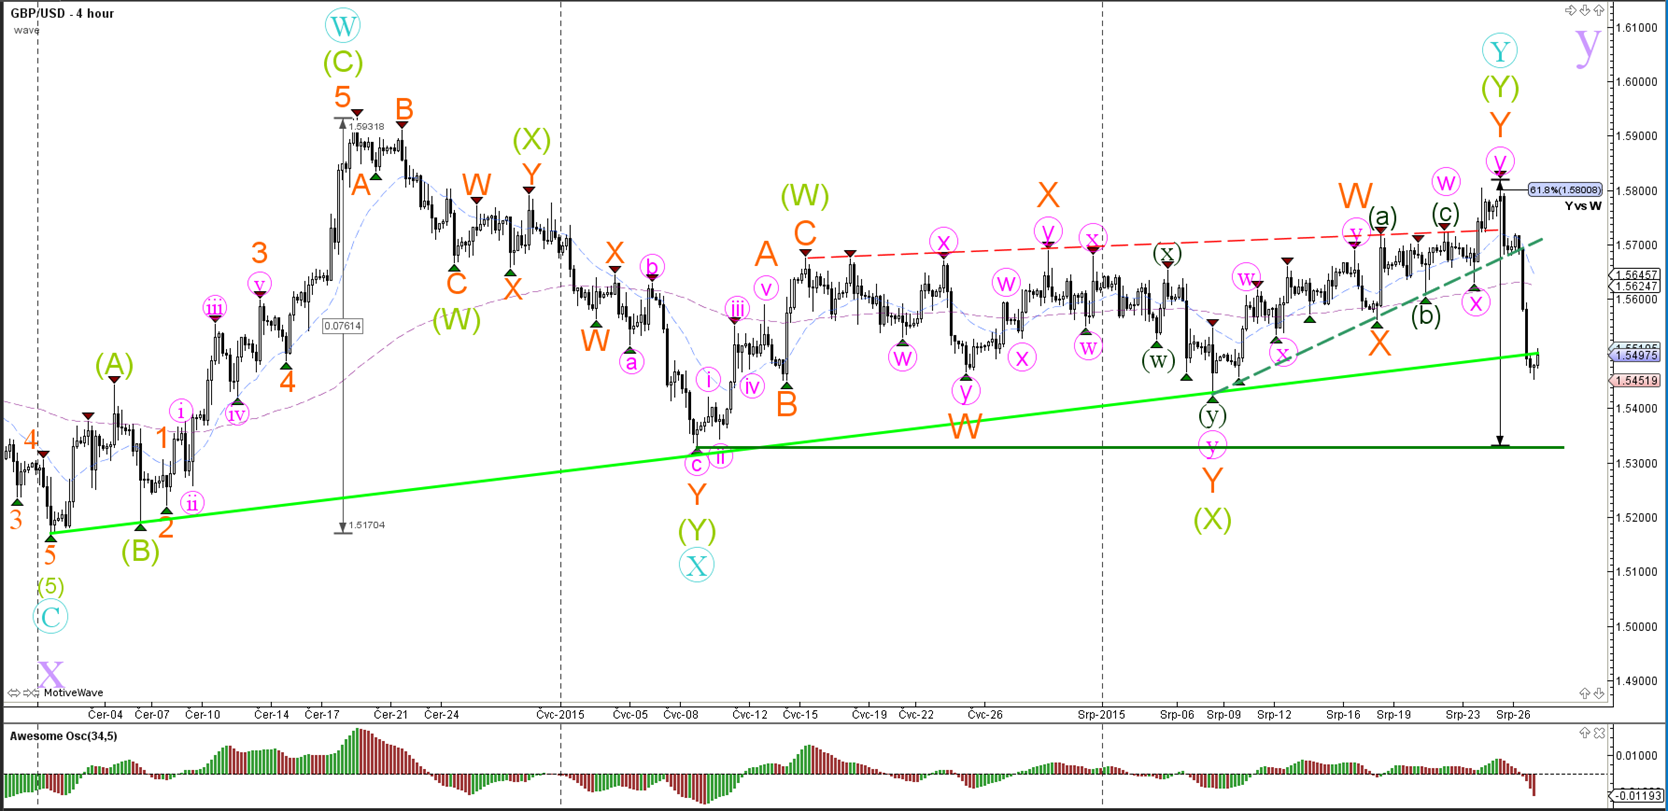
The GBP/USD showed very strong bearish momentum yesterday when breaking below the support trend line (dotted green). The momentum is even challenging the next support trend line (light green). Due to strong impulsiveness the wave count has marked many wave Y's as completed with the exception of the largest wave Y (purple). That wave will only be considered finished when price is able to break below the trend line and horizontal support (dark green).

1 hour


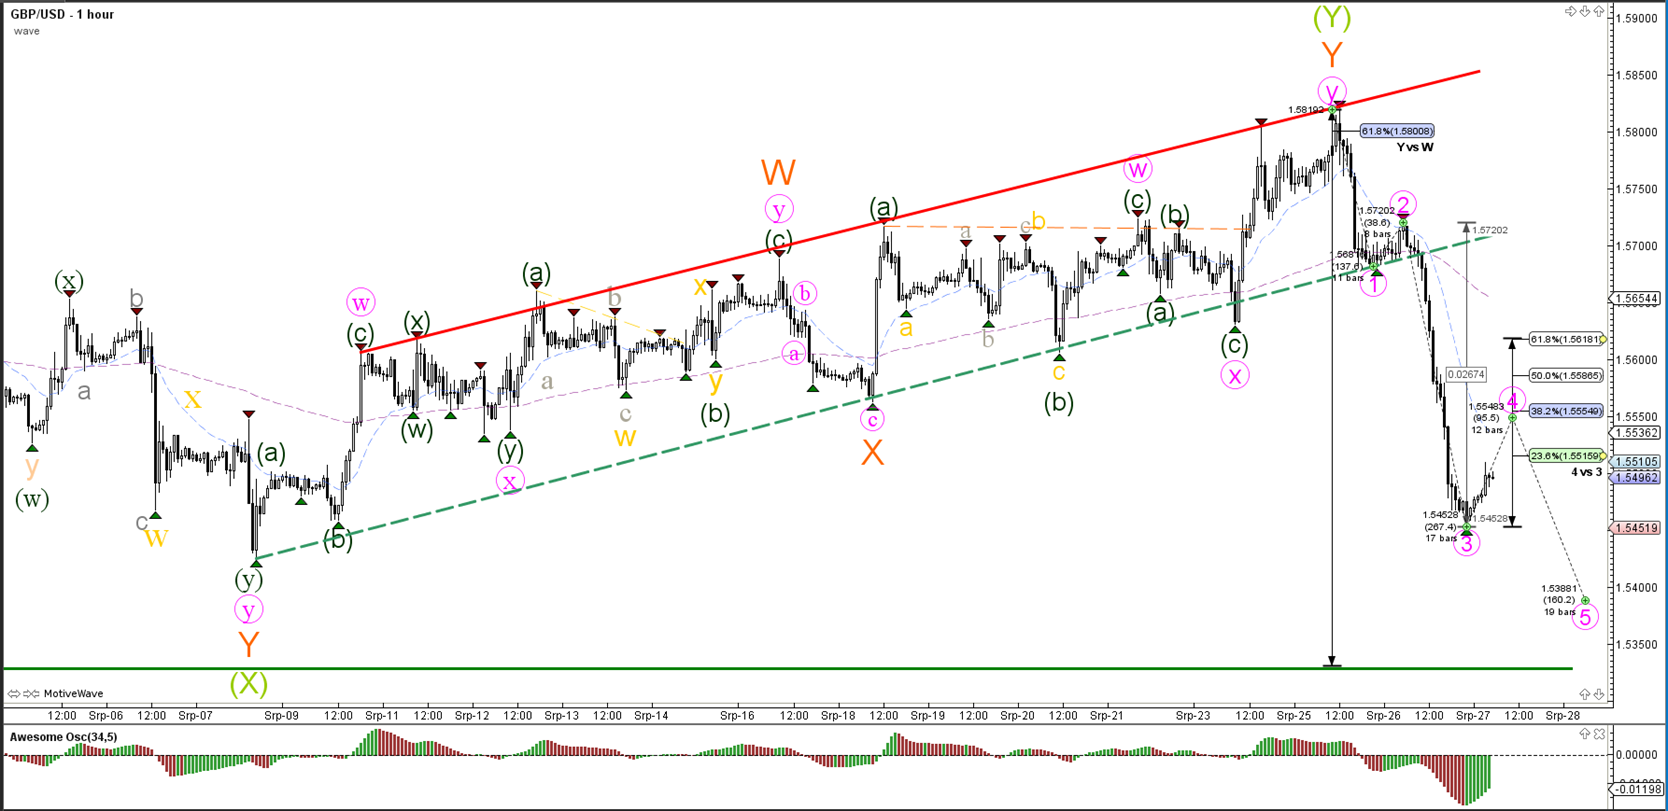
The strong bearish momentum is indicating the likelihood of a wave 3 (pink) followed by a wave 4 (pink) retracement.

USD/JPY

4 hour


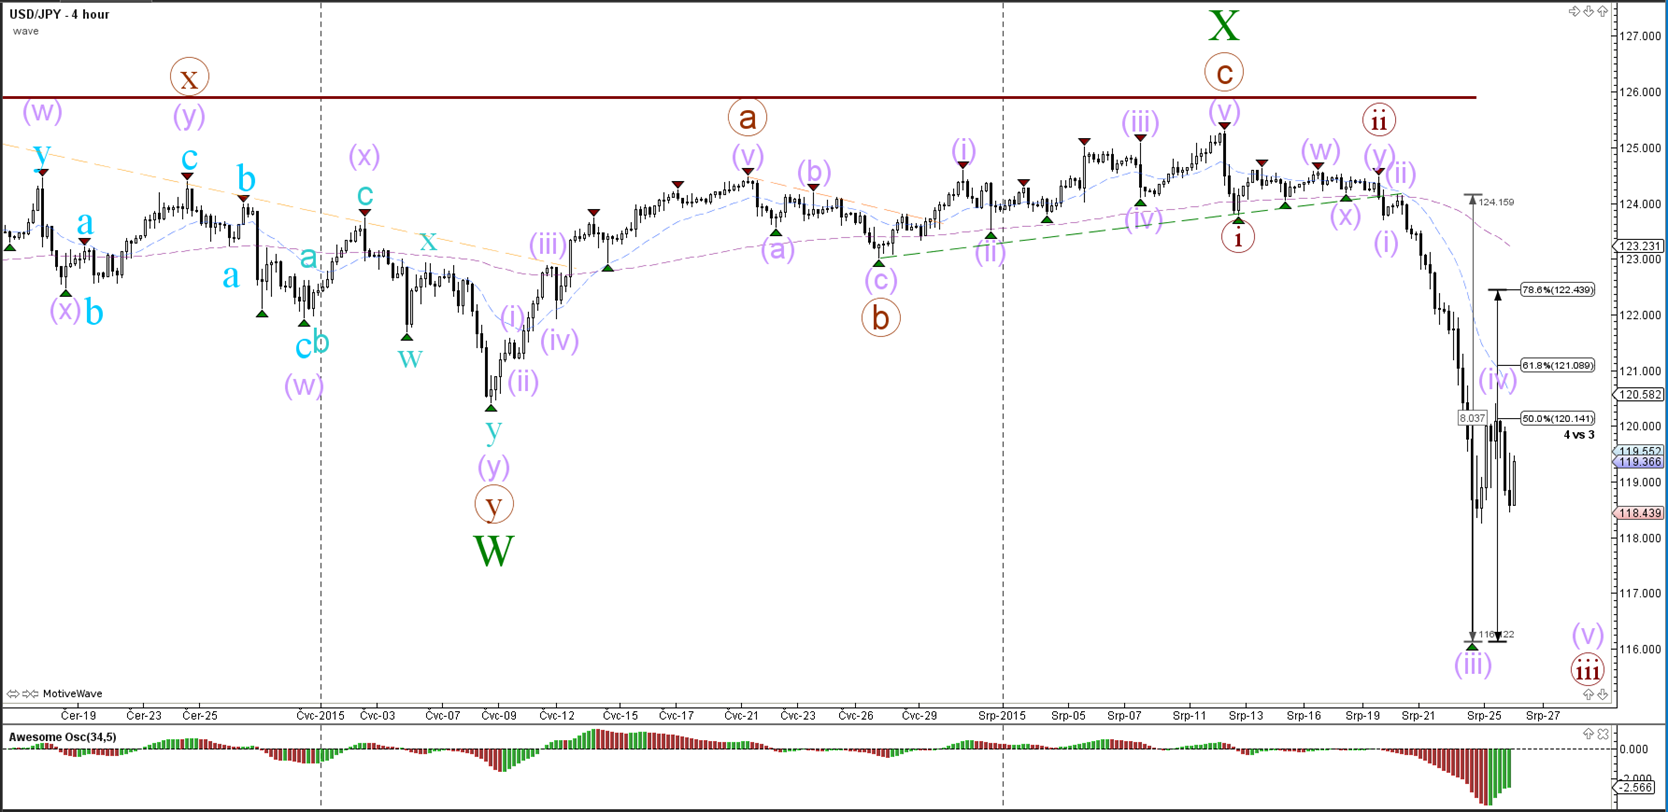
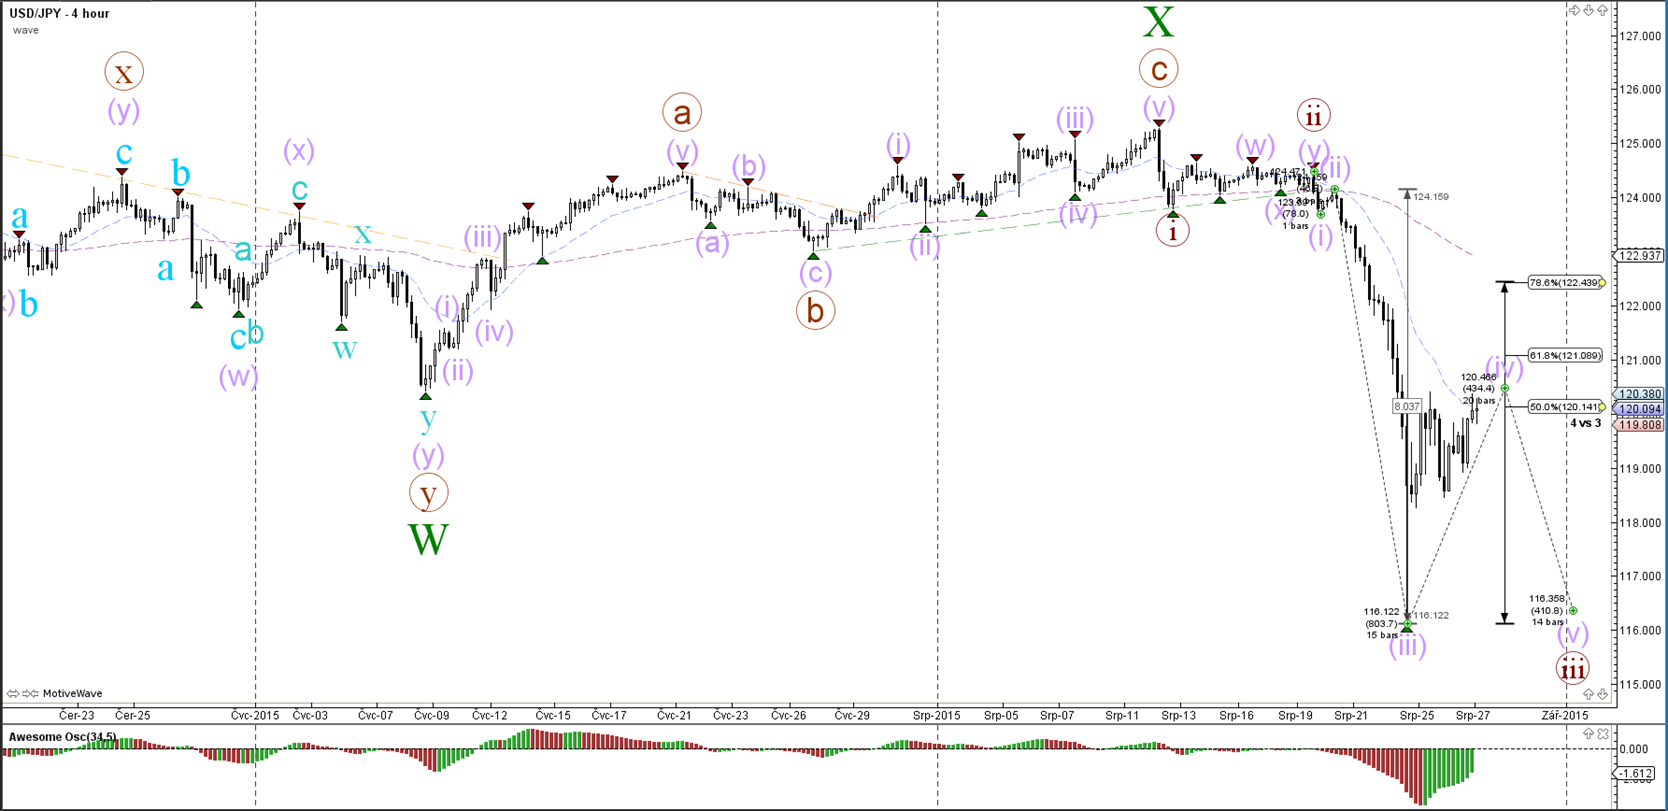
The USD/JPY's showed bearish momentum earlier this week, which is most likely explained by wave 3 (purple). For the moment the wave count is indicating that the current retracement could be a wave 4 (purple) after which price can fall for a wave 5.


“Original analysis is provided by Admiral Markets
 
US Dollar Turns Around for ABC Zigzag

EUR/USD

4 hour


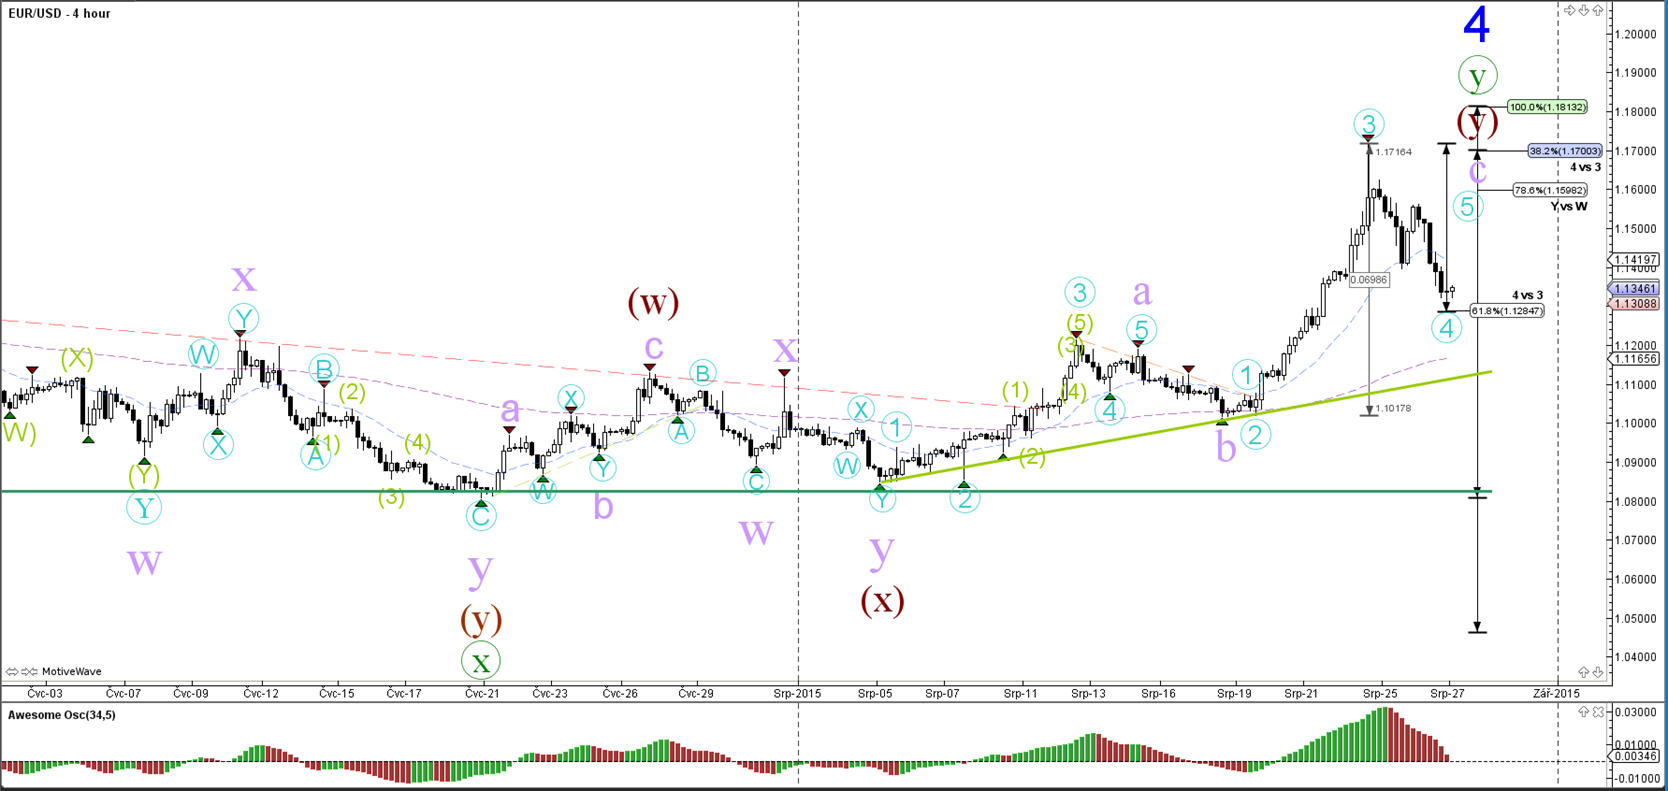
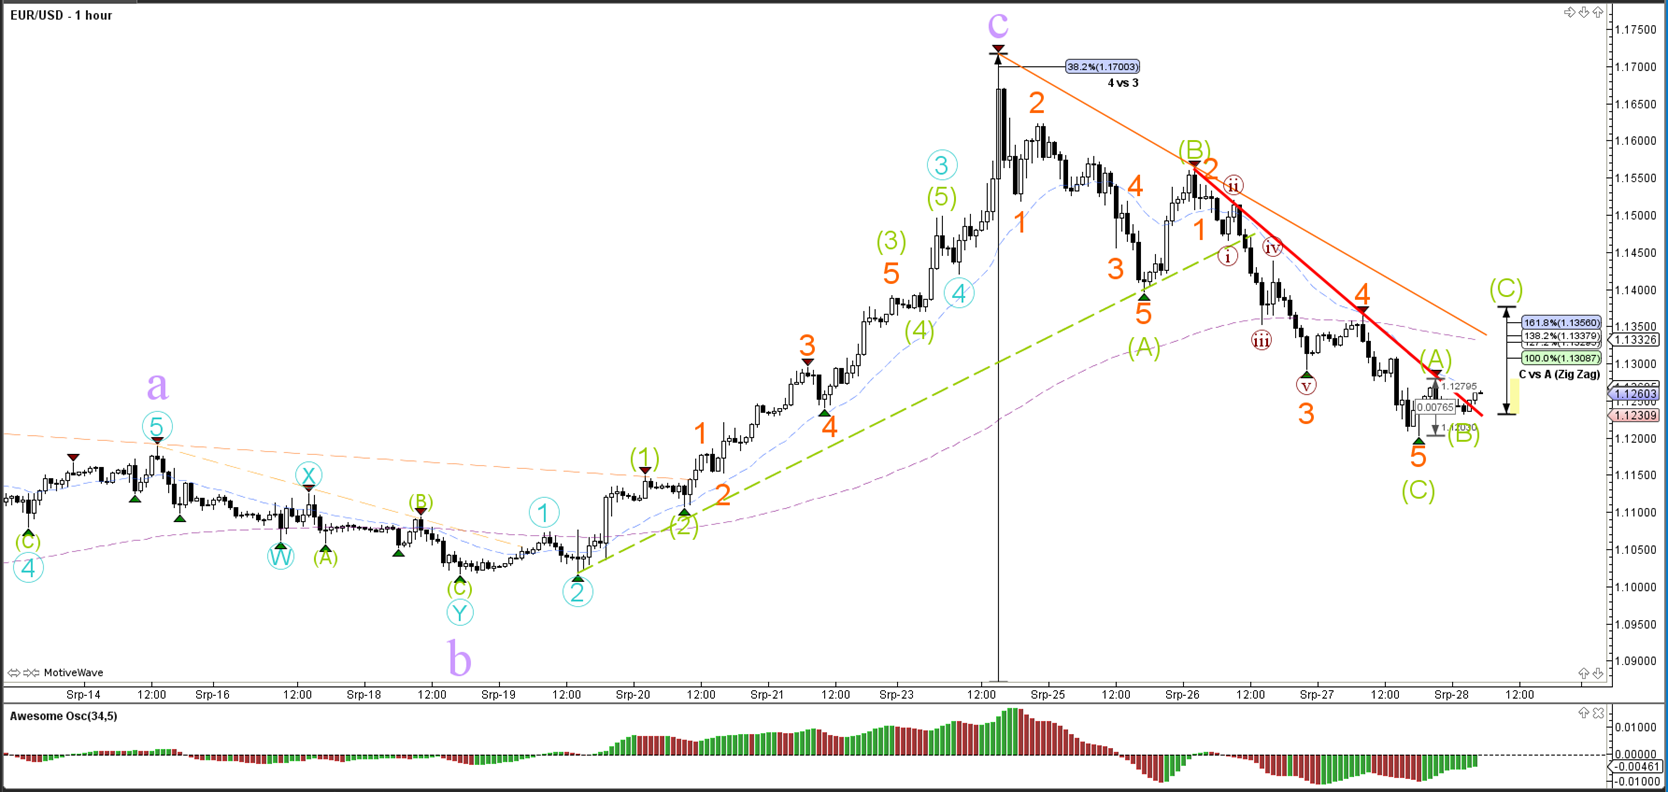
The EUR/USD bearish movement has retraced very deep which therefore favors a completed wave 5 (blue) of wave C (green) of Y (brown). Price could still expand the bullish price action after completing a potential ABC (green) zigzag pattern.

1 hour


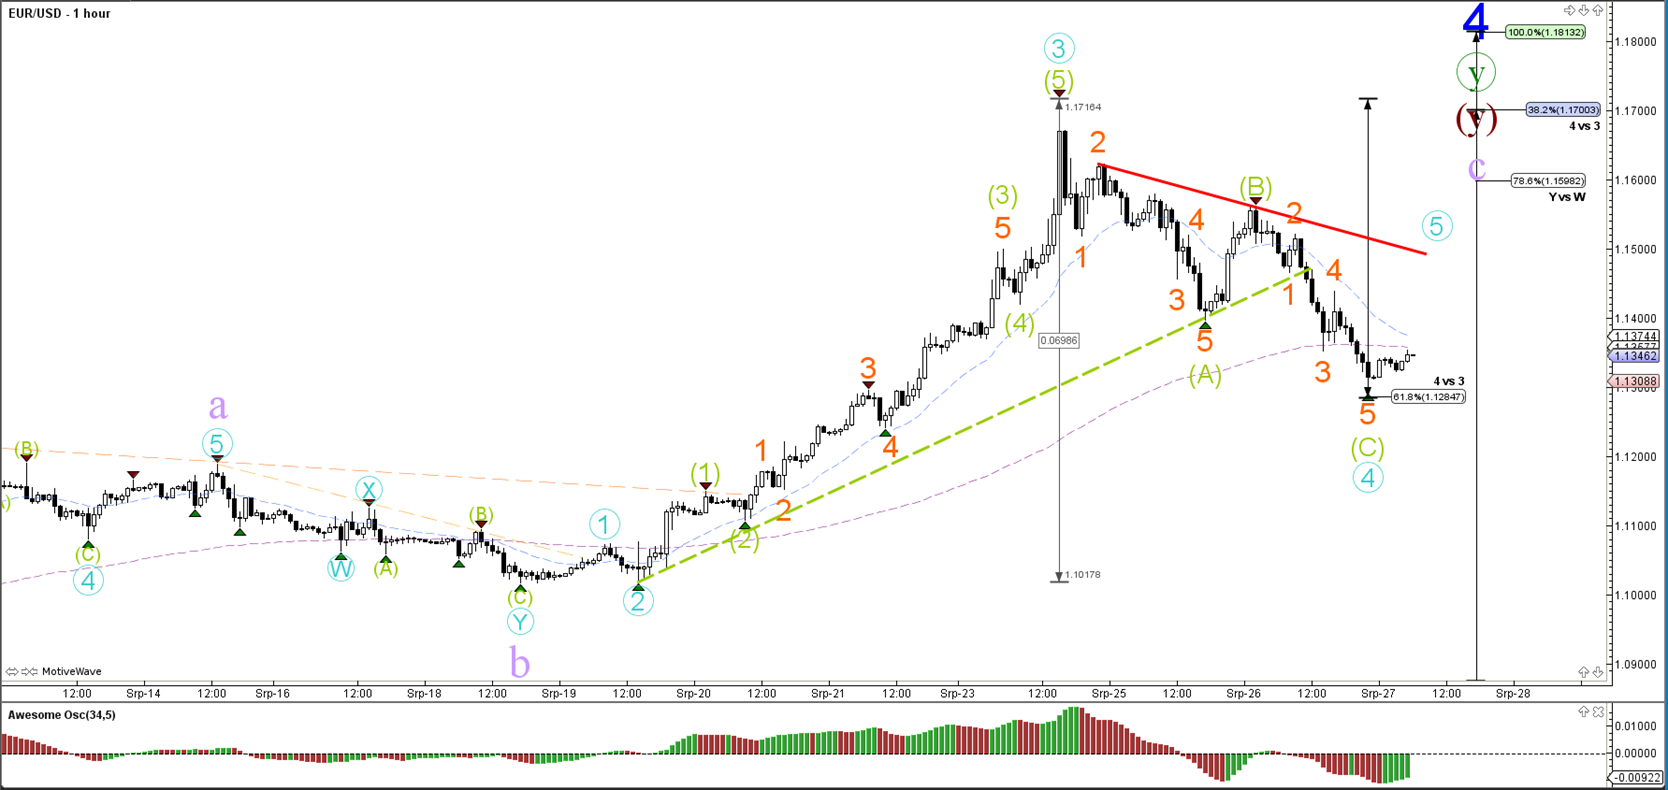
Due to the weaker angle of price action in the 3rd leg of price movement, the bearish 3 wave pattern resembles an ABC more than a 123 pattern.

GBP/USD

4 hour


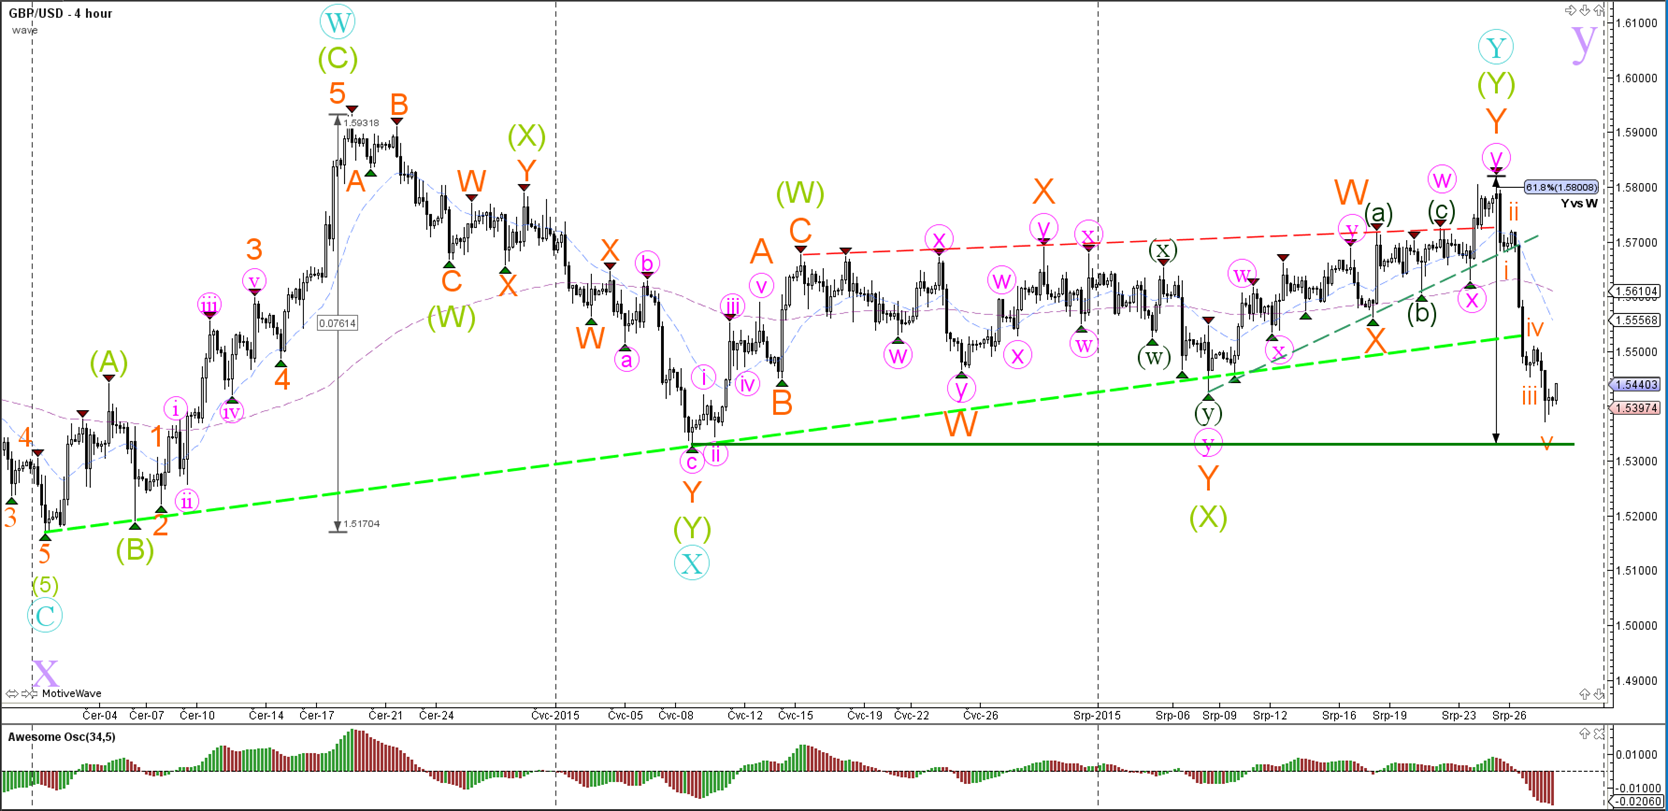
The GBP/USD broke both support trend lines (green) with a 5 wave bearish pattern (orange), which indicates that an ABC correction is now likely. A break below the bottom (green) would signal the completion of the wave Y (purple).

1 hour


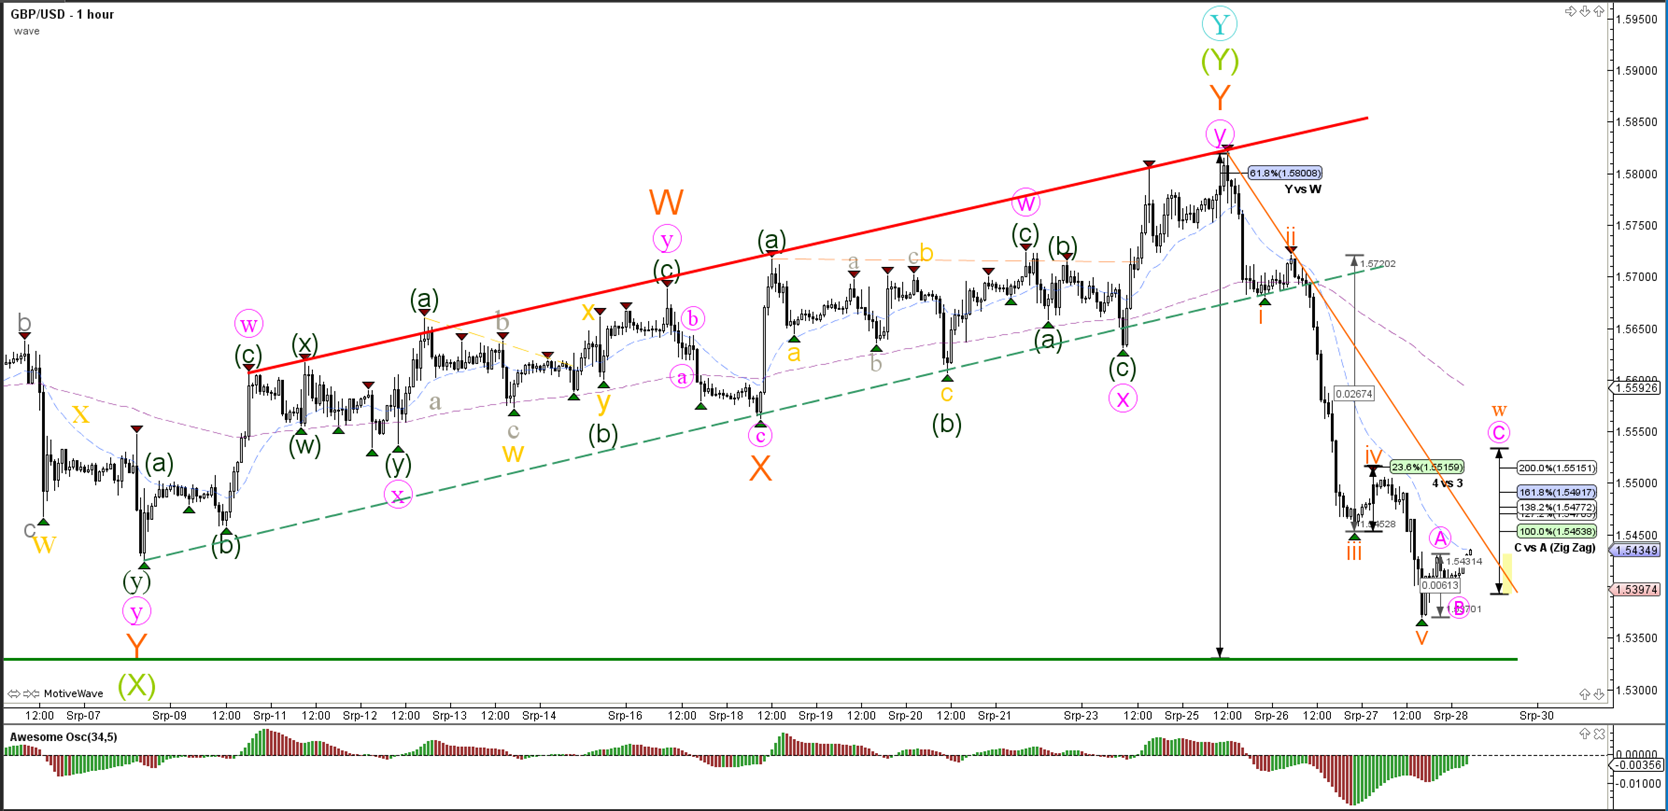
Yesterday price completed a wave 4 (orange) at the 23.6% Fibonacci retracement level and made one more fall for wave 5. An ABC correction is the most likely scenario at the moment. If price does push below support then a wave extension is most likely taking place.

USD/JPY

4 hour


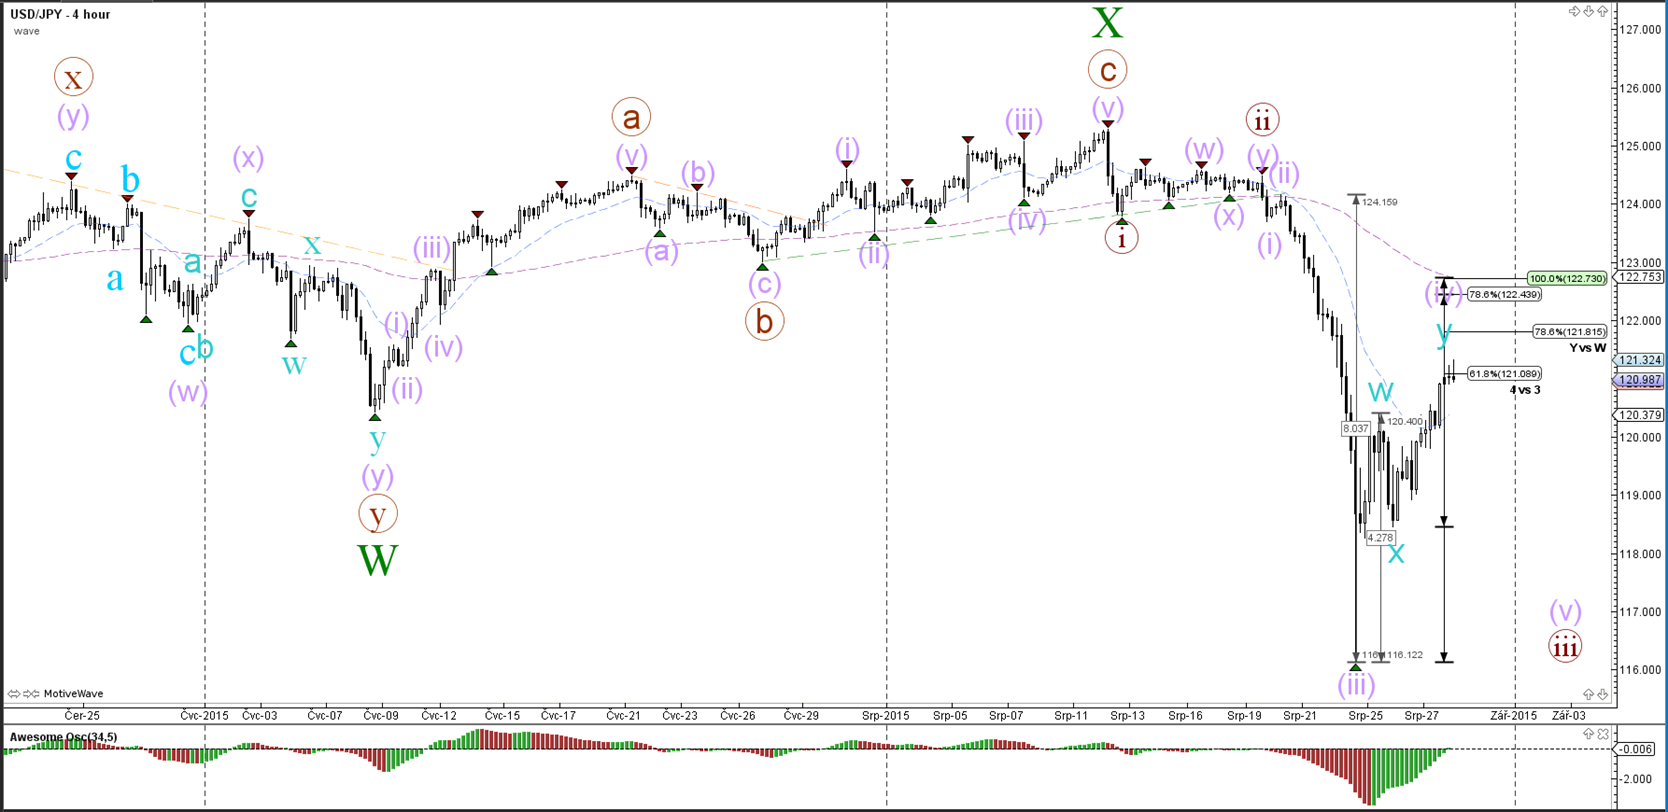
The USD/JPY's wave count is indicating that the current retracement could be a wave 4 (purple). A deeper retracement than the 61.8% could require a wave count change.


“Original analysis is provided by Admiral Markets
 
Back
Top