Admiral Markets
AdmiralMarkets.com Representative
- Messages
- 95
EURUSD & GBPUSD Begin Week with Uptrend Channels
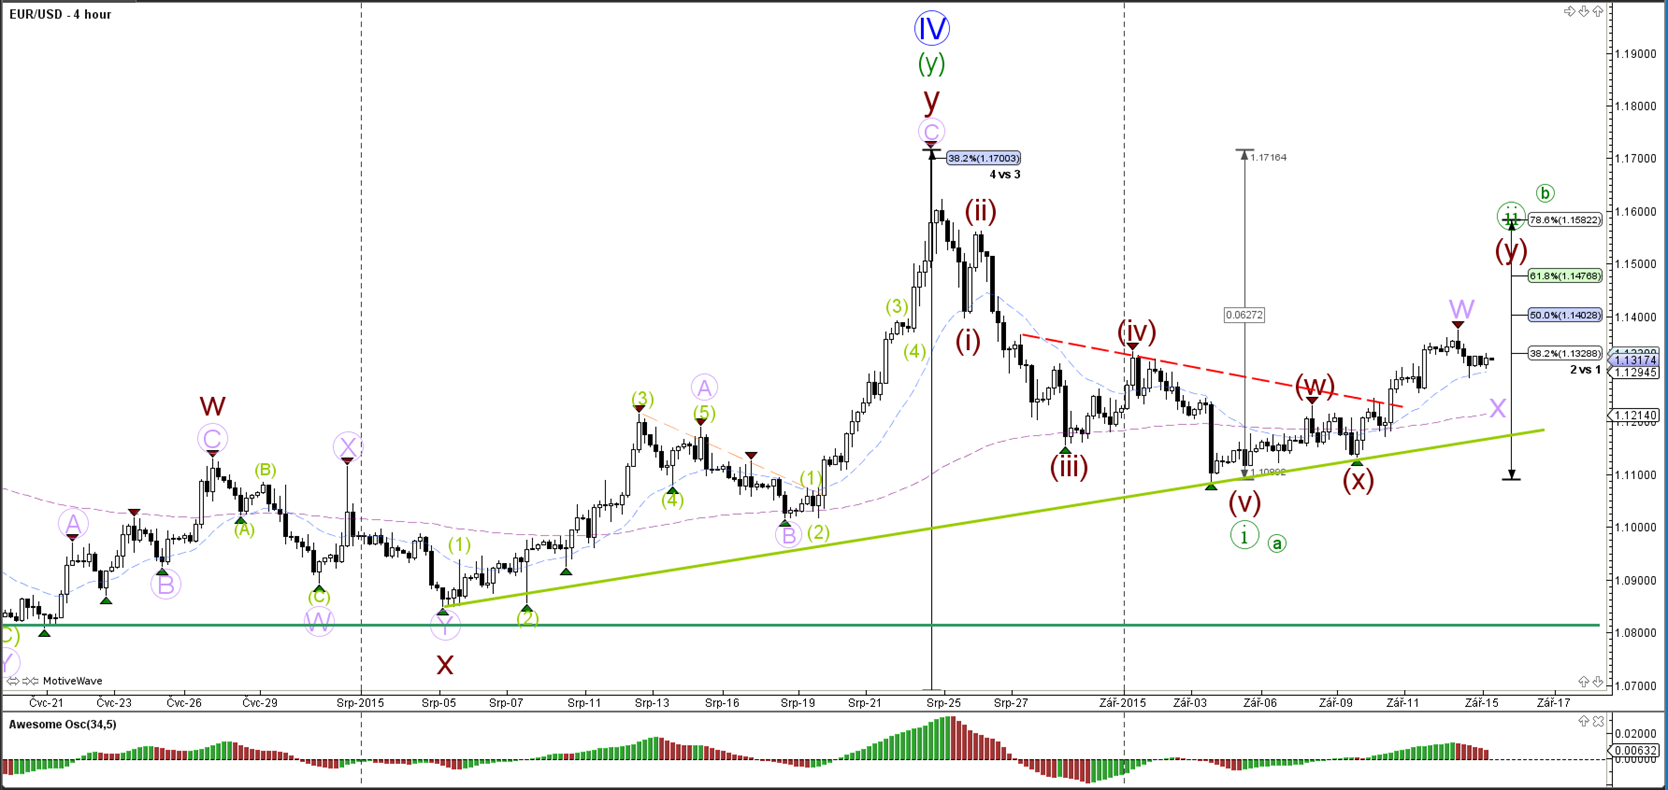
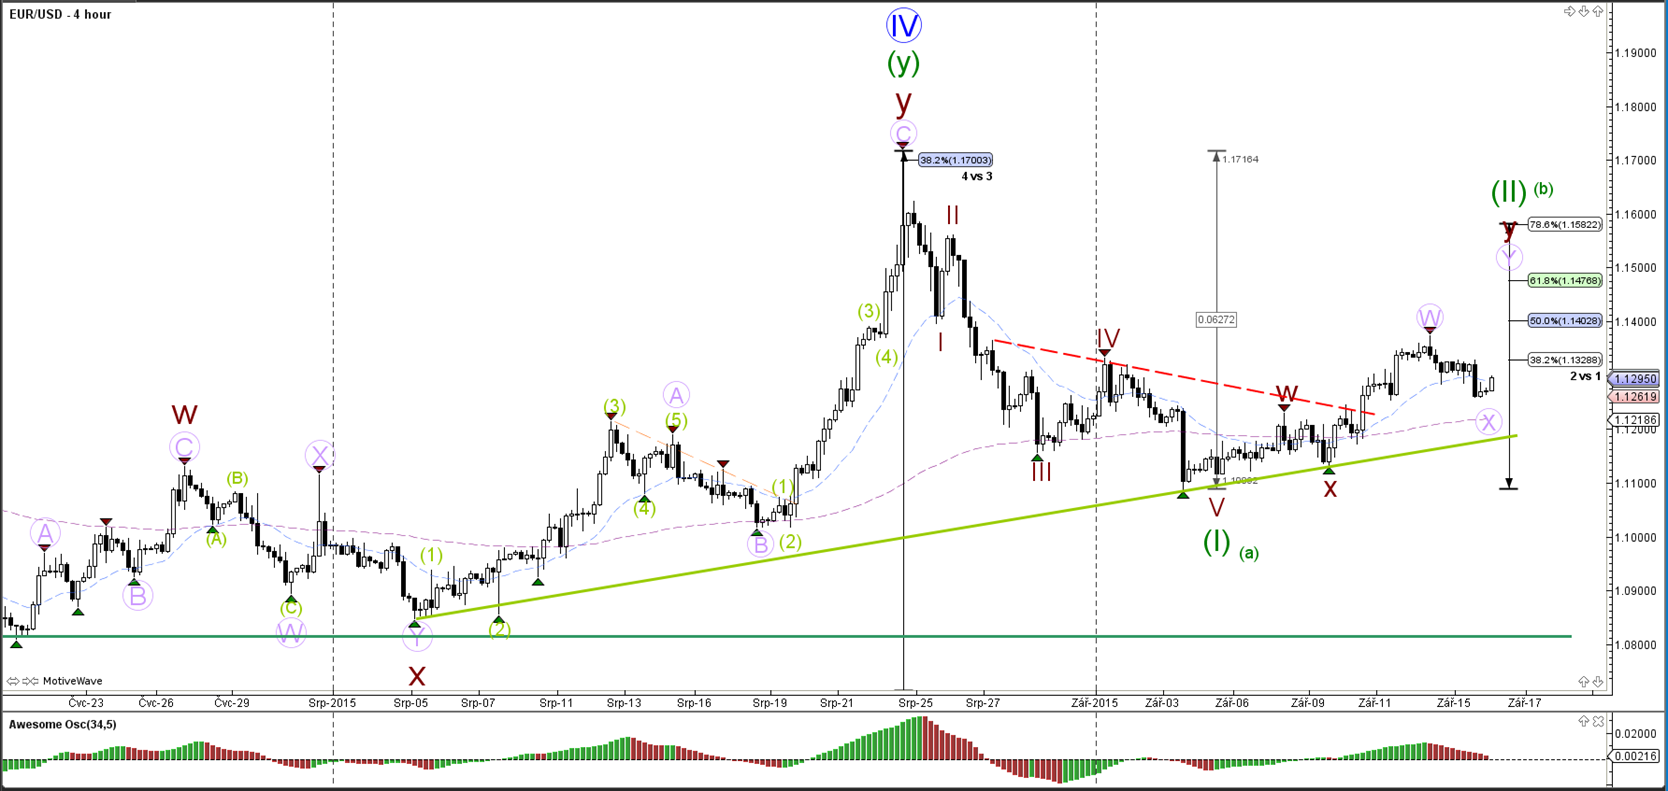
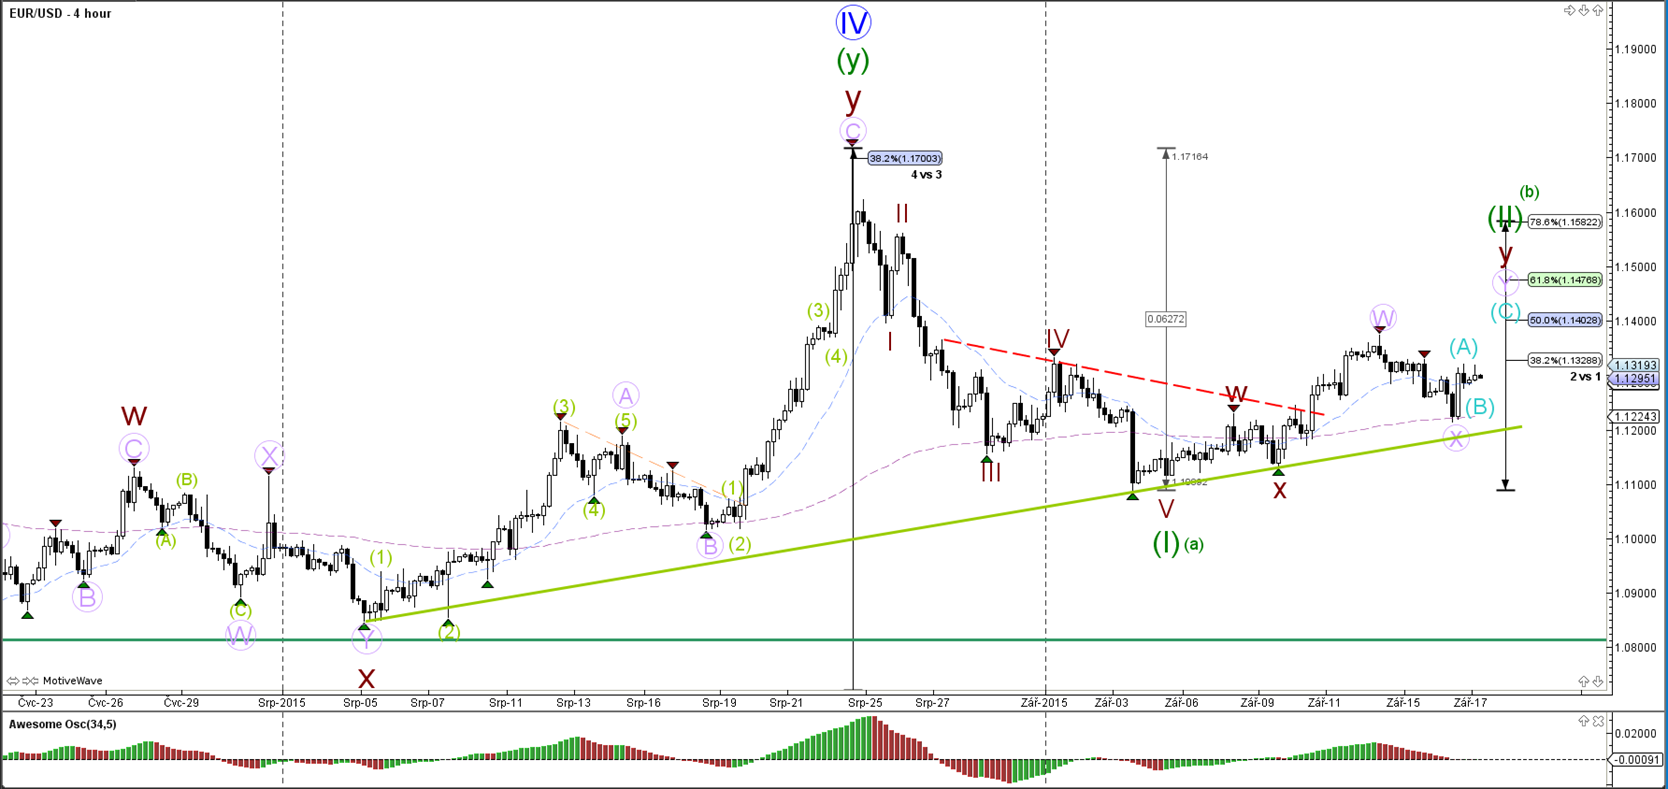
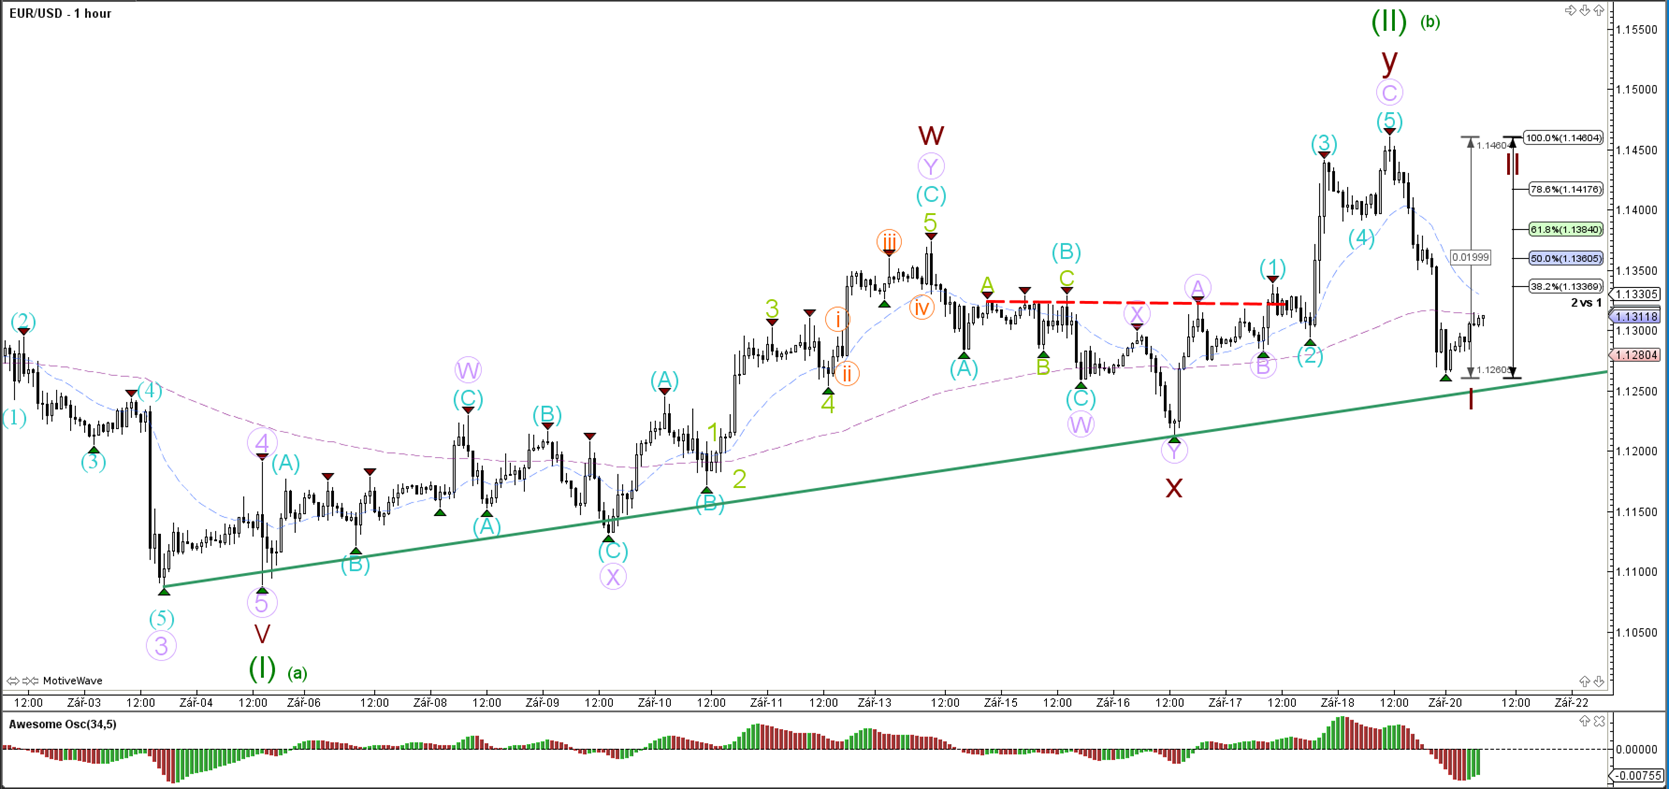
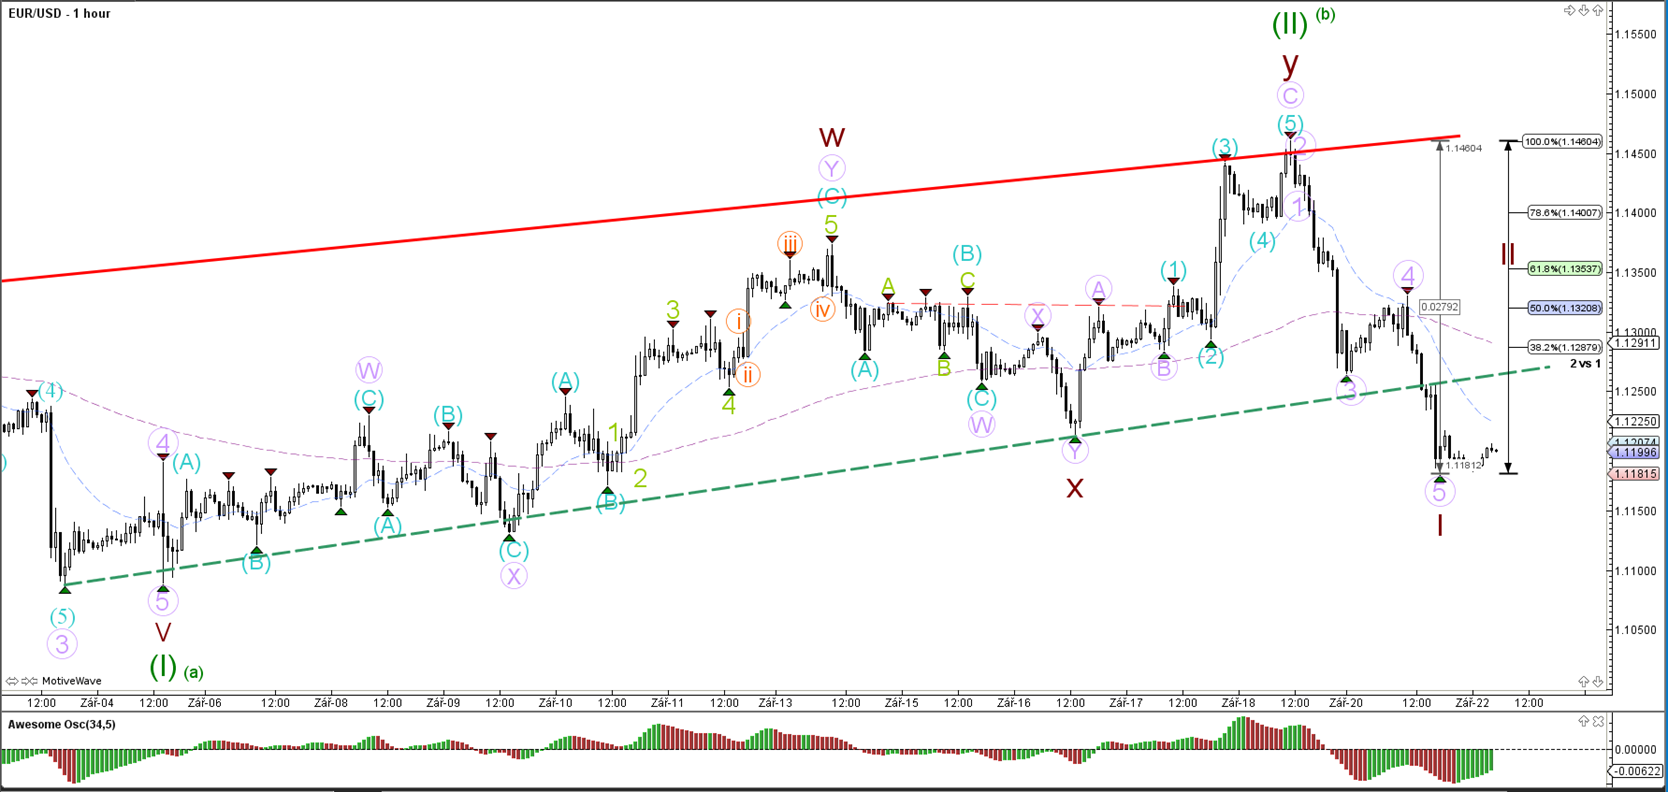
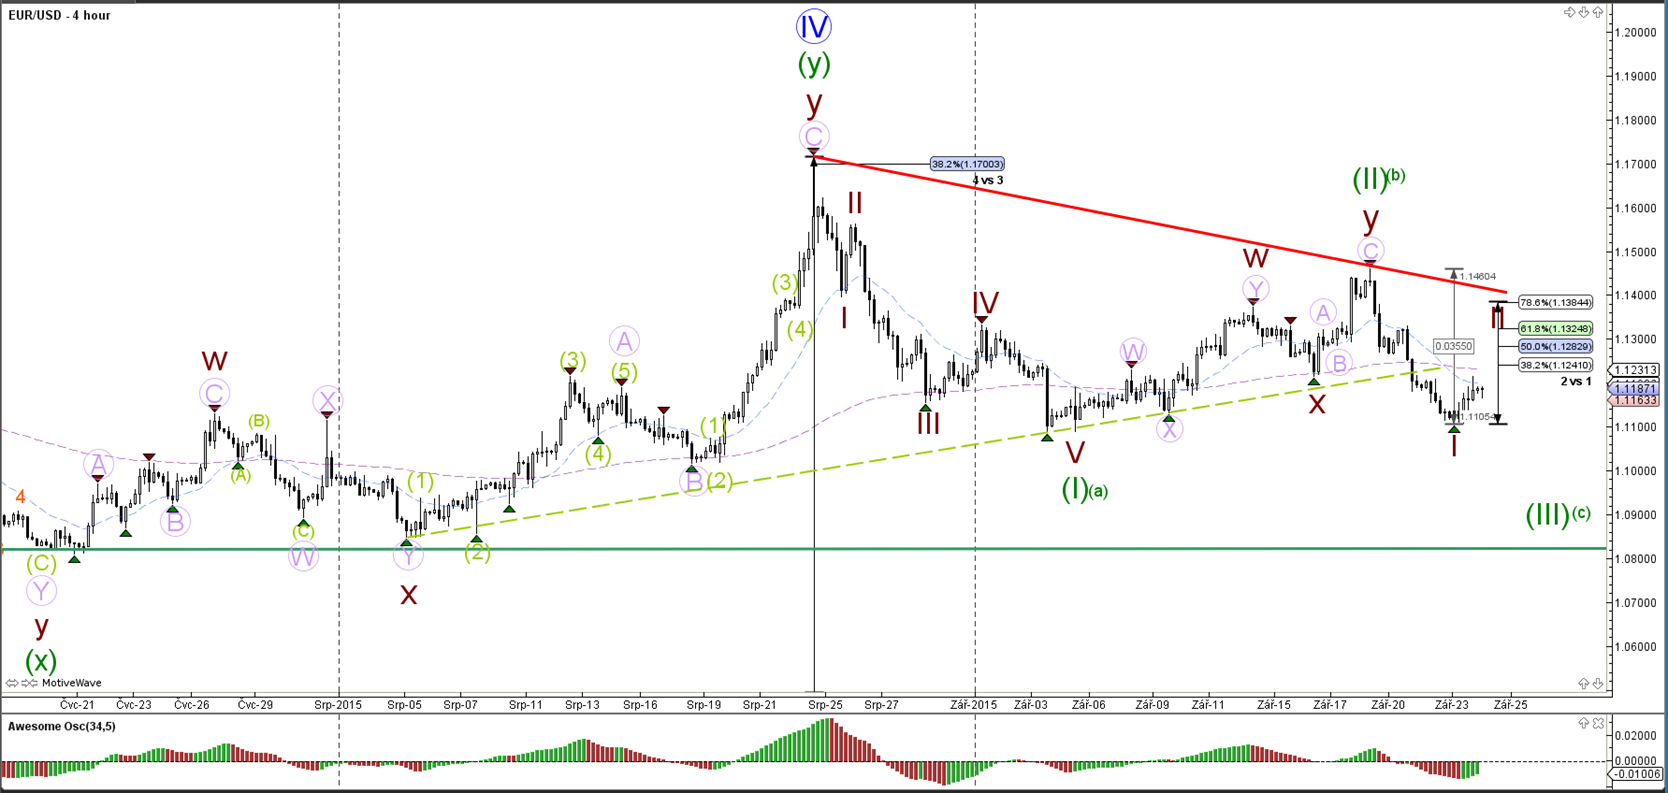
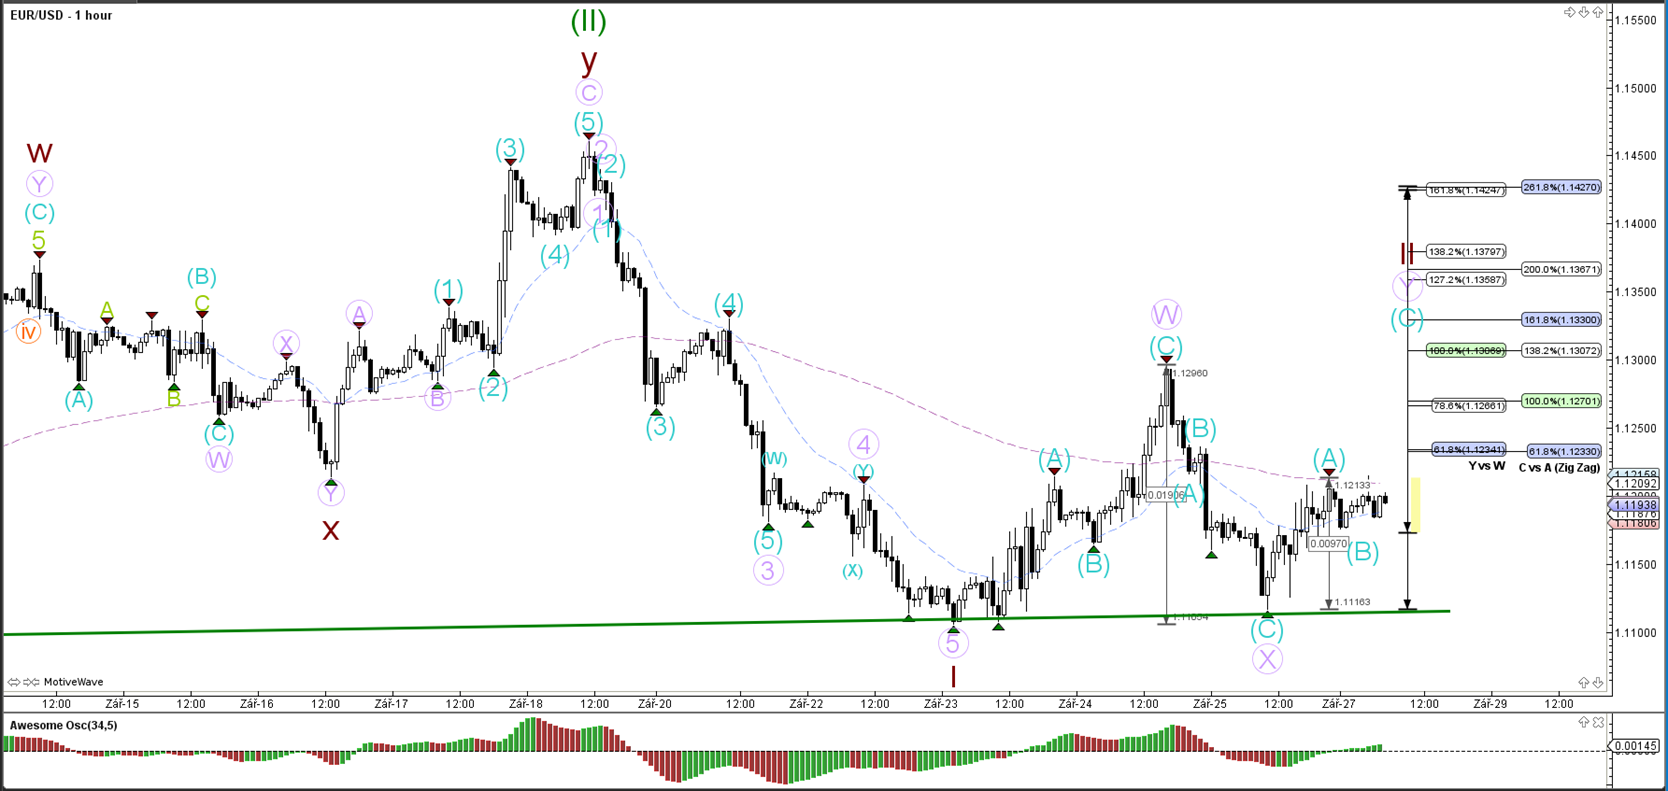
EUR/USD
4 hour
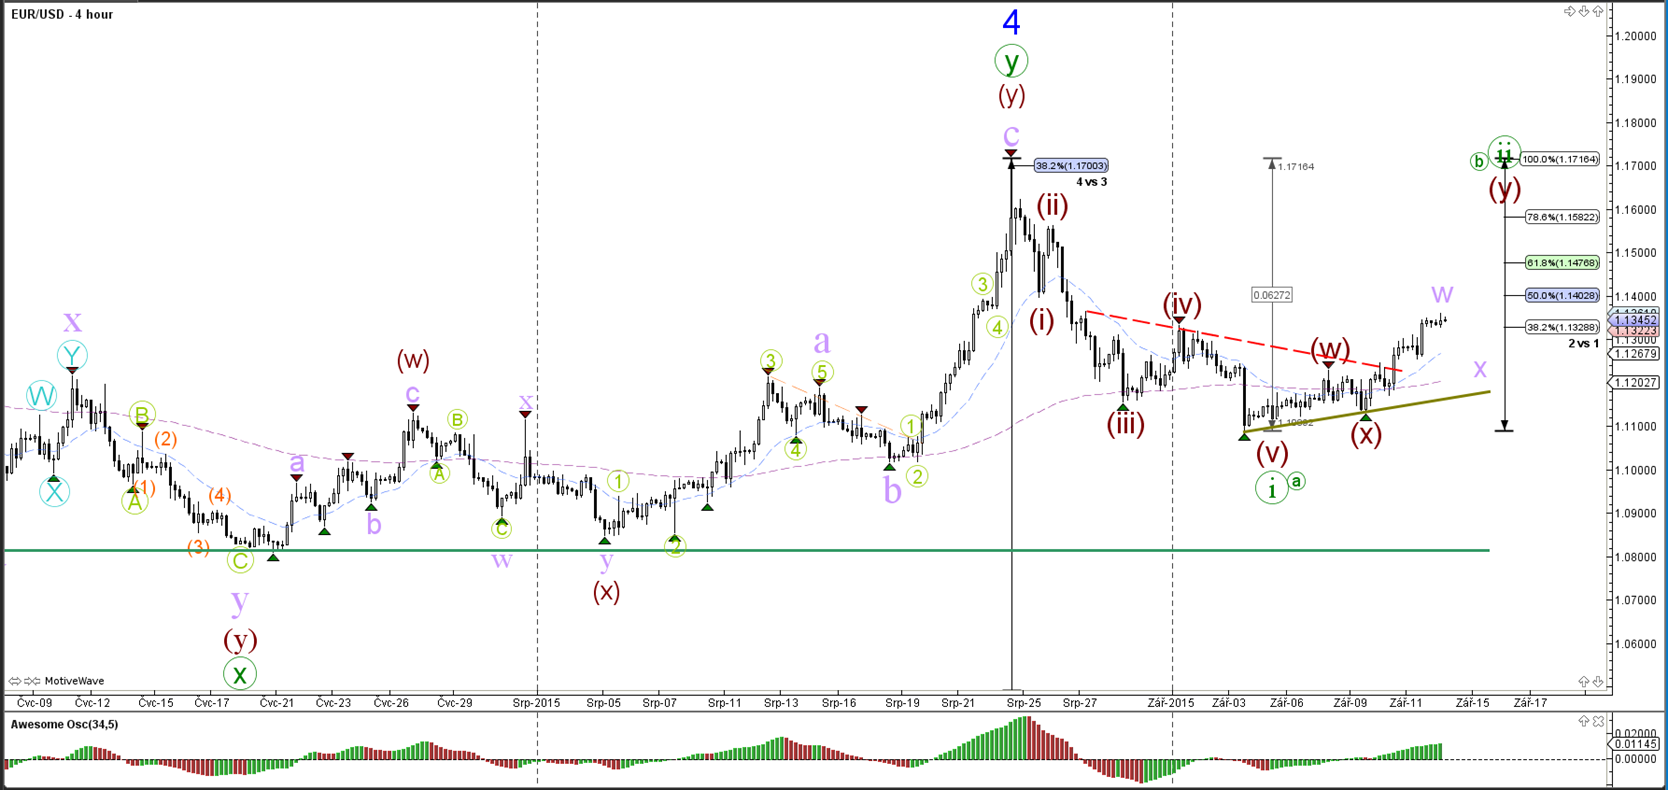
The EUR/USD is most likely expanding the wave 2 correction (green) via a WXY (purple) within wave Y (brown).
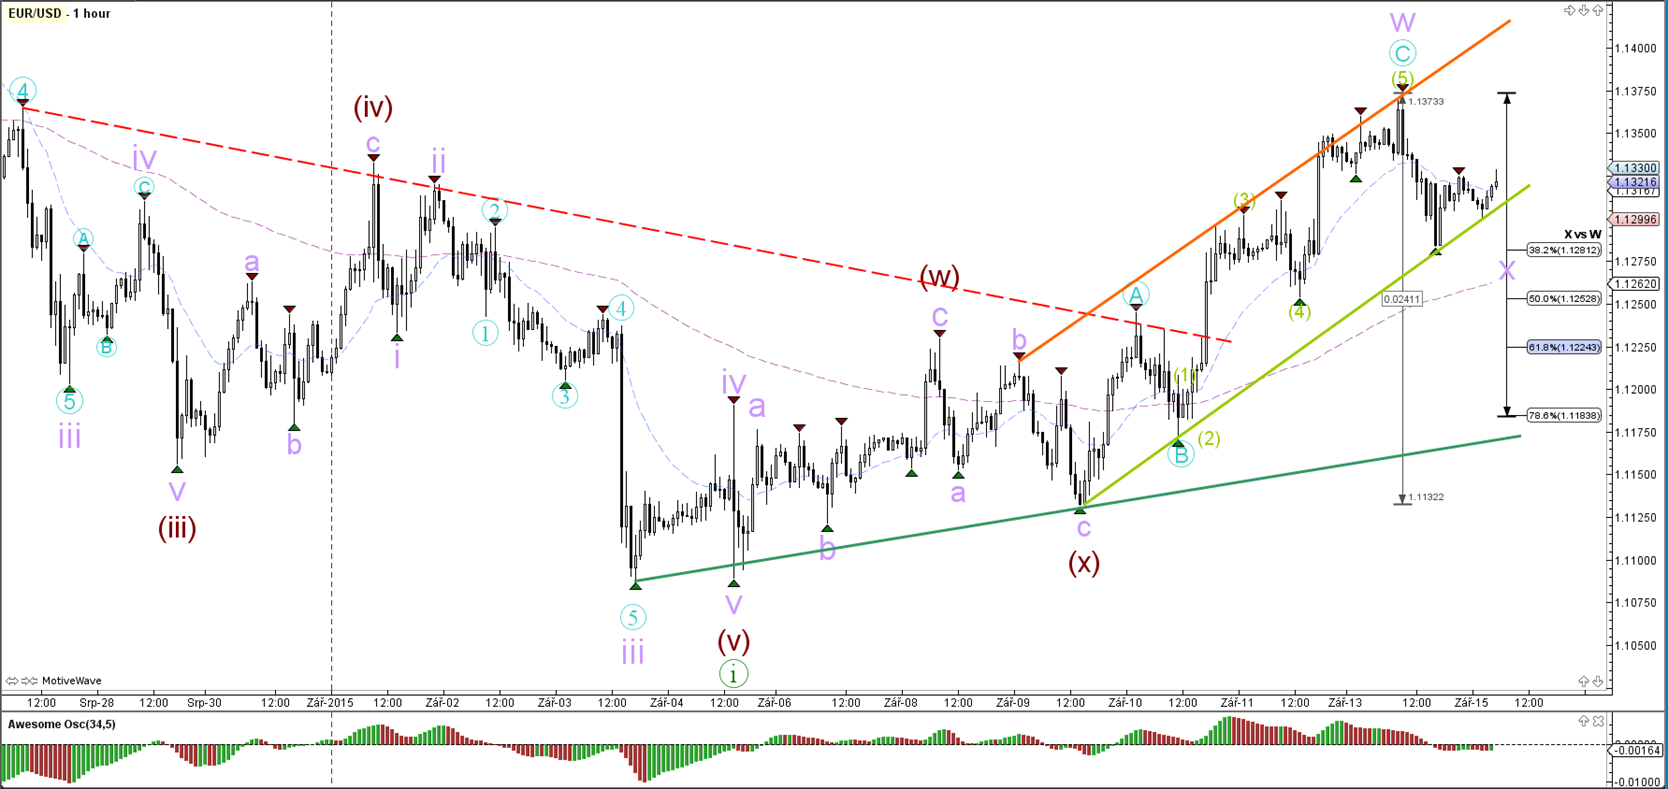
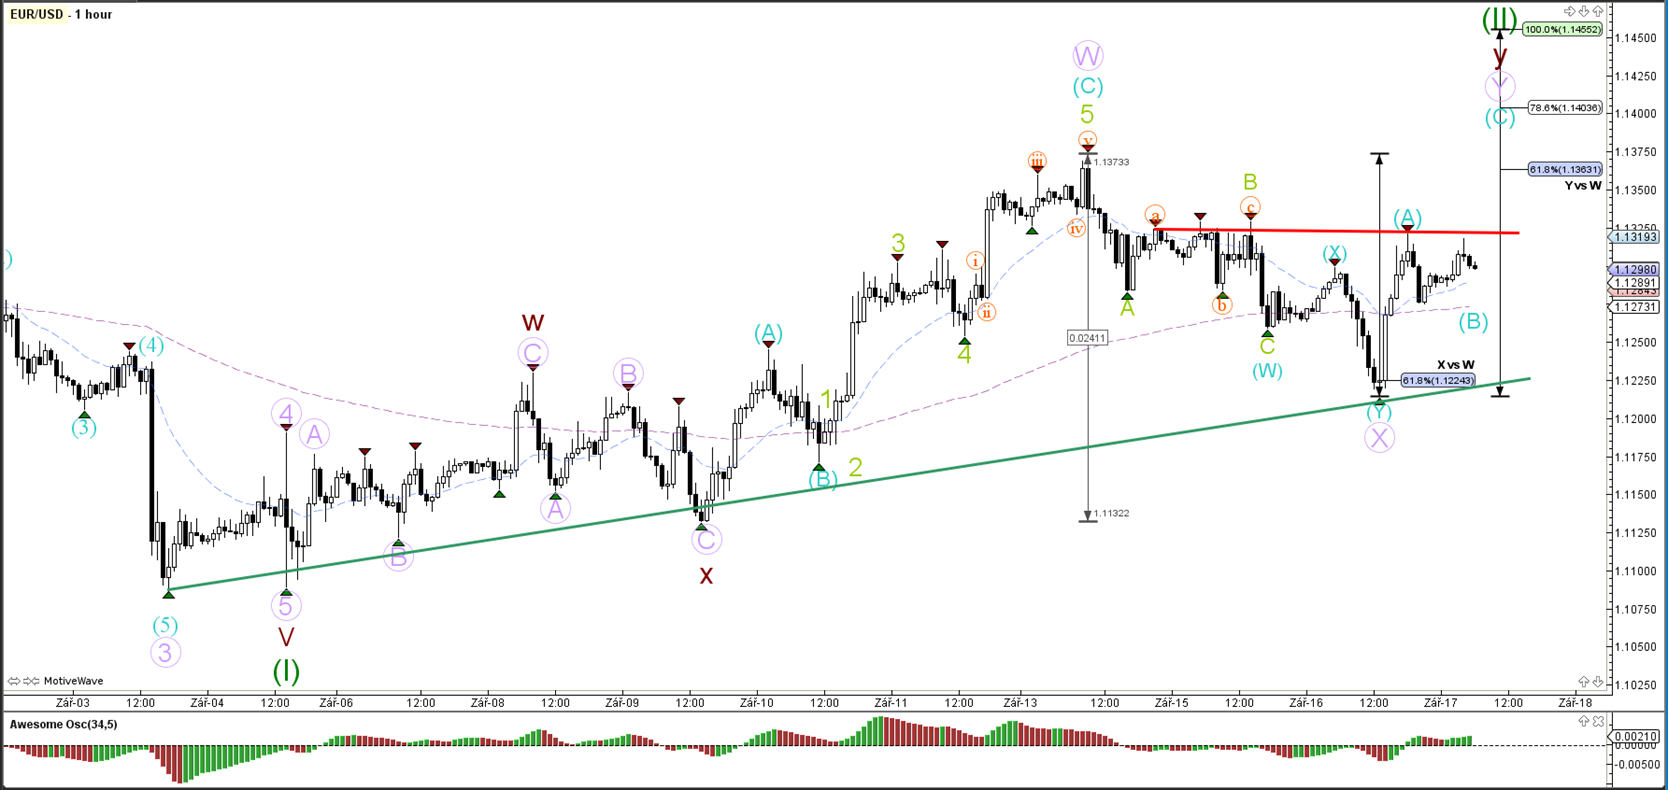
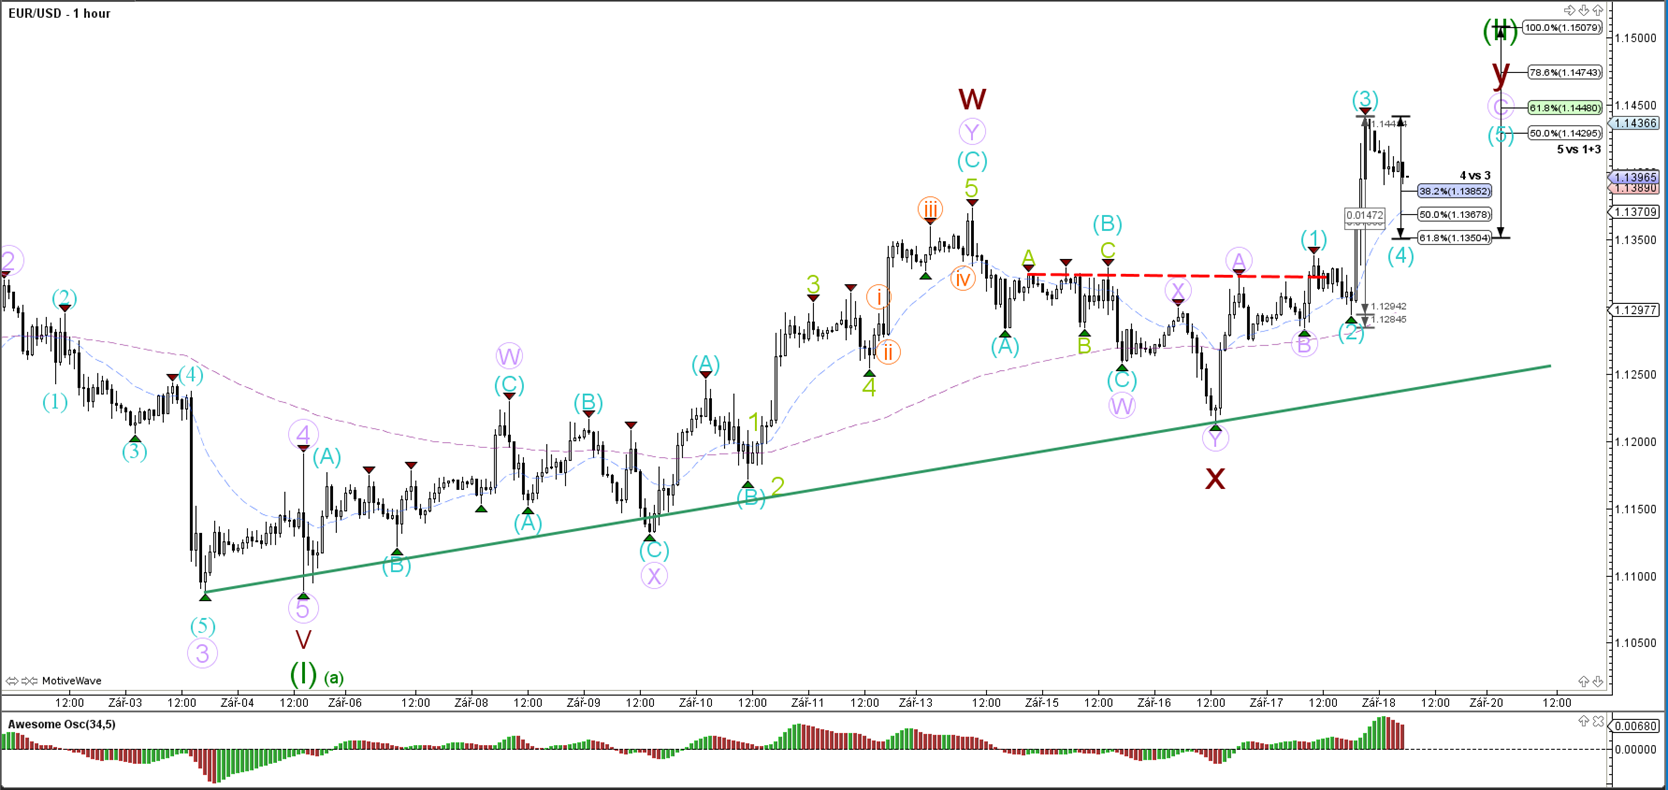
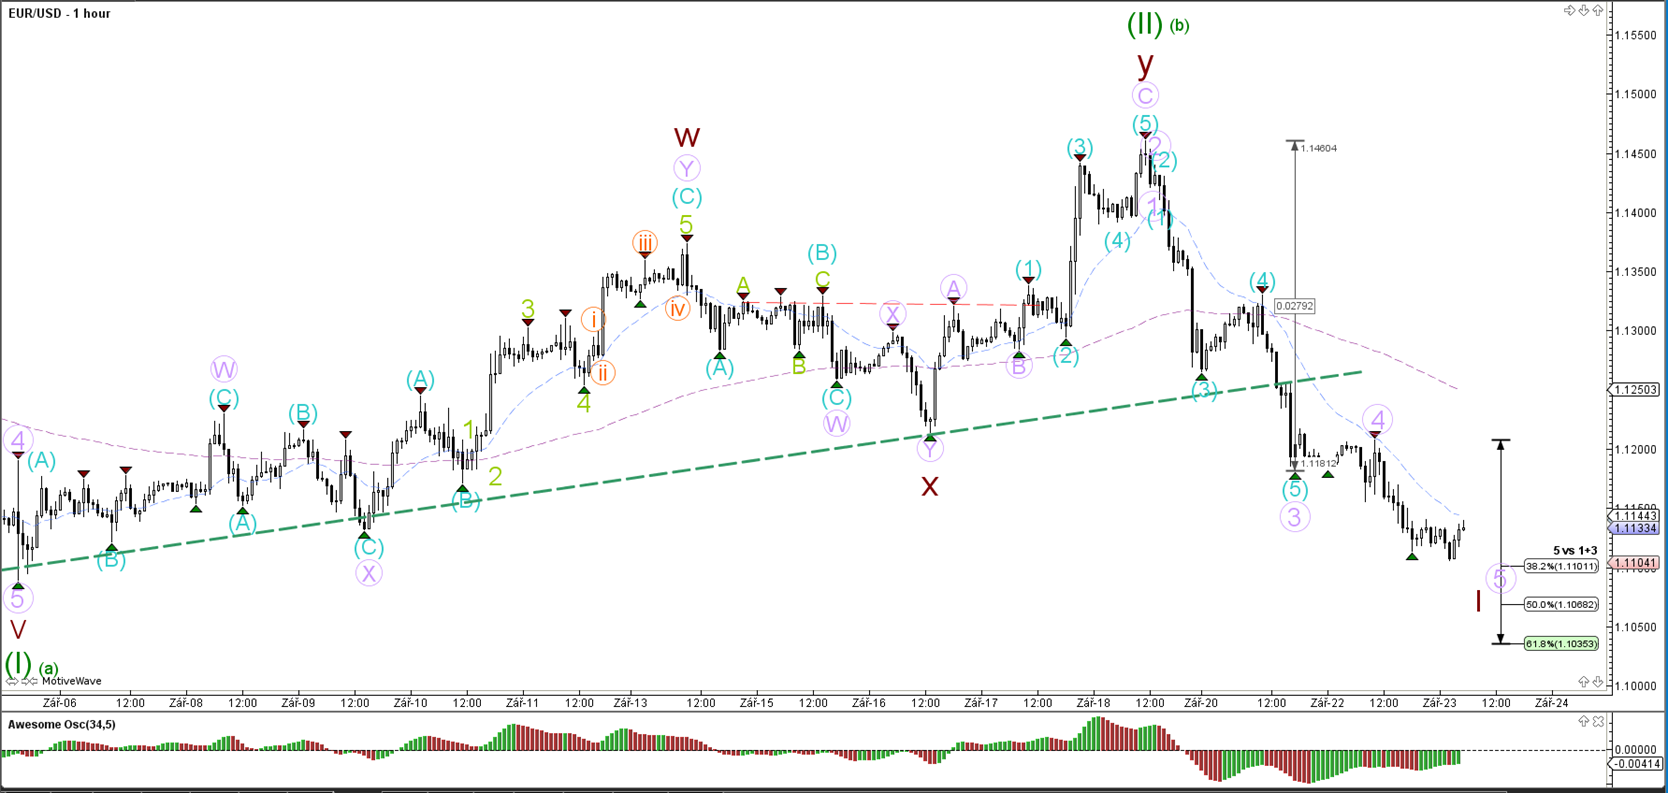
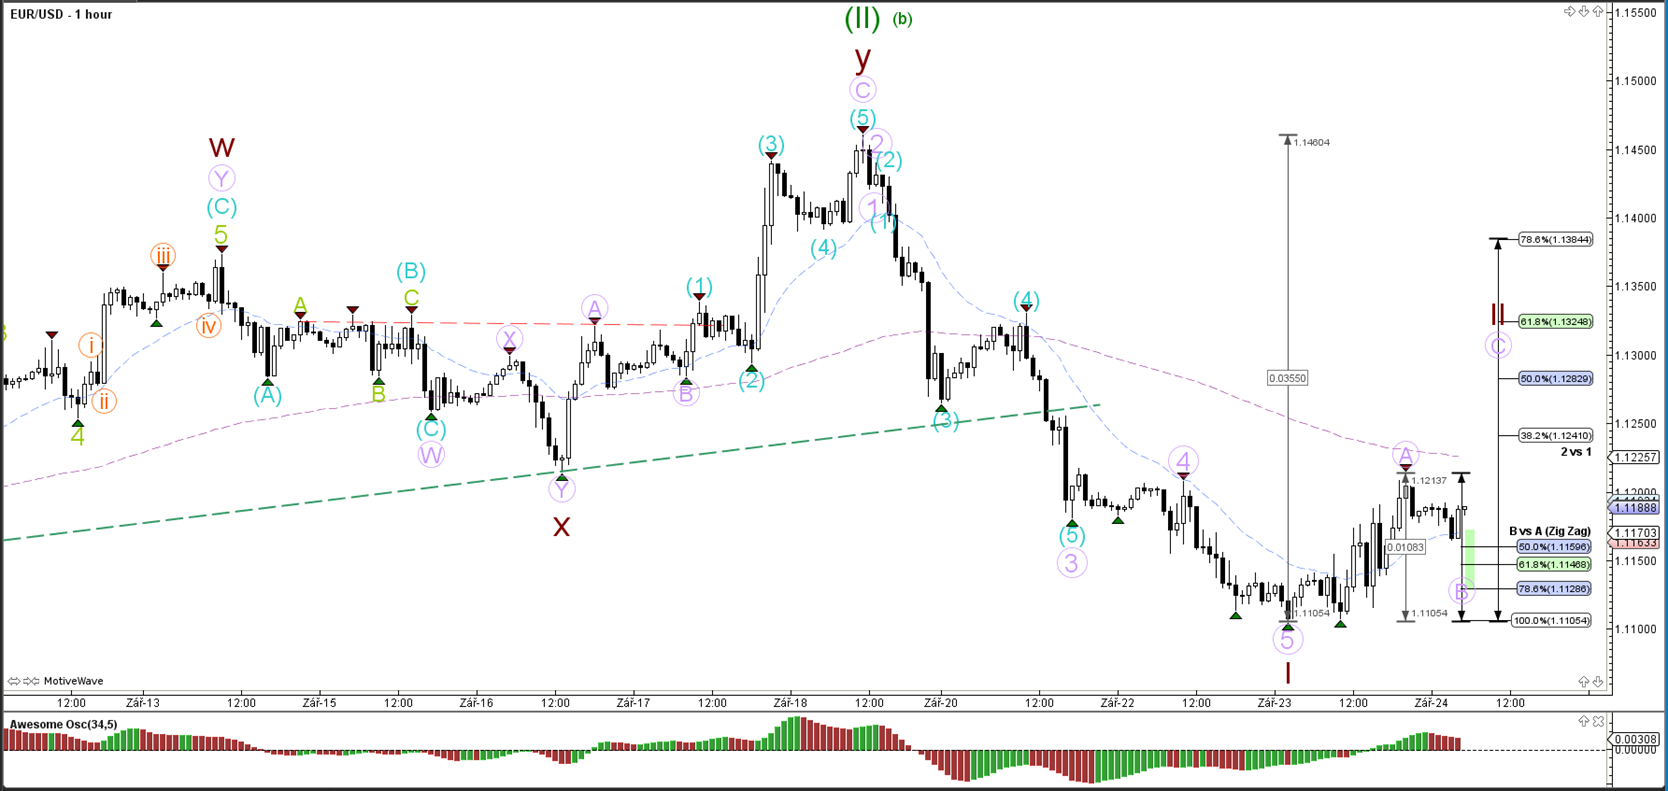
1 hour
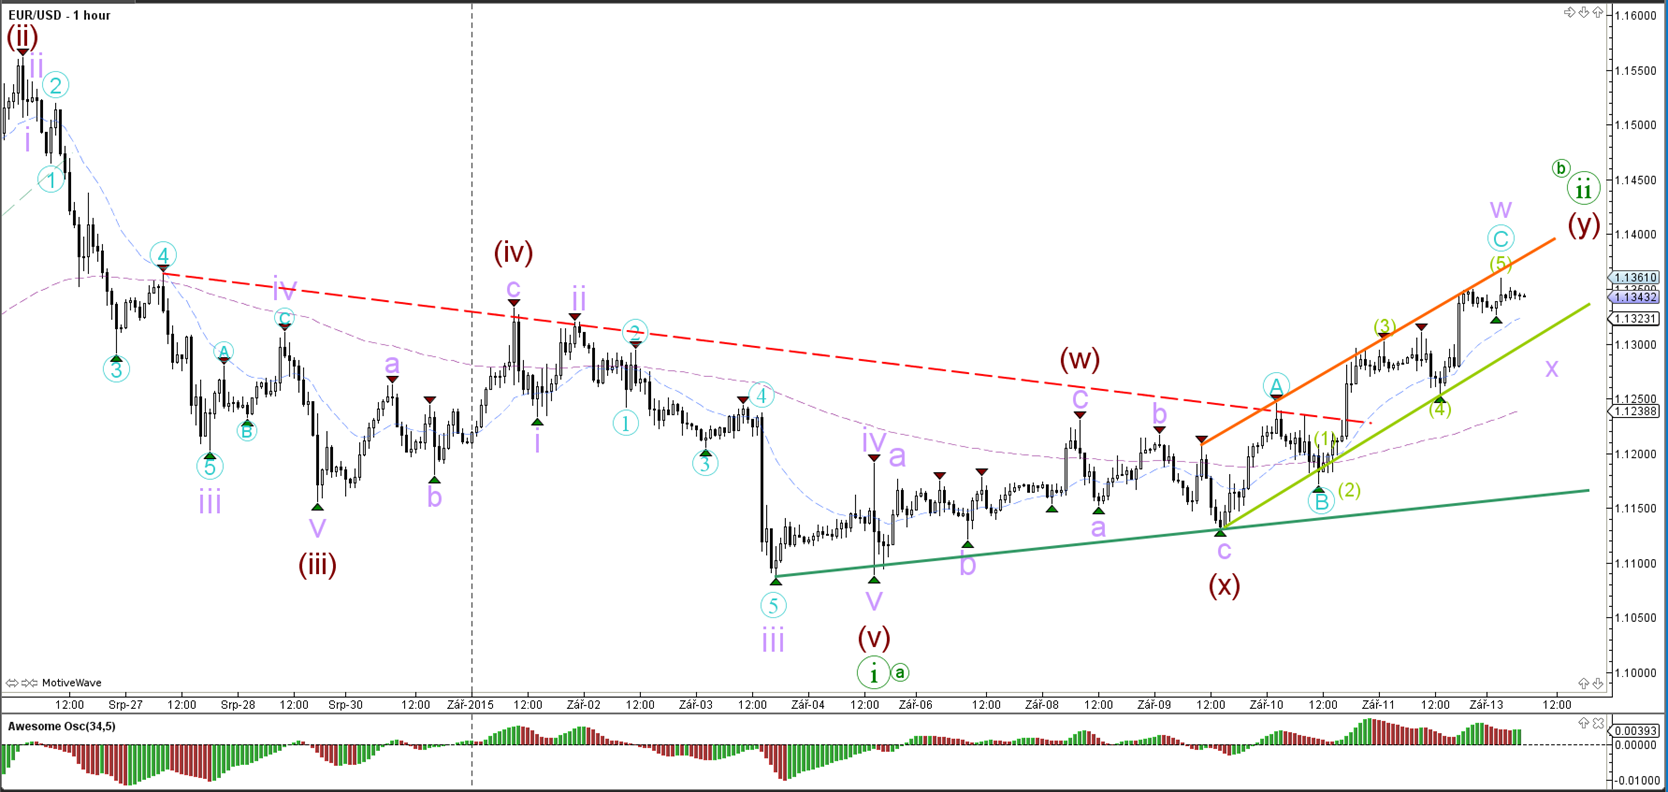
The EUR/USD pushed up once more on Friday which is probably a wave 5 (green) within the ABC zigzag (blue). Whether the wave 5 is completed or not remains to be seen. A bearish break below the channel (green/orange) could indicate the start of wave X (purple).
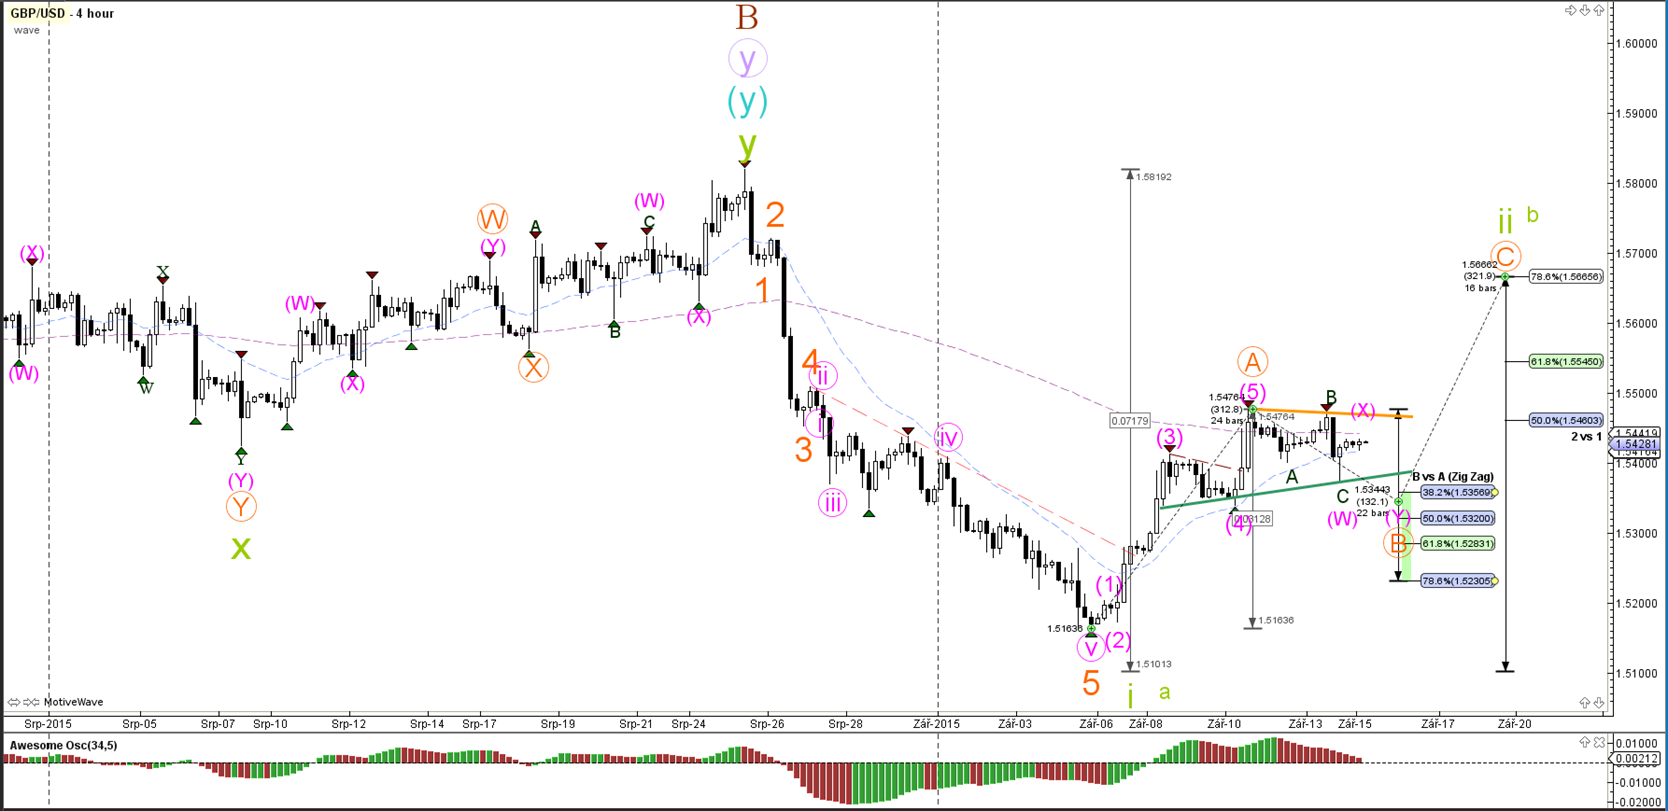
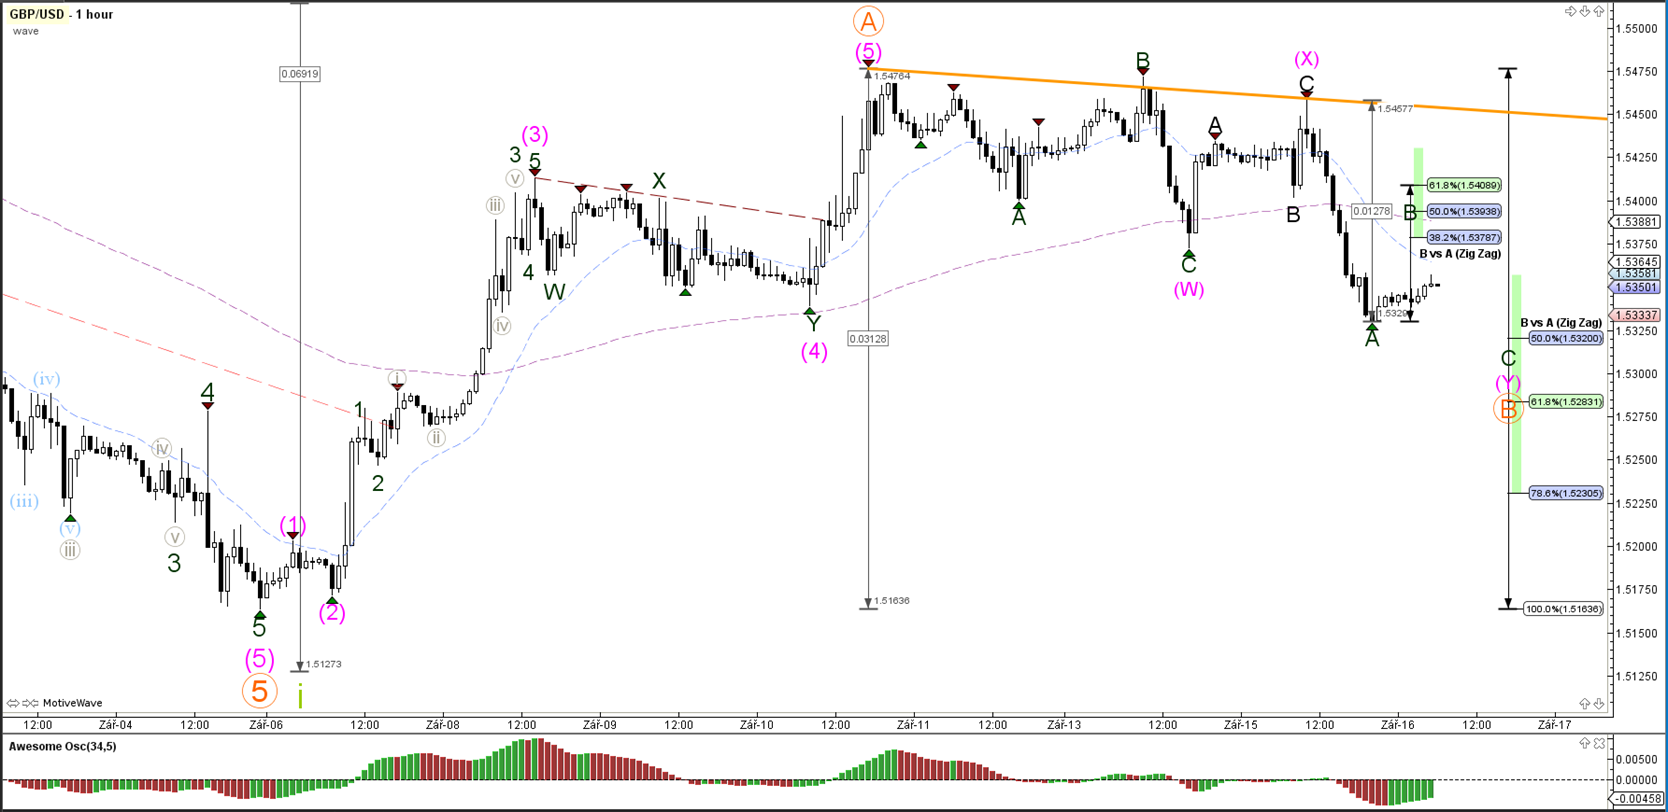
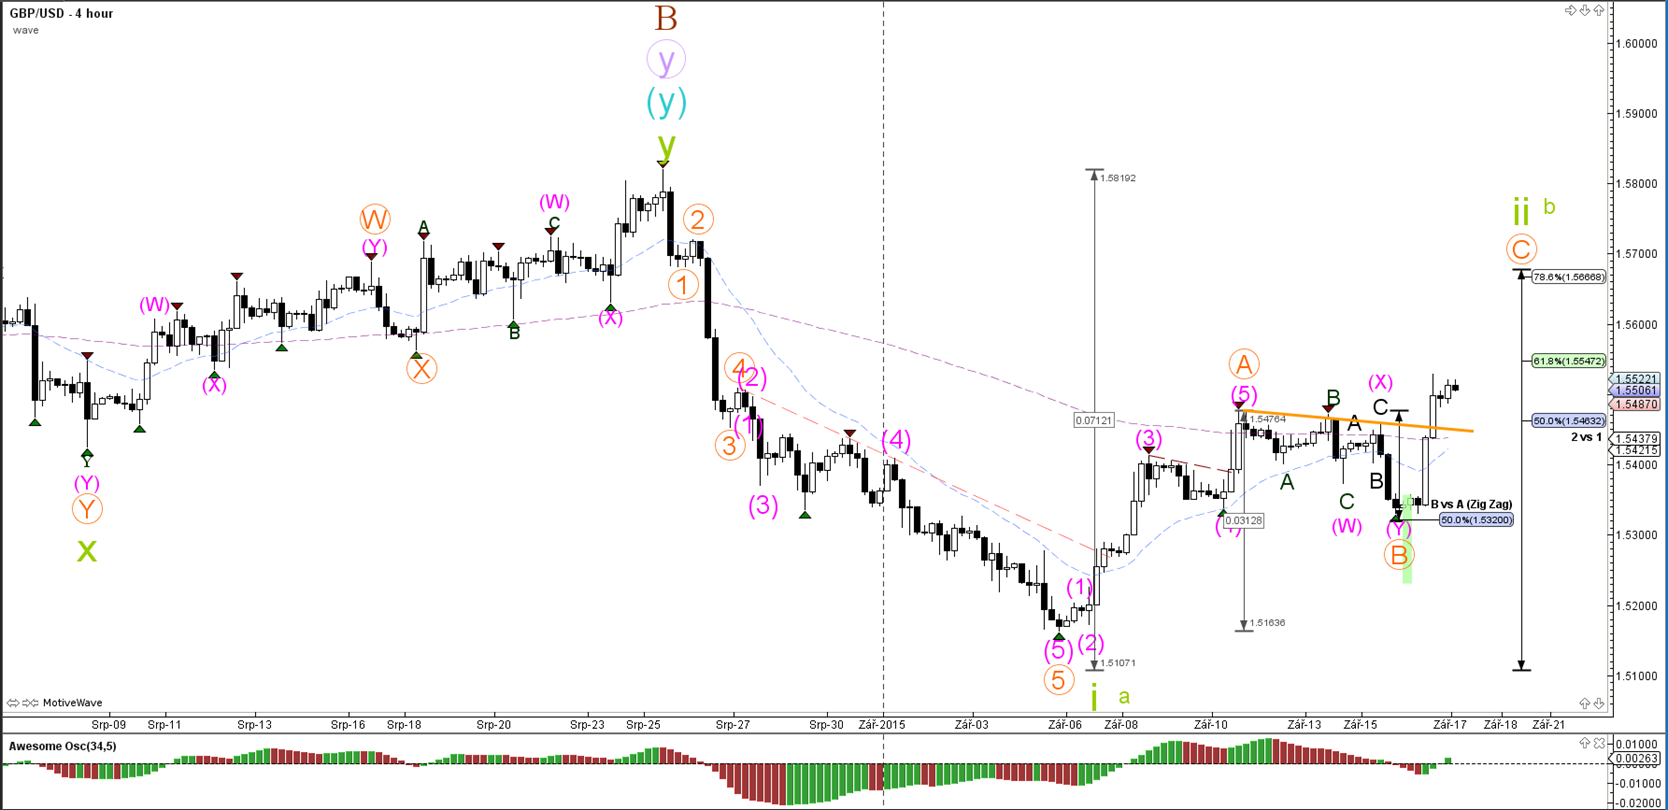
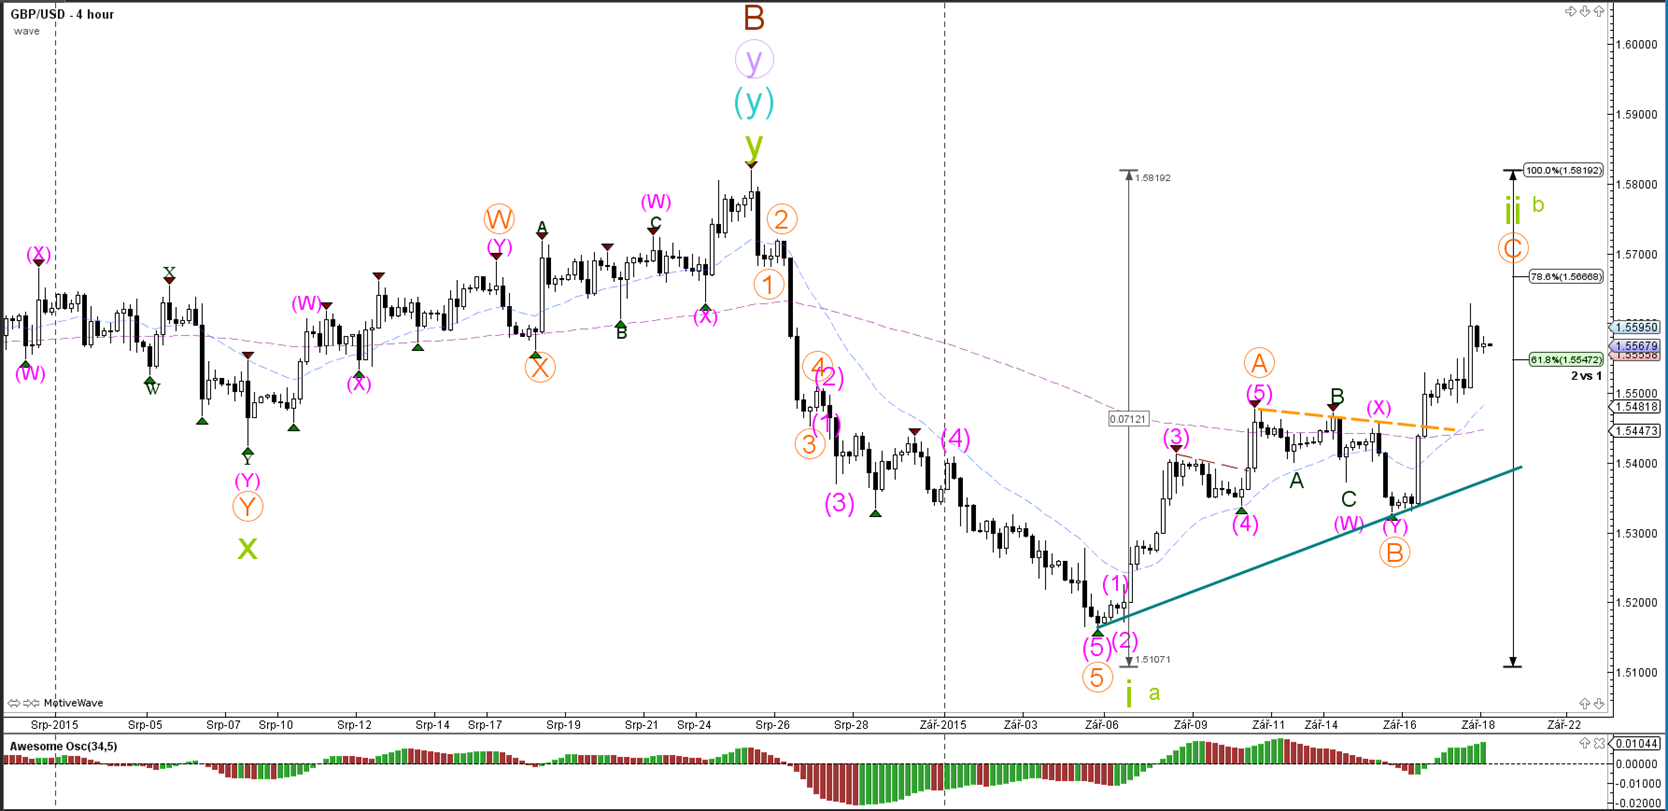
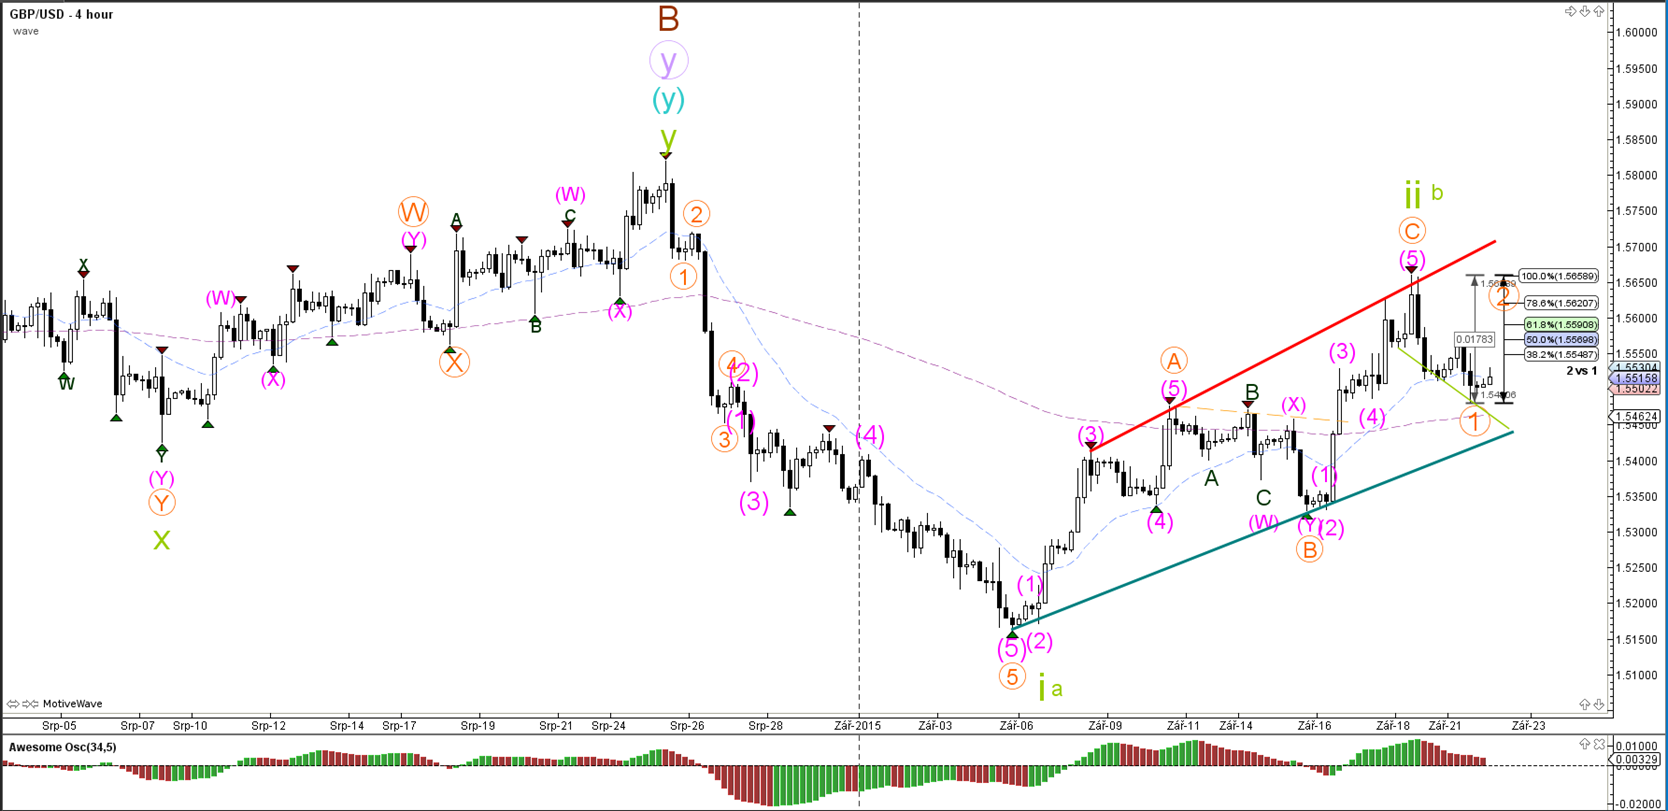
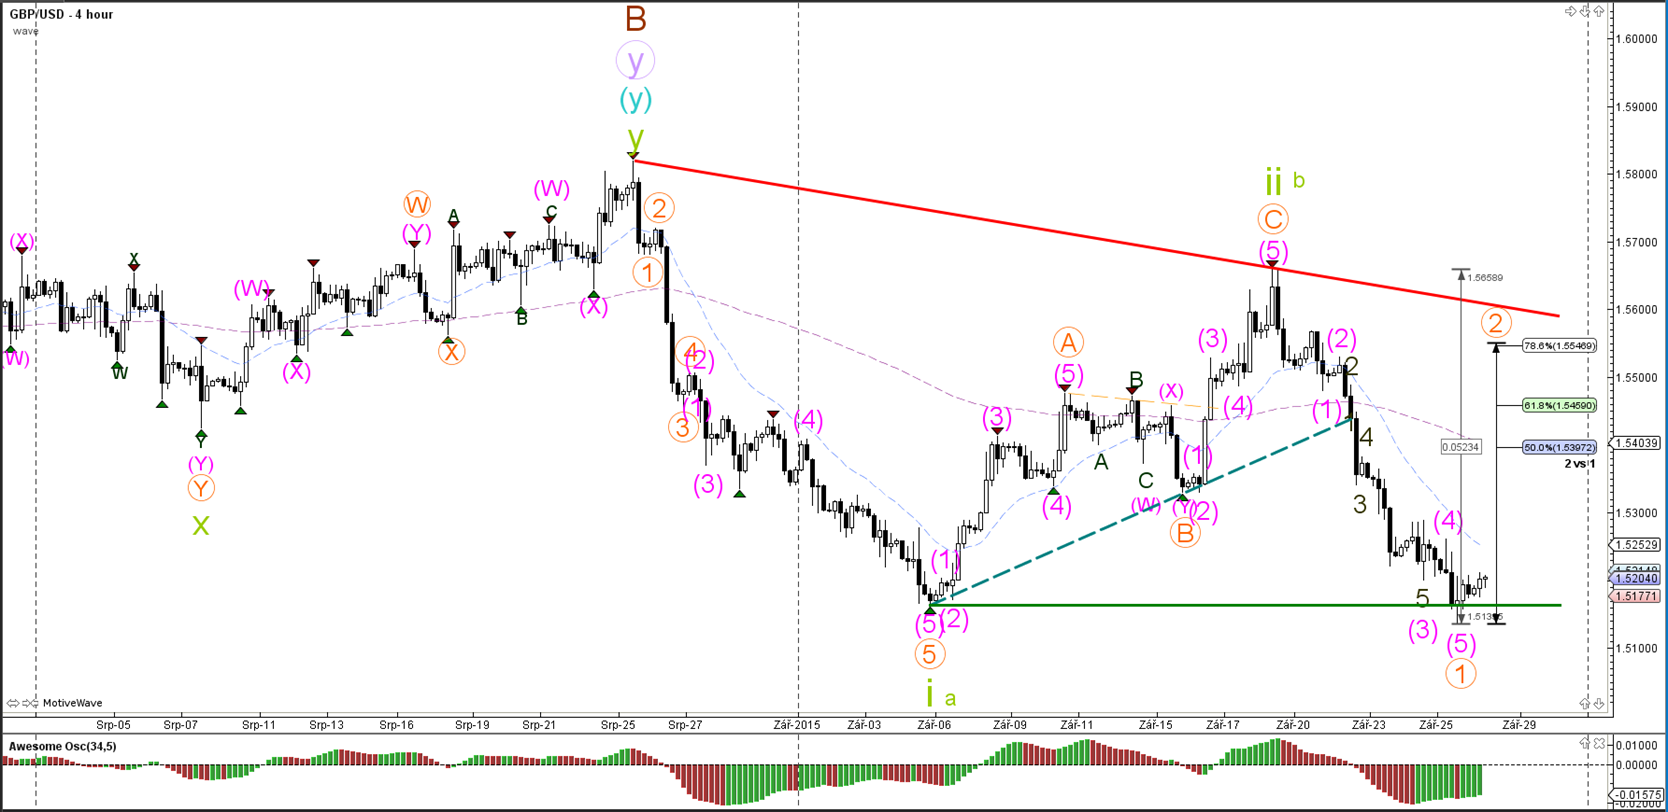
GBP/USD
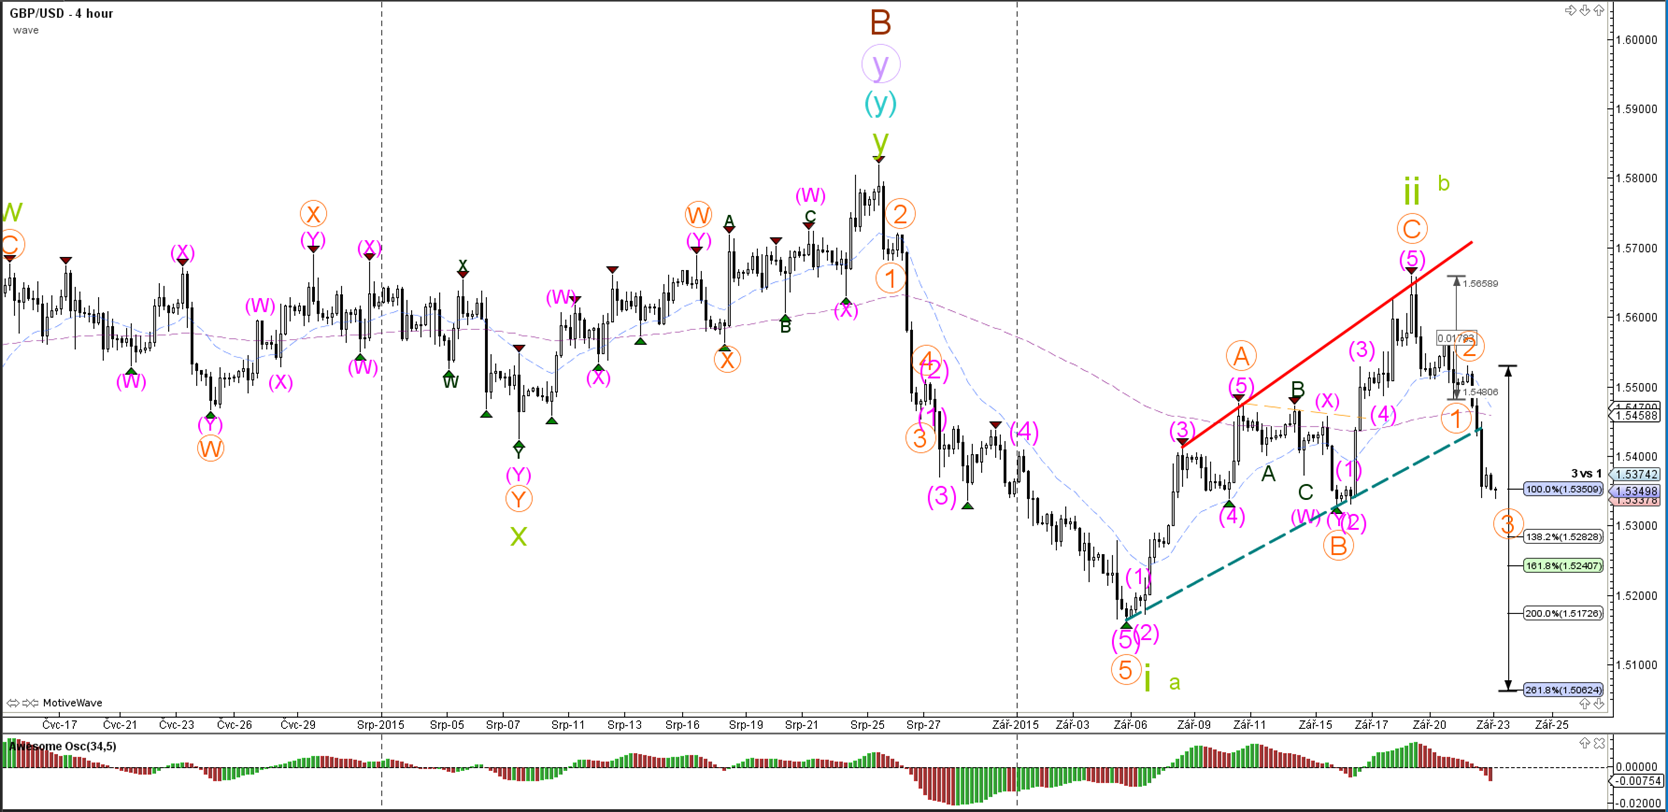
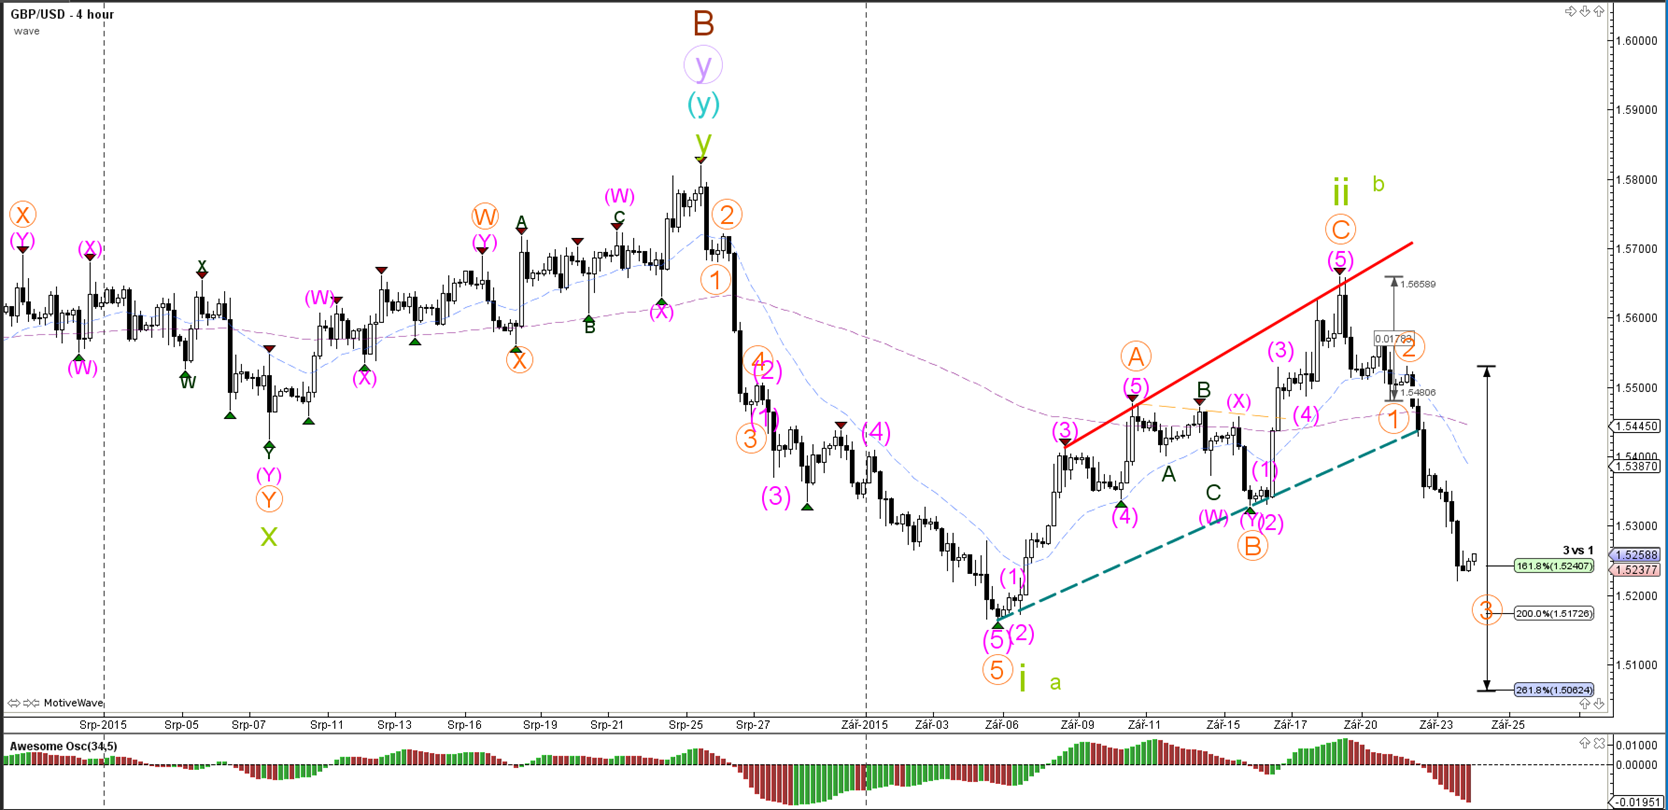
4 hour
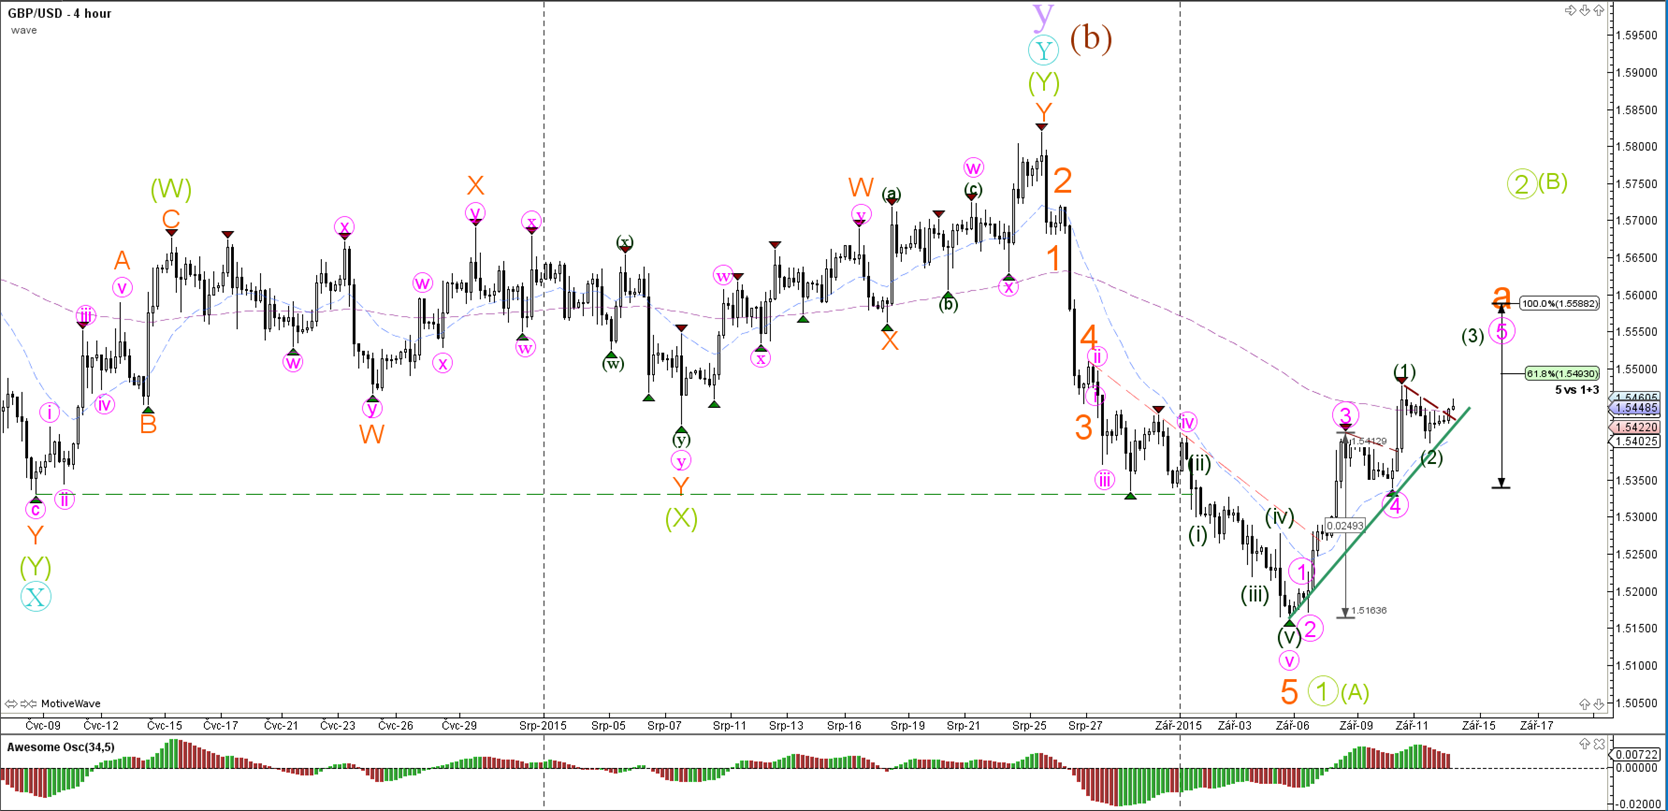
The GBPUSD is most likely expanding the wave 5 (pink) but a break below the support trend line (green) could indicate the completion of that wave 5 and wave A (orange).
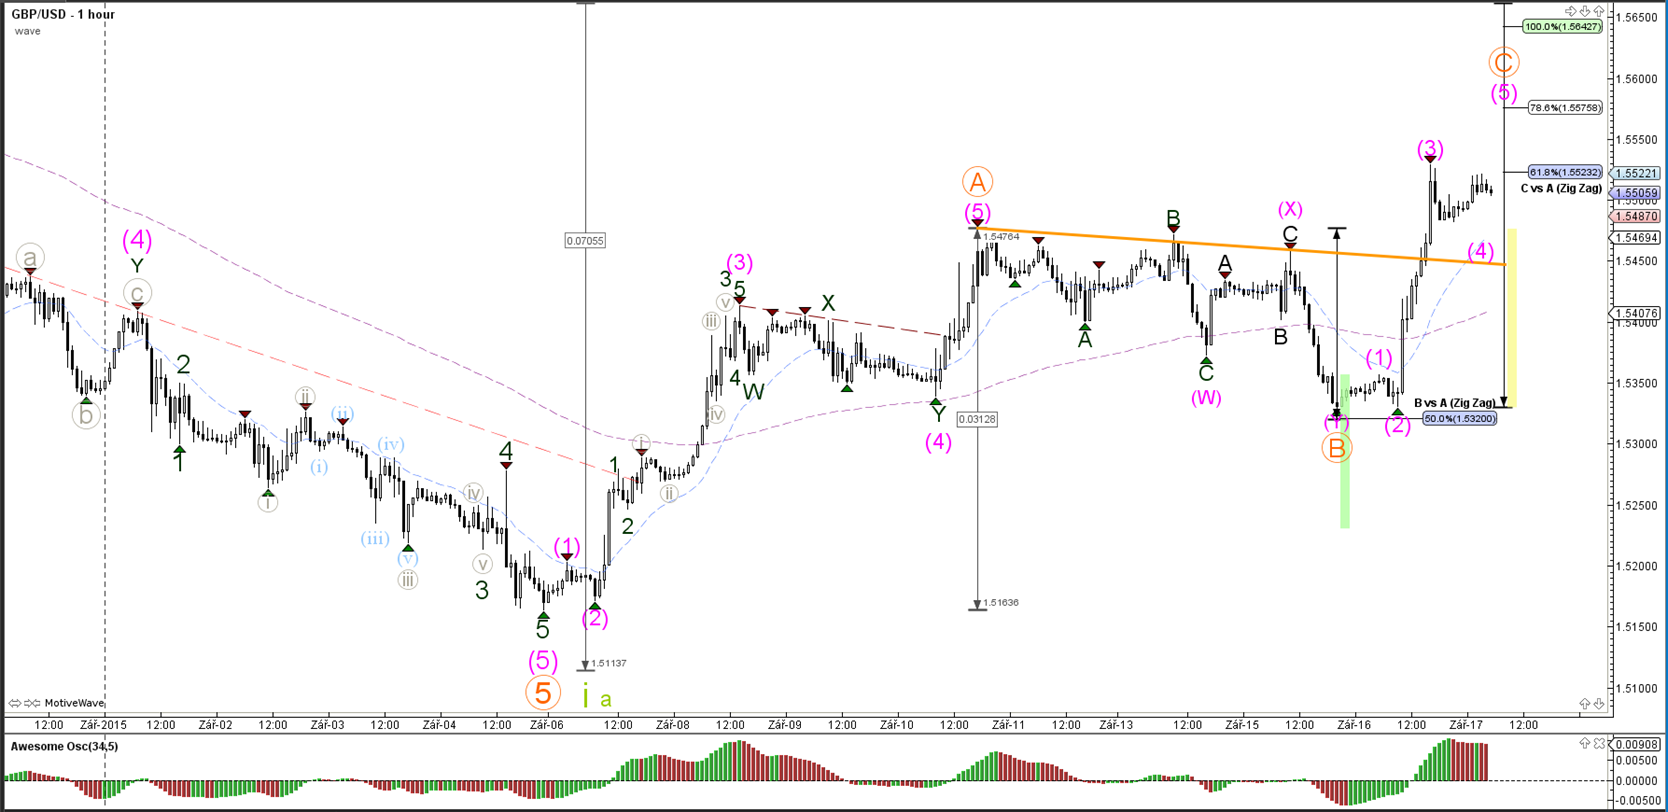
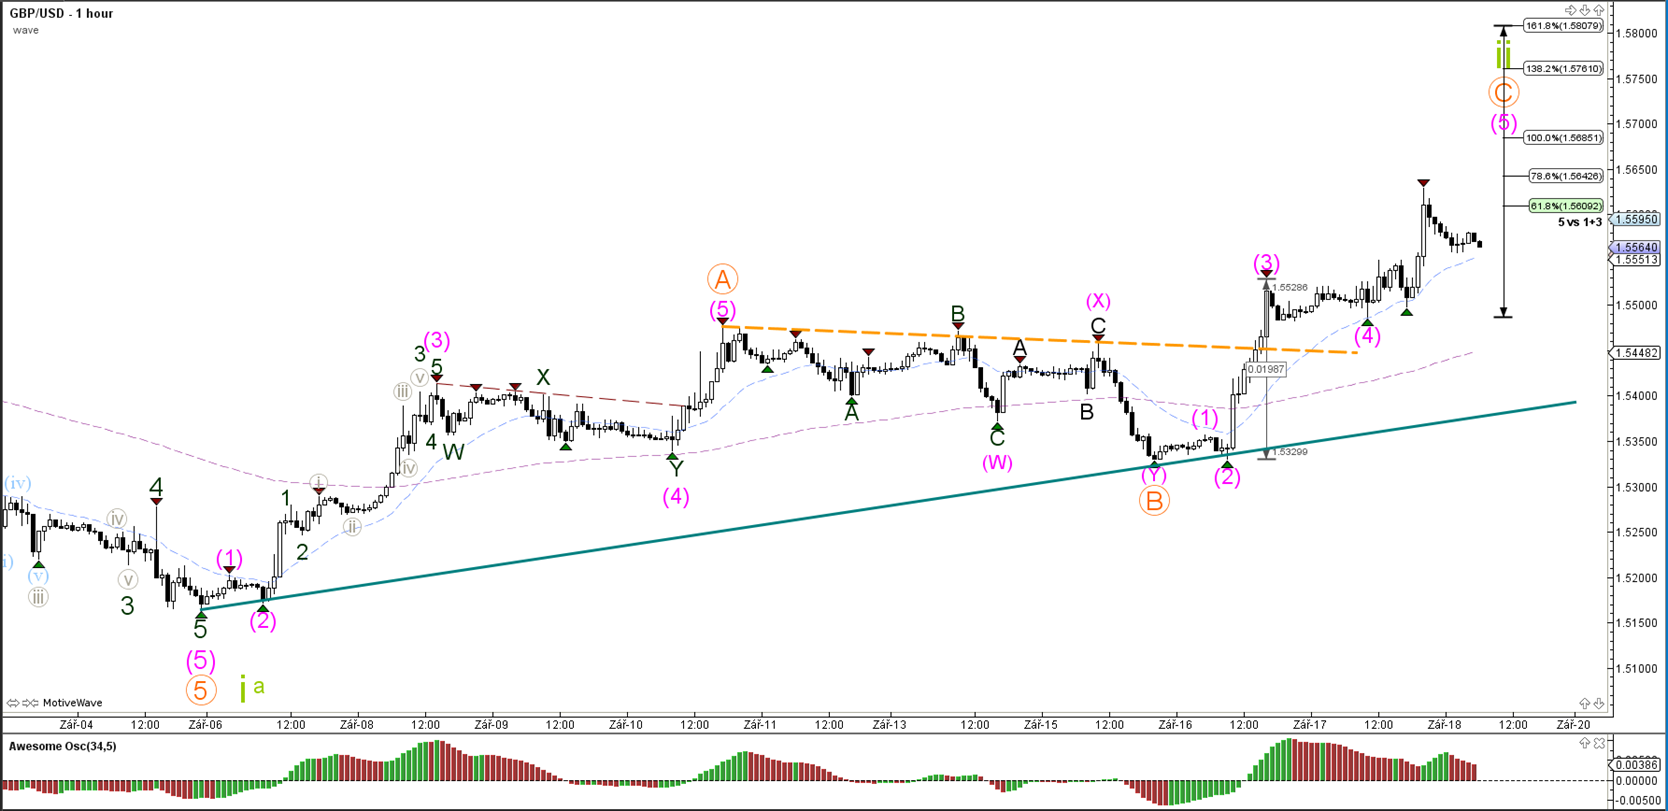
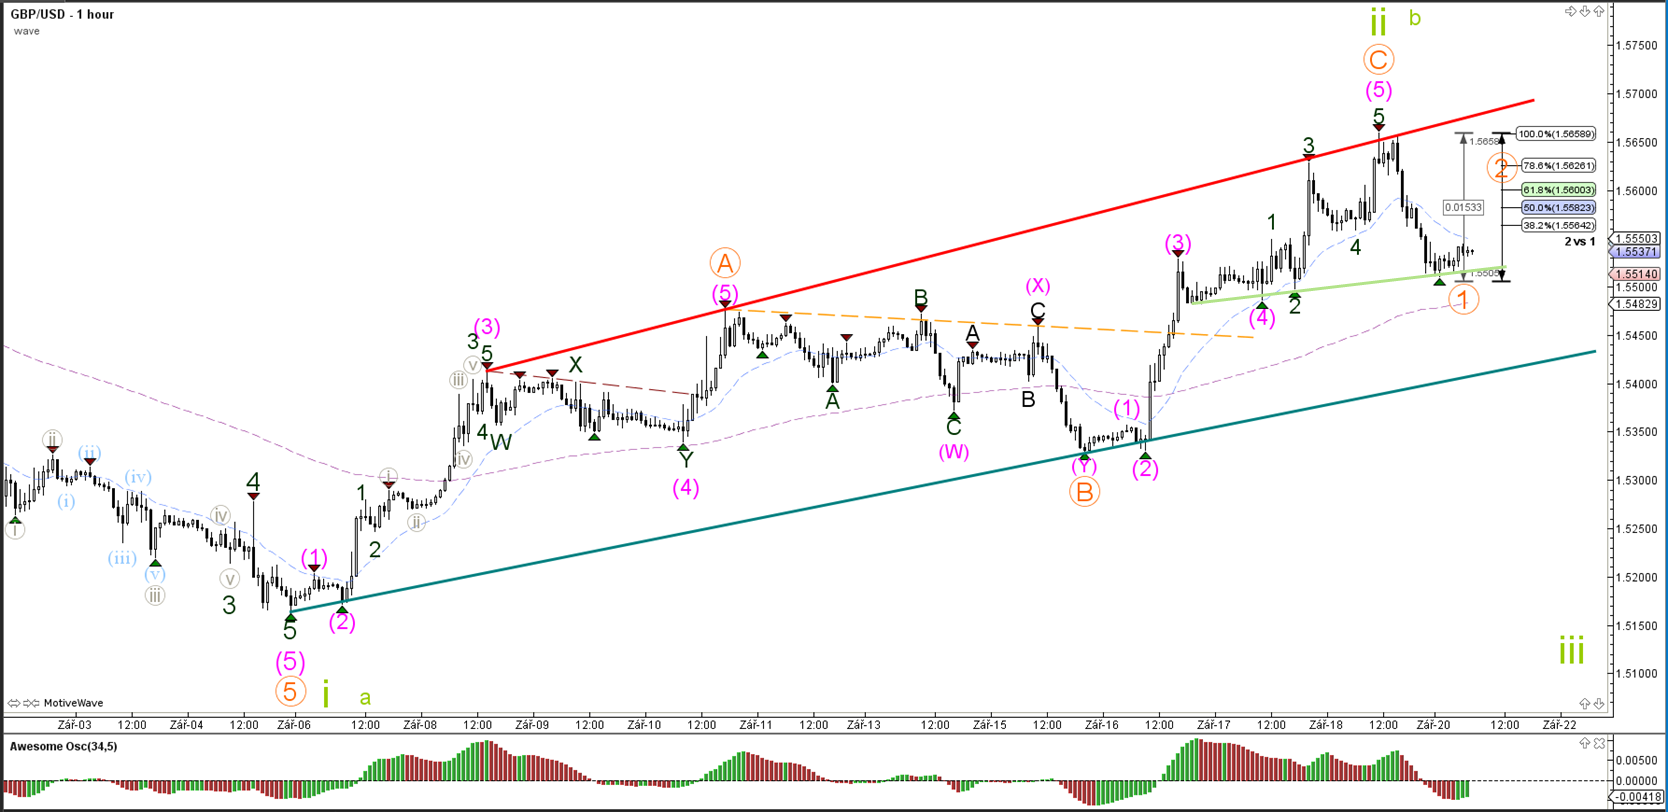
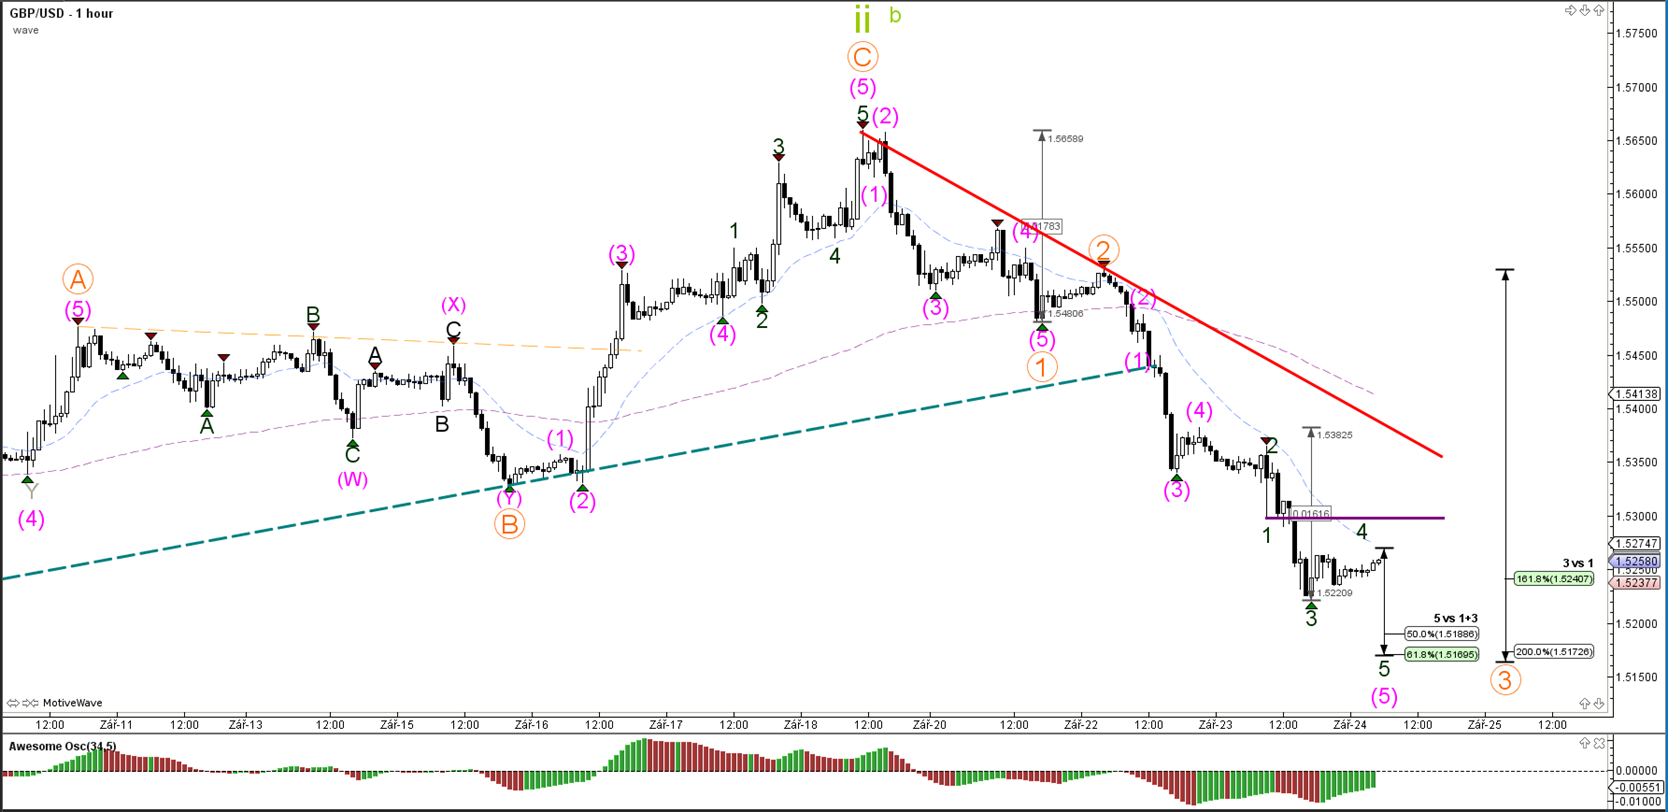
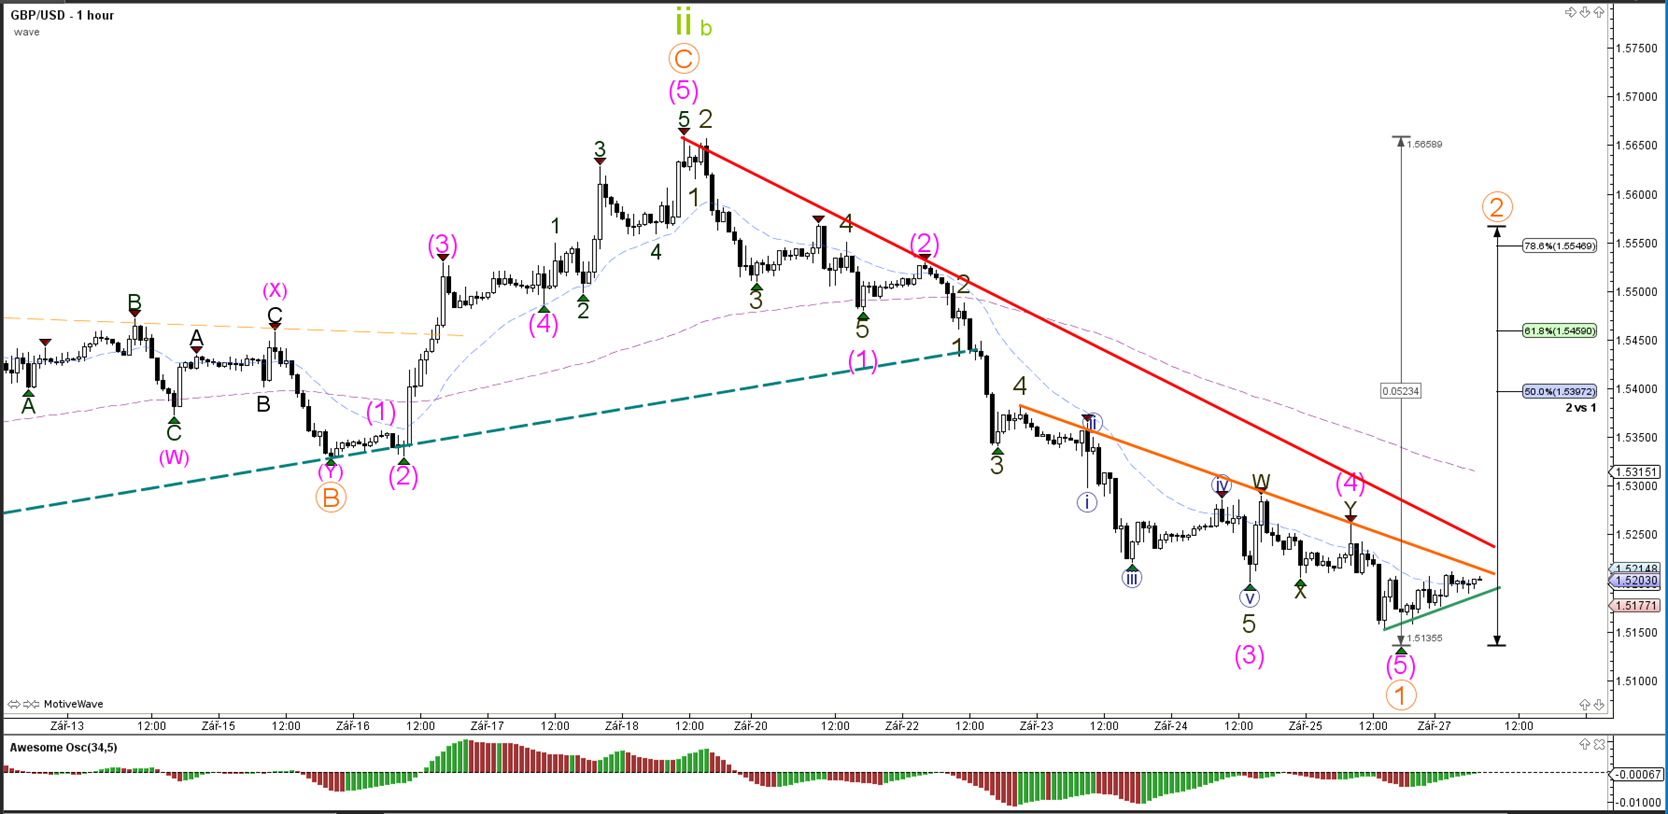
1 hour

Within wave 5 (pink) price could be expanding the waves within an internal 123 (dark green). The alternative scenario shows a wave 5 (pink) completed at the recent top, which is more likely when the trend line breaks.
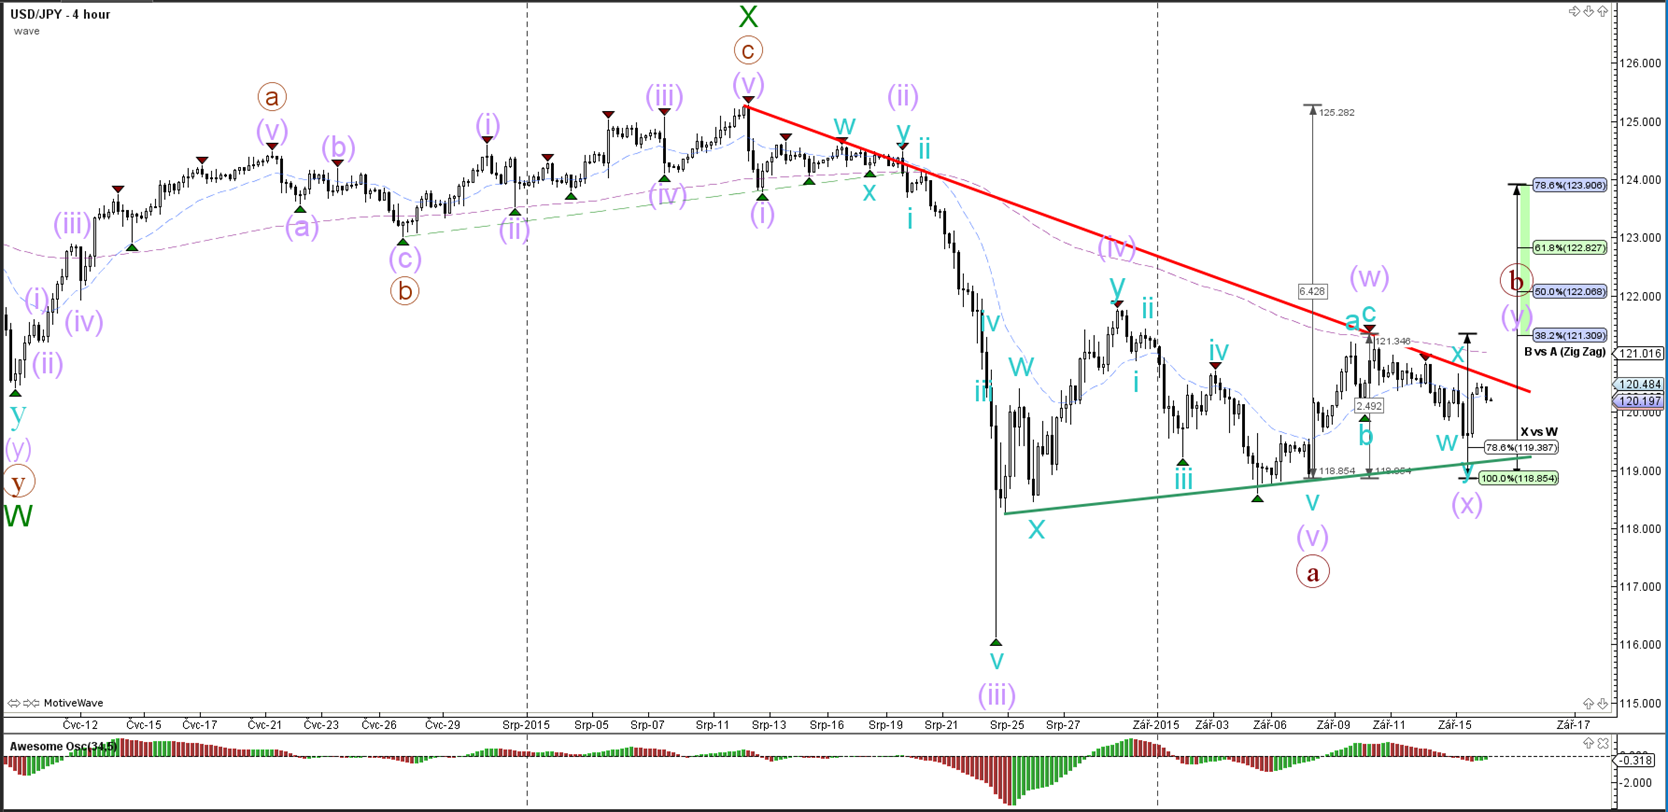
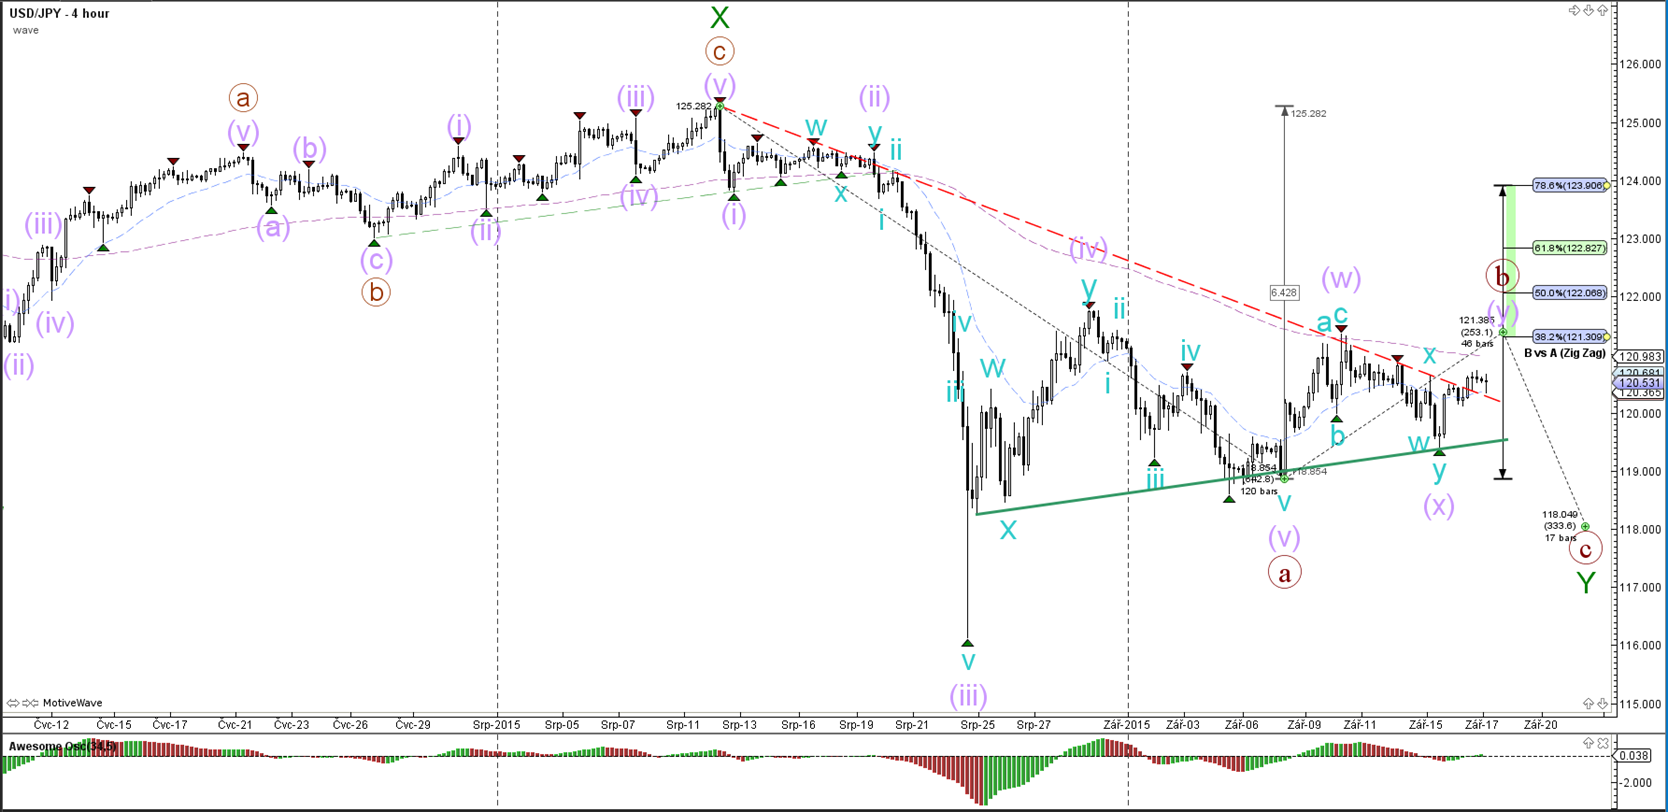
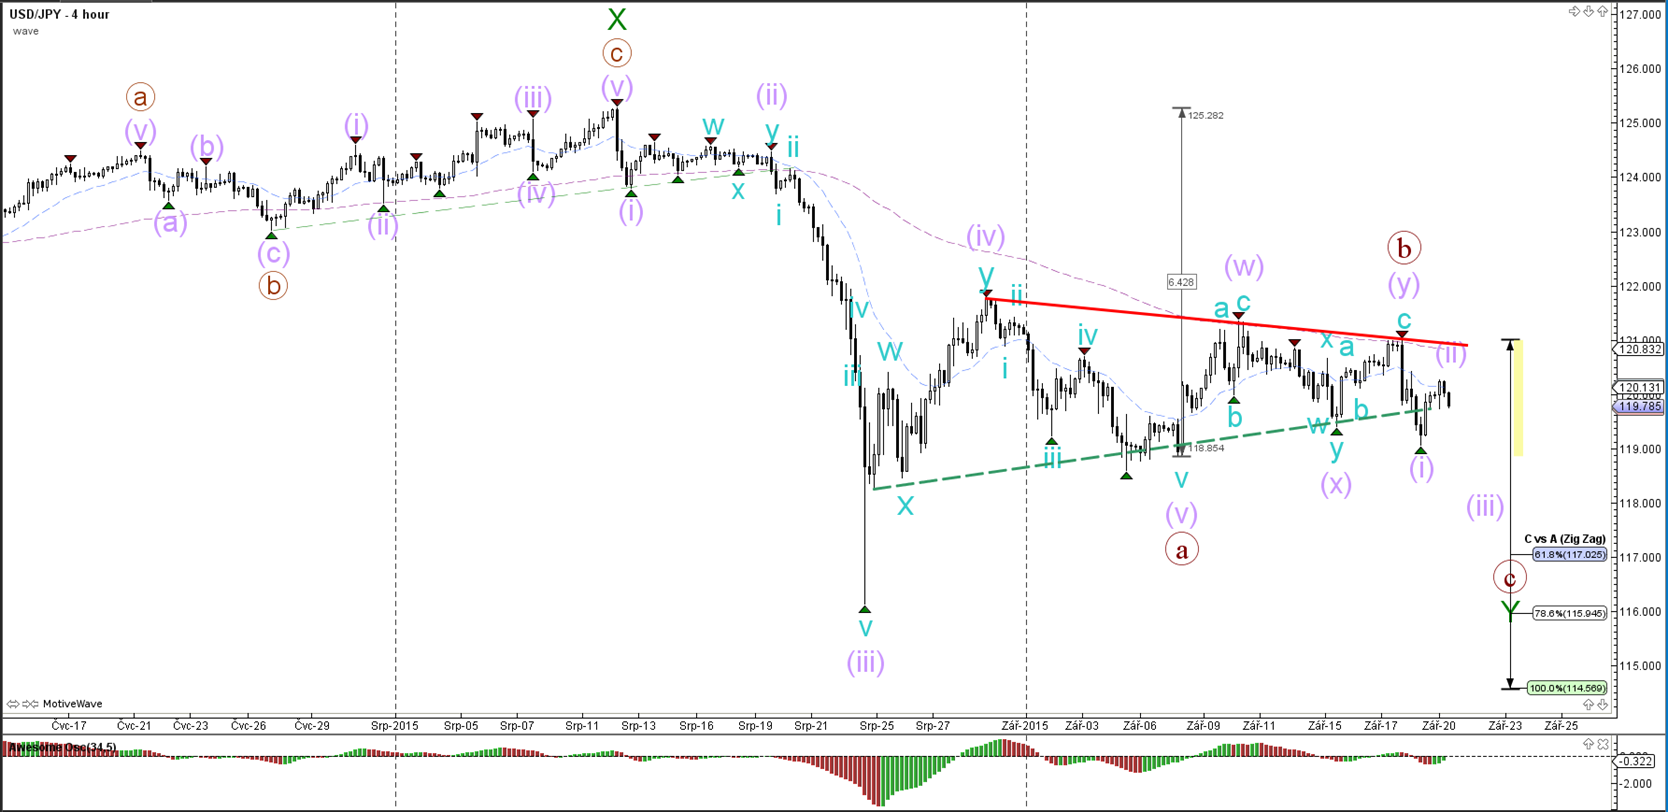
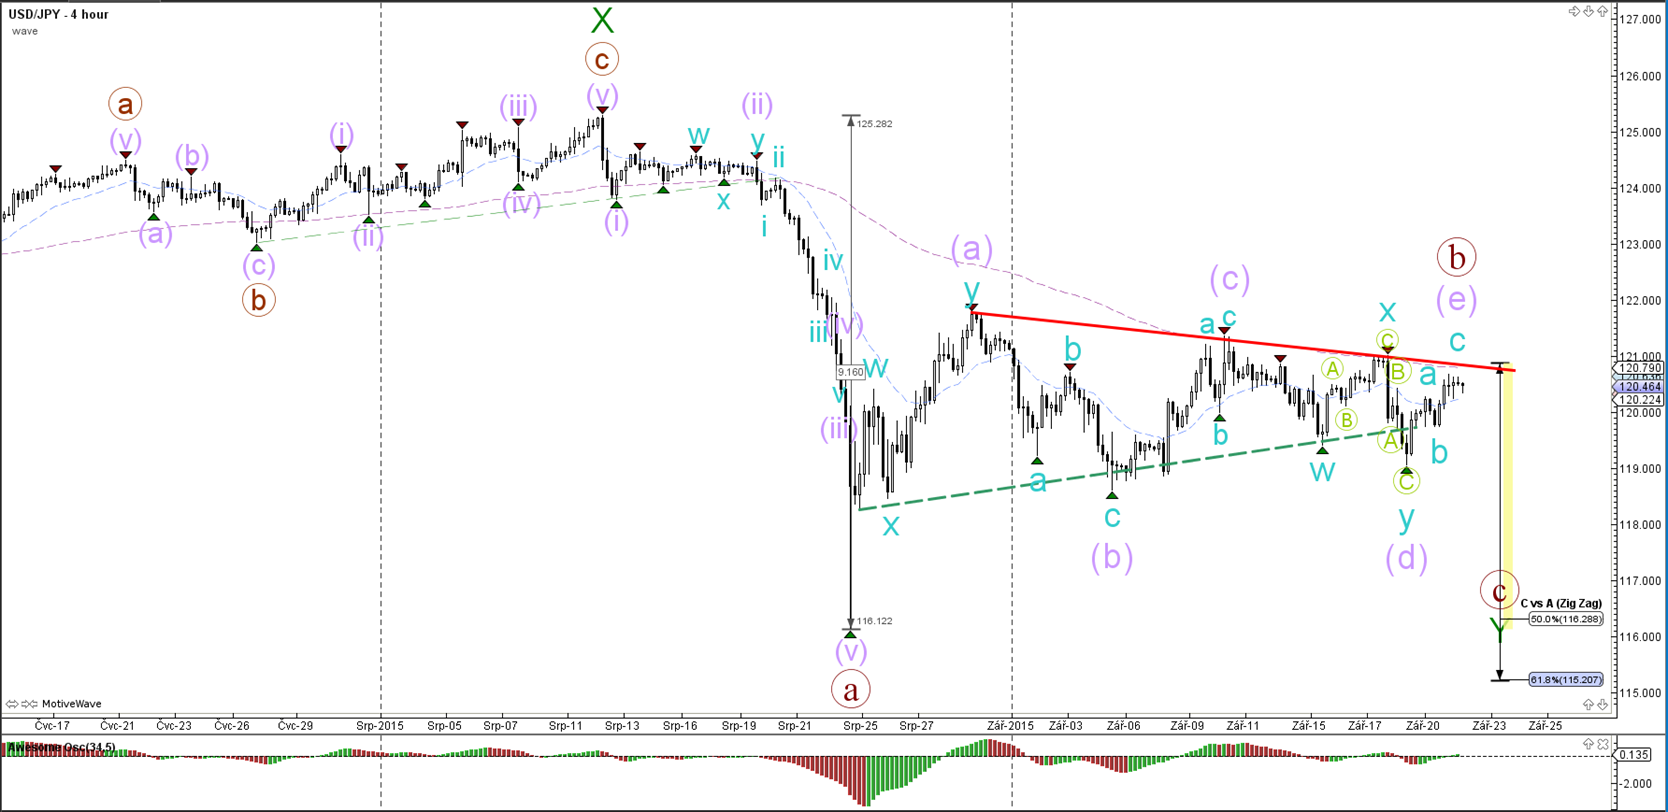
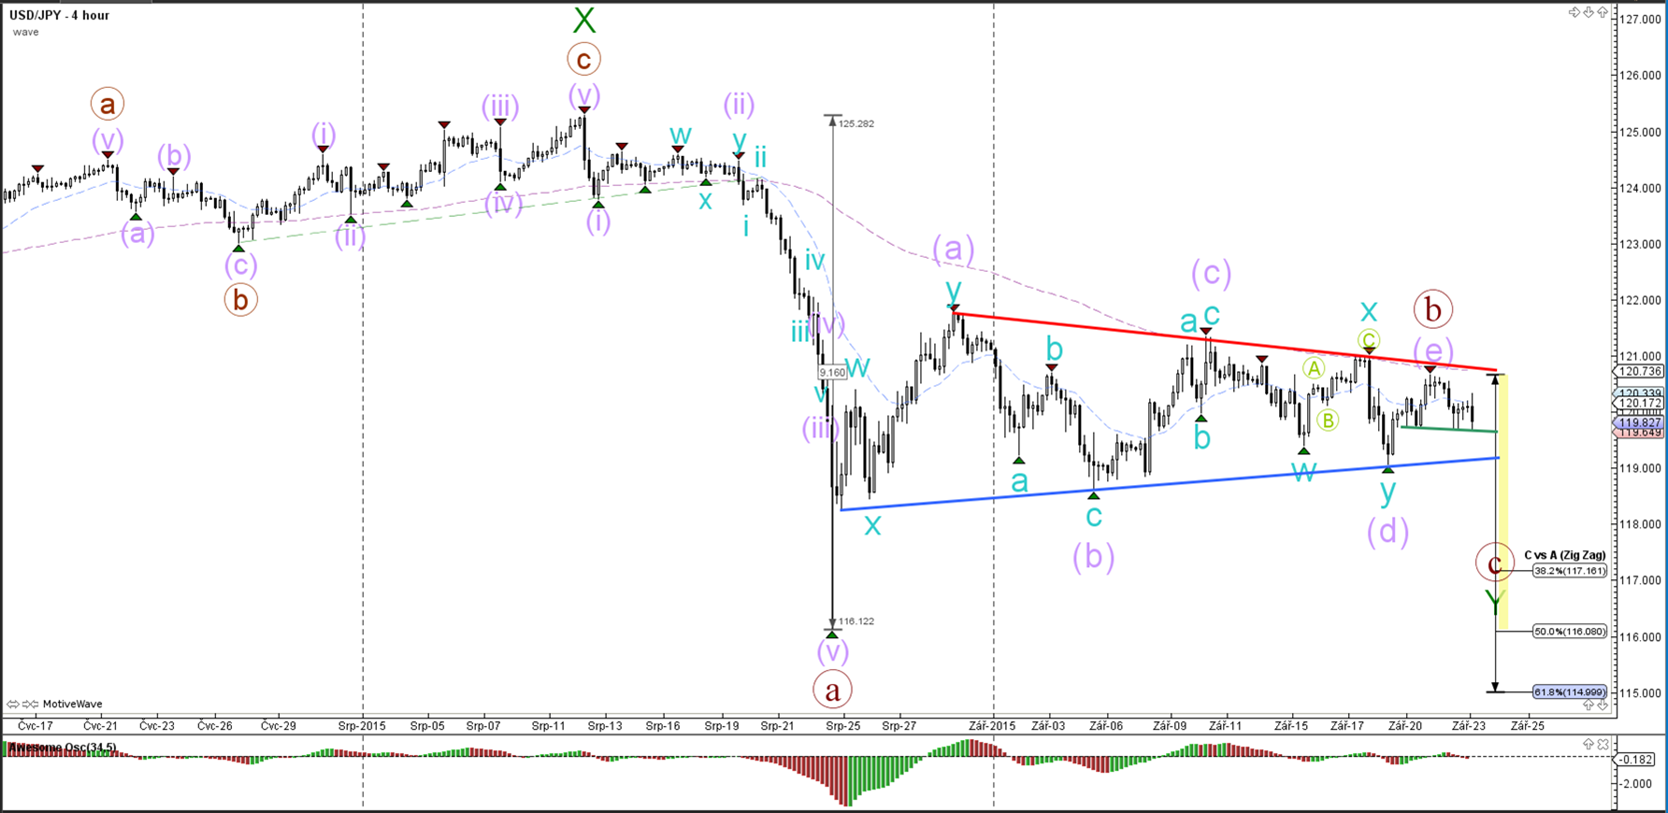
USD/JPY
4 hour
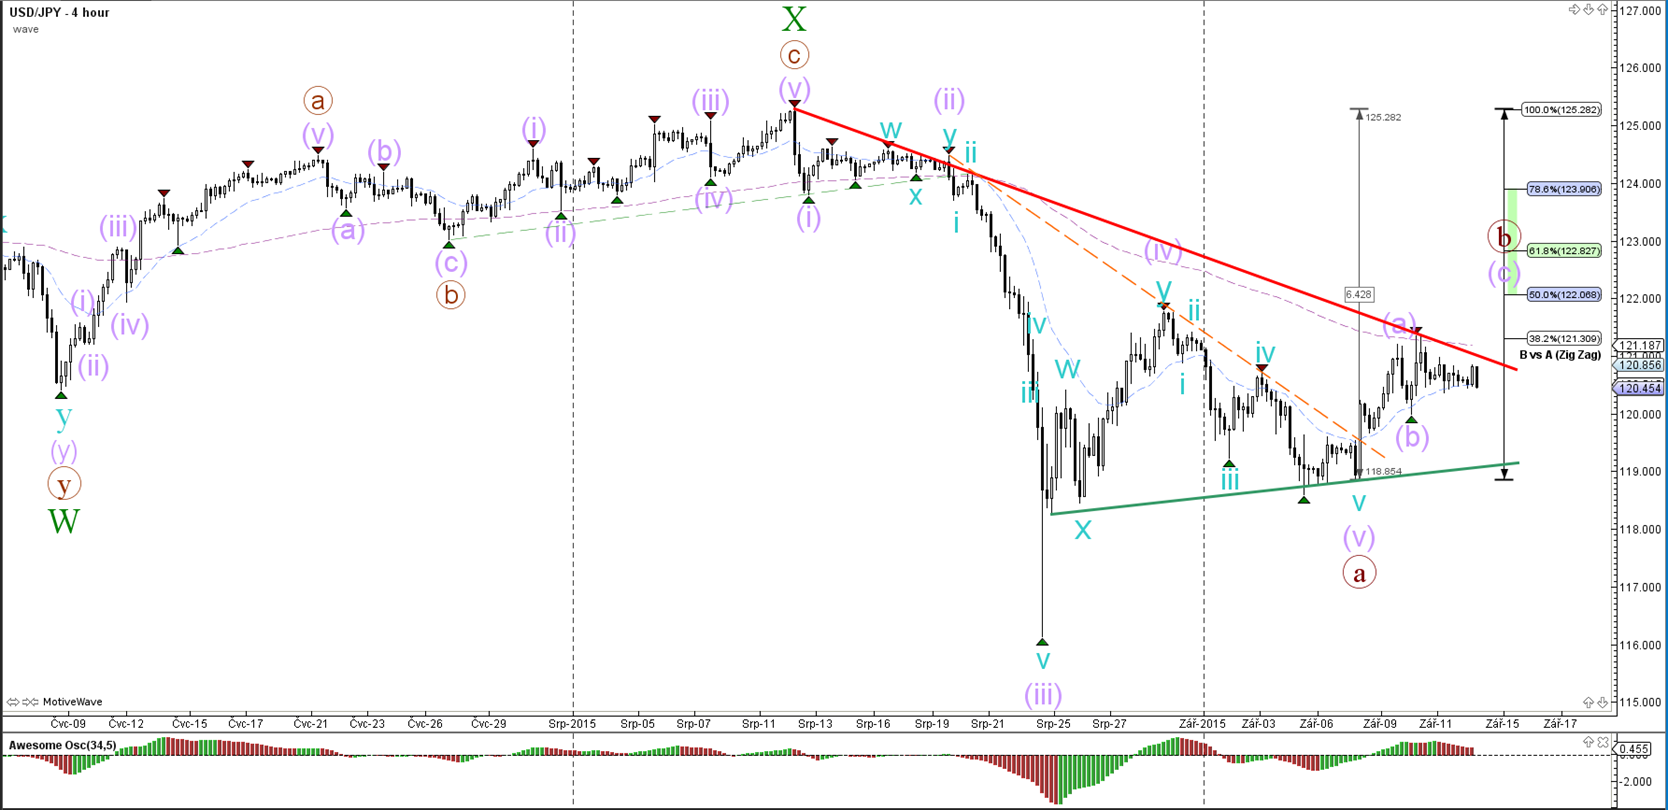
The USD/JPY is in a triangle and a bullish break could see price retrace deeper versus the Fibonacci retracement levels. Currently price has stopped at the 38.2% Fib level. A bearish break could indicate the likelihood of wave B (brown) being completed.
“Original analysis is provided by Admiral Markets”
EUR/USD
4 hour

The EUR/USD is most likely expanding the wave 2 correction (green) via a WXY (purple) within wave Y (brown).
1 hour

The EUR/USD pushed up once more on Friday which is probably a wave 5 (green) within the ABC zigzag (blue). Whether the wave 5 is completed or not remains to be seen. A bearish break below the channel (green/orange) could indicate the start of wave X (purple).
GBP/USD
4 hour

The GBPUSD is most likely expanding the wave 5 (pink) but a break below the support trend line (green) could indicate the completion of that wave 5 and wave A (orange).
1 hour

Within wave 5 (pink) price could be expanding the waves within an internal 123 (dark green). The alternative scenario shows a wave 5 (pink) completed at the recent top, which is more likely when the trend line breaks.
USD/JPY
4 hour

The USD/JPY is in a triangle and a bullish break could see price retrace deeper versus the Fibonacci retracement levels. Currently price has stopped at the 38.2% Fib level. A bearish break could indicate the likelihood of wave B (brown) being completed.
“Original analysis is provided by Admiral Markets”