Elliott Wave Analysis by Admiral Markets

EUR/USD & GBP/USD at Invalidation Levels for Waves 2 & B

EUR/USD

4 hour
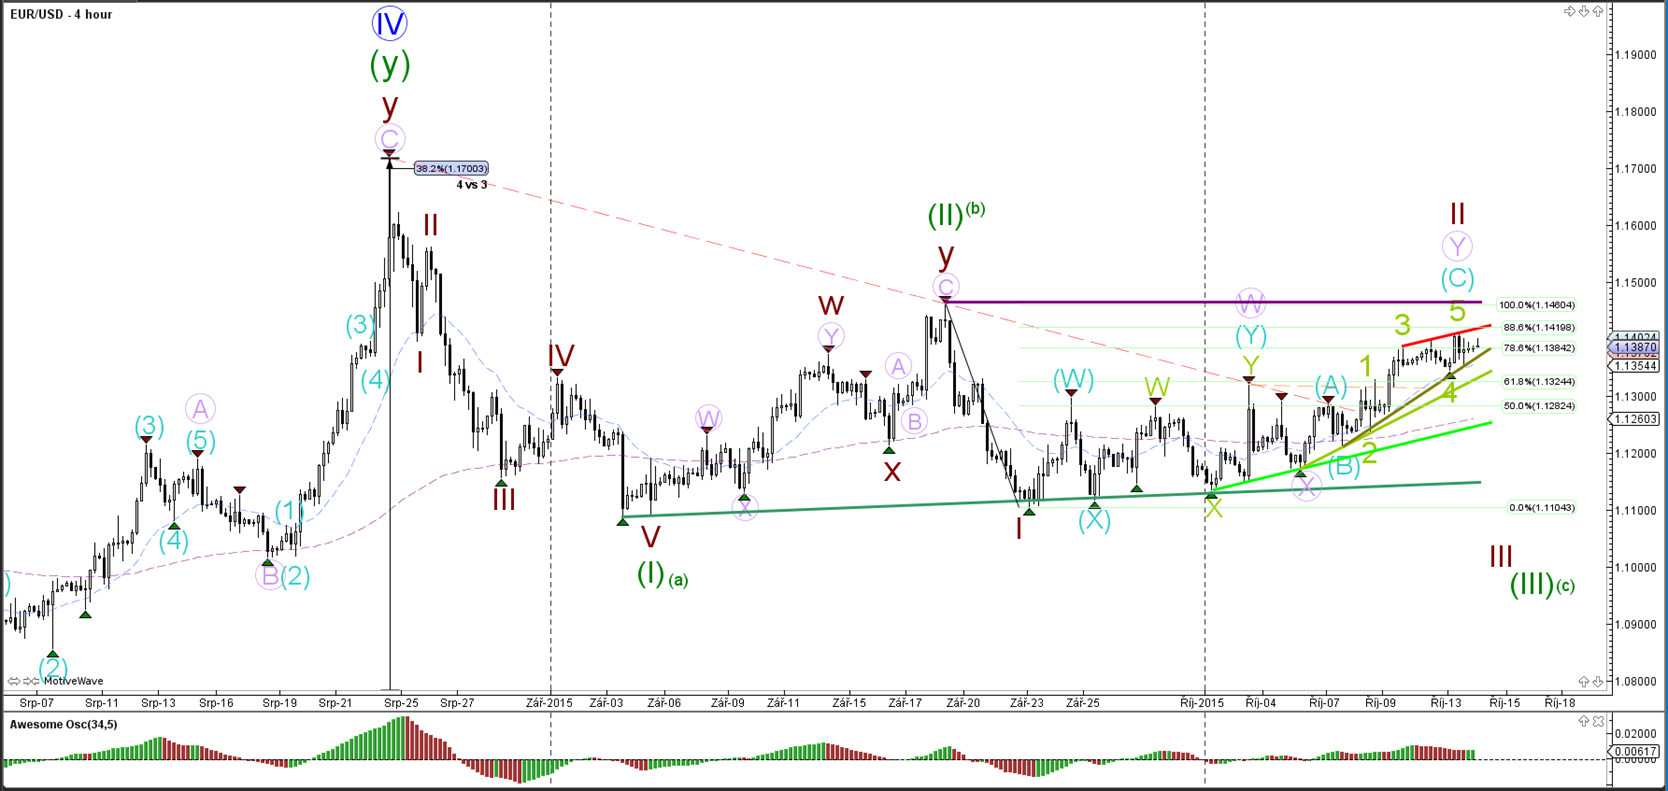


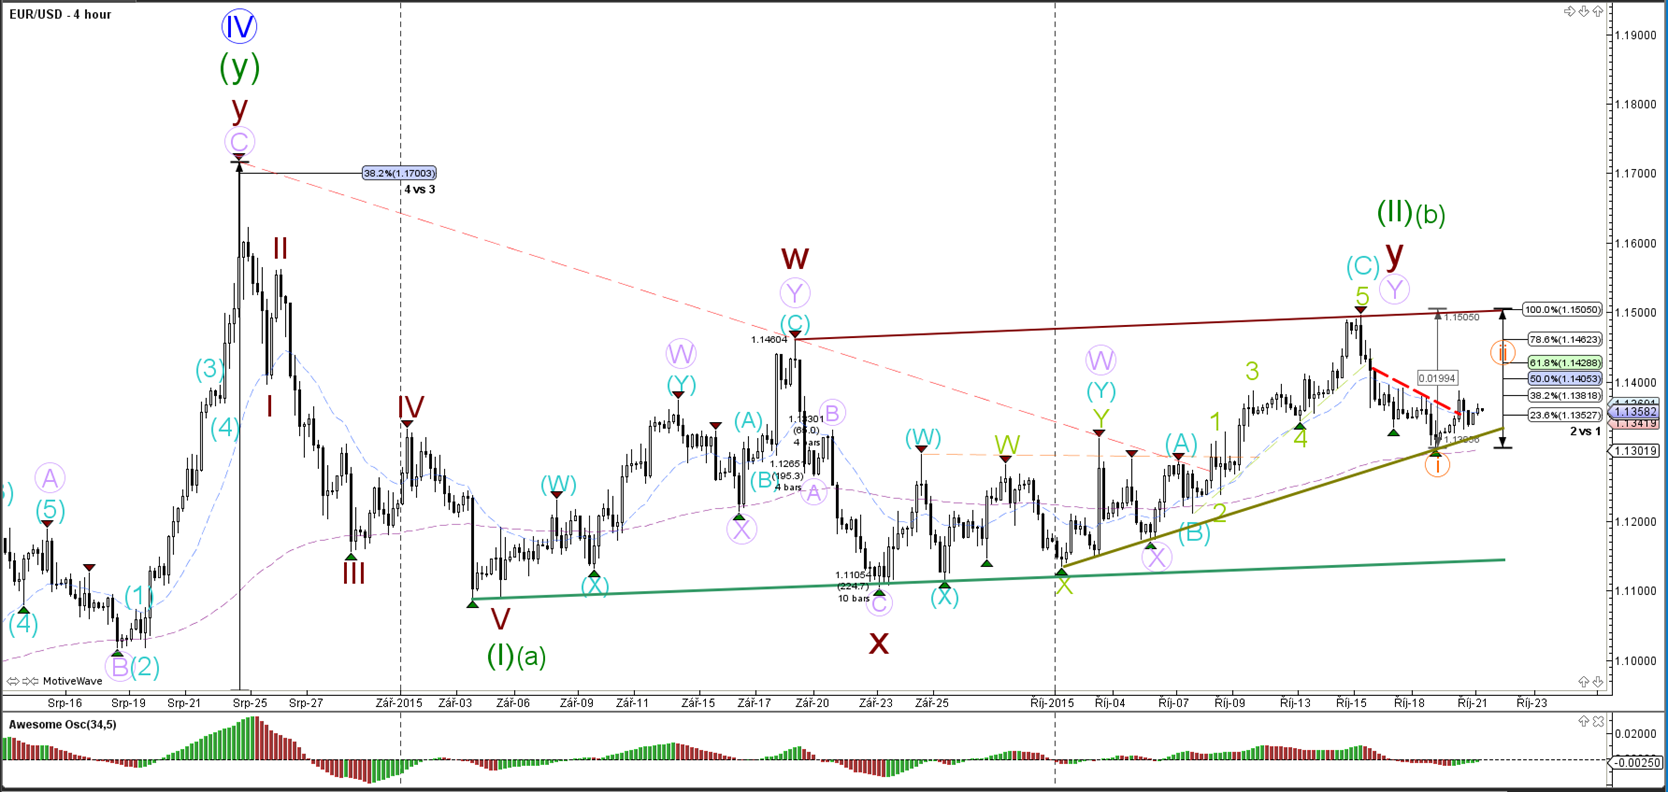
The EUR/USD has shown a deep pullback within the potential wave 2 (brown) up to the 88.6% Fibonacci retracement level. A break above the purple line invalidates the current wave 1-2 (brown) structure.

1 hour
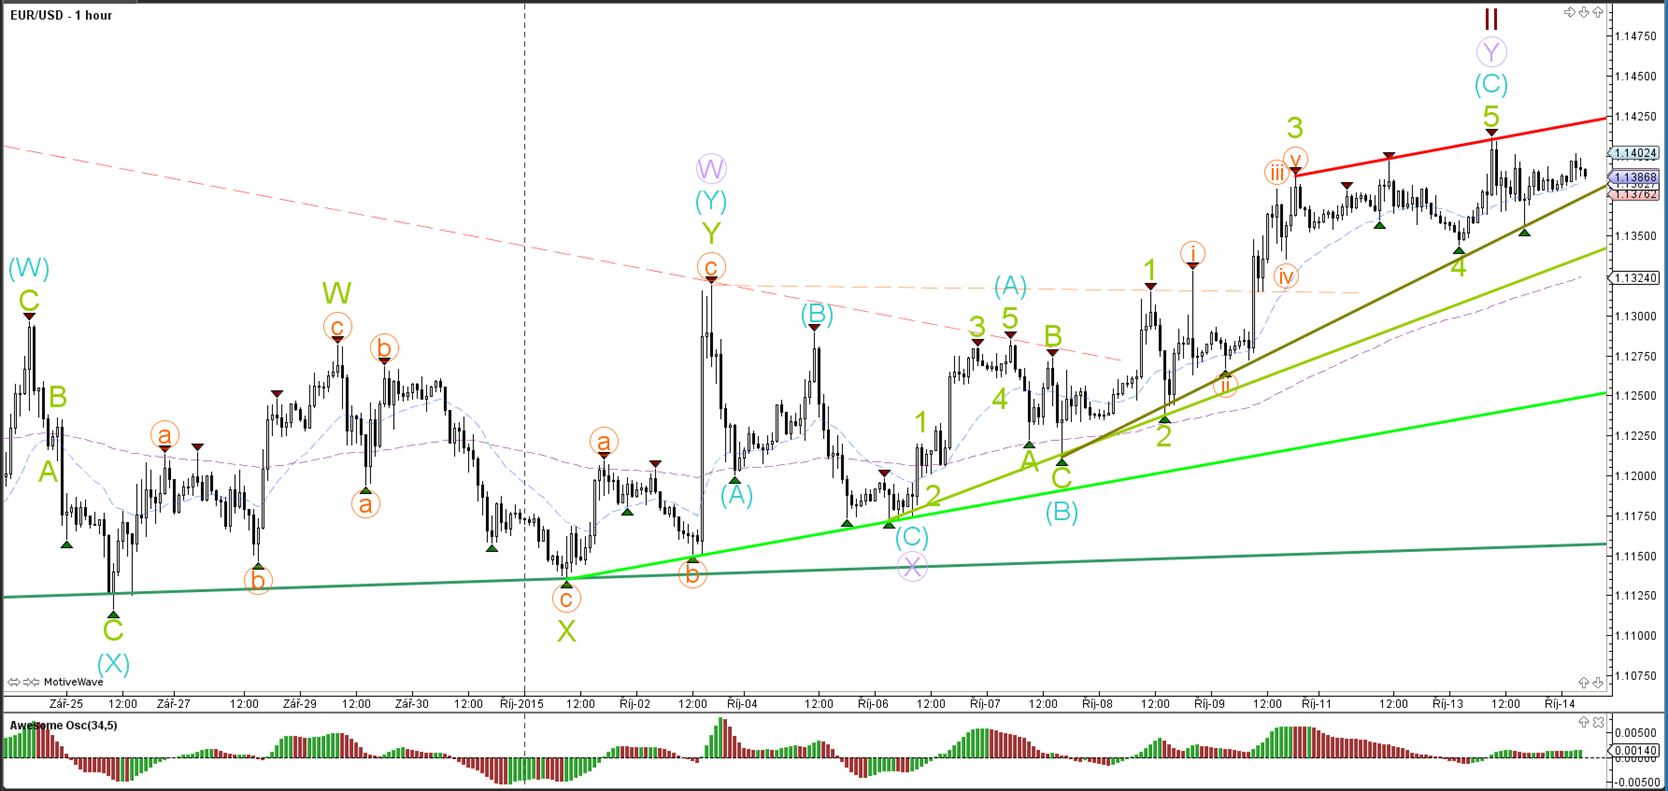


The EUR/USD made one more bullish push yesterday which could be explained by a wave 4 and 5 (green). Currently there is a rising wedge (red/green lines) chart pattern taking place on the 1 hour chart, which is most often a reversal signal. A break of the various support levels confirms the bearish potential, whereas a break above resistance invalidates the wave 2 (brown).

GBP/USD

4 hour
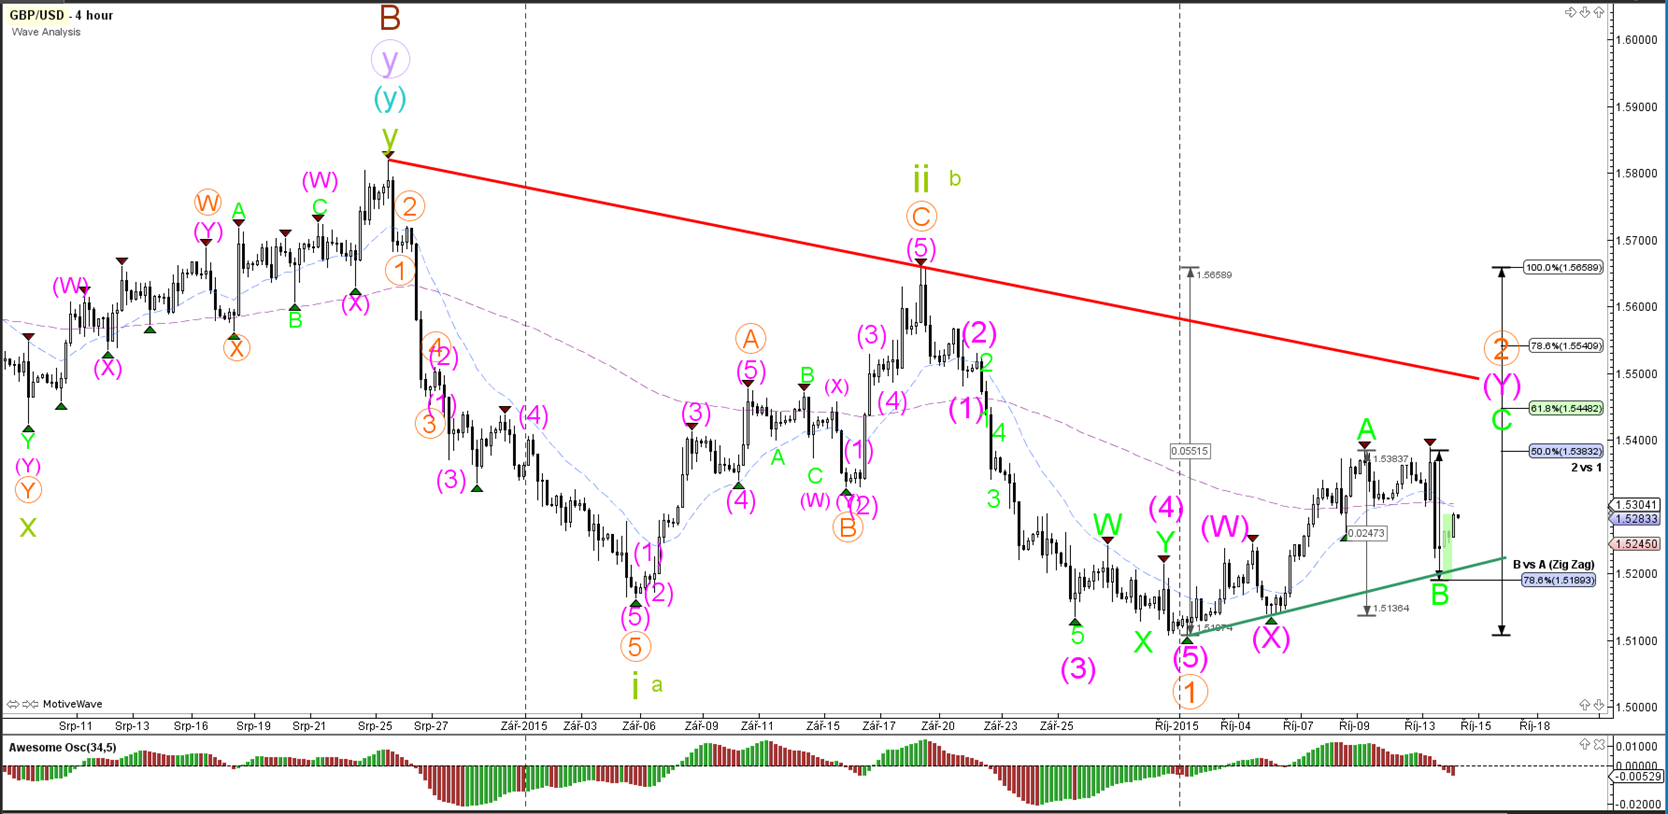


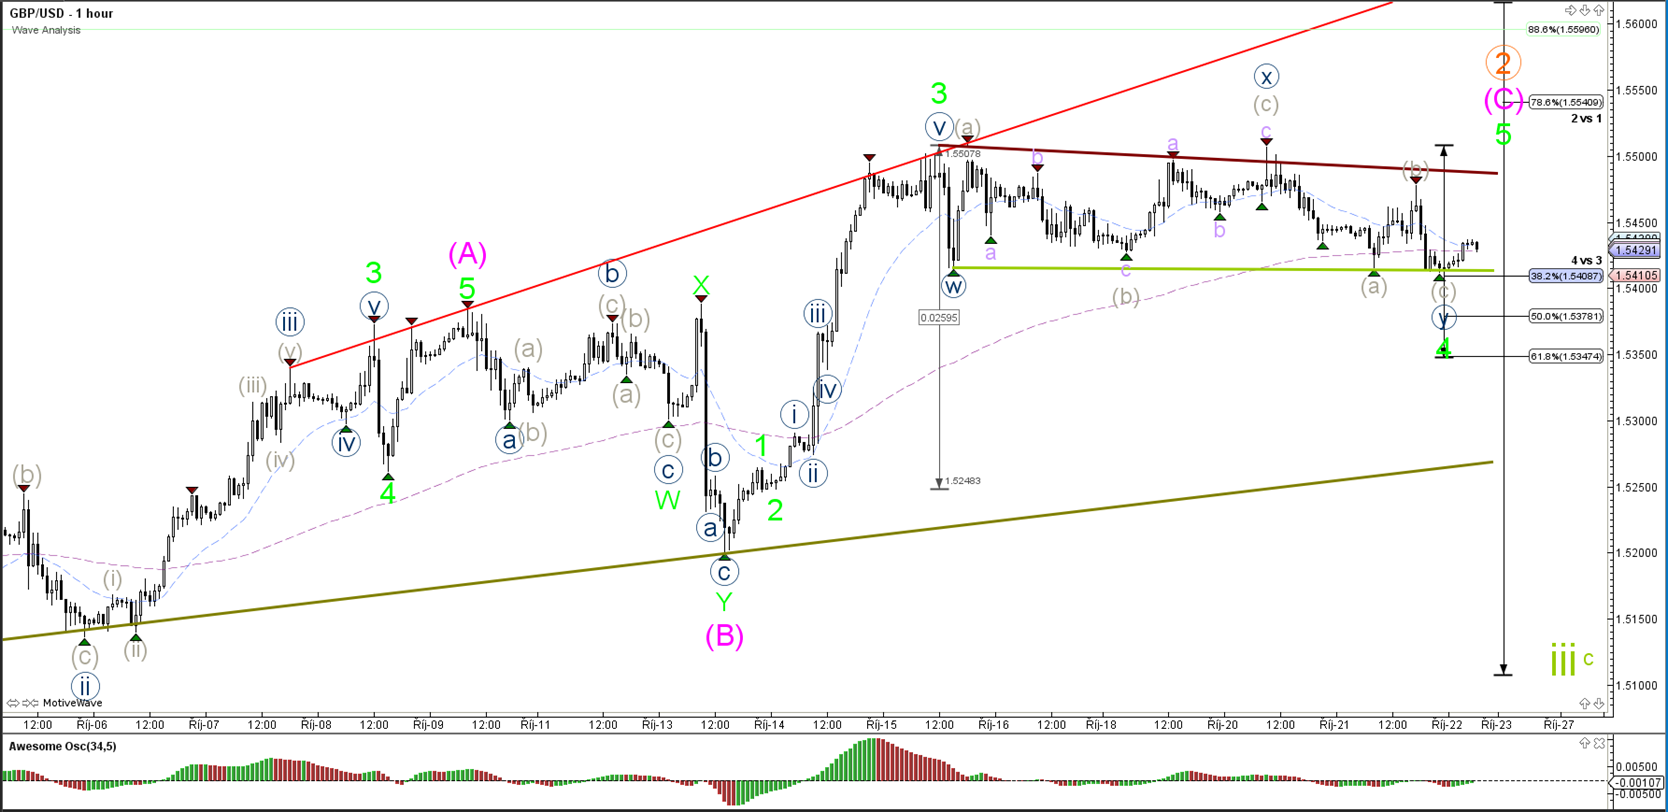
The GBP/USD posted a deep bearish retracement yesterday down to the 78.6% Fibonacci retracement level. A break below the support trend line (green) invalidates the wave B (green) and indicates that wave 2 (orange) has been most likely completed at the recent top (where wave A is now).

1 hour
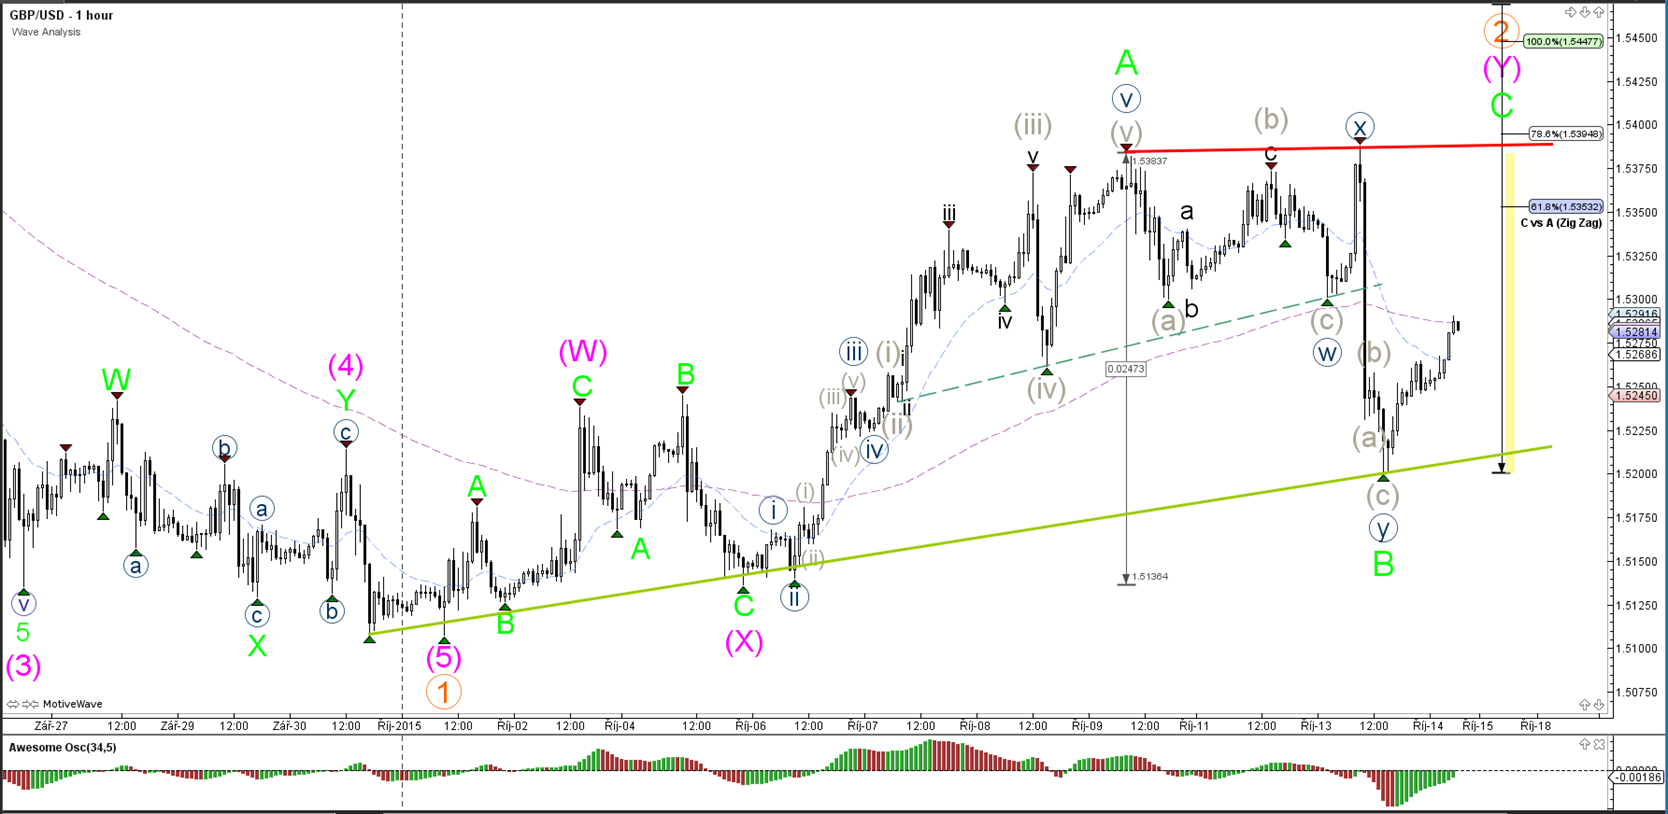


The GBP/USD bounced at support (green) and price could have space up to the 100% Fibonacci target if price manages to break above the 61.8% Fibonacci target and then top (red).

USD/JPY

4 hour
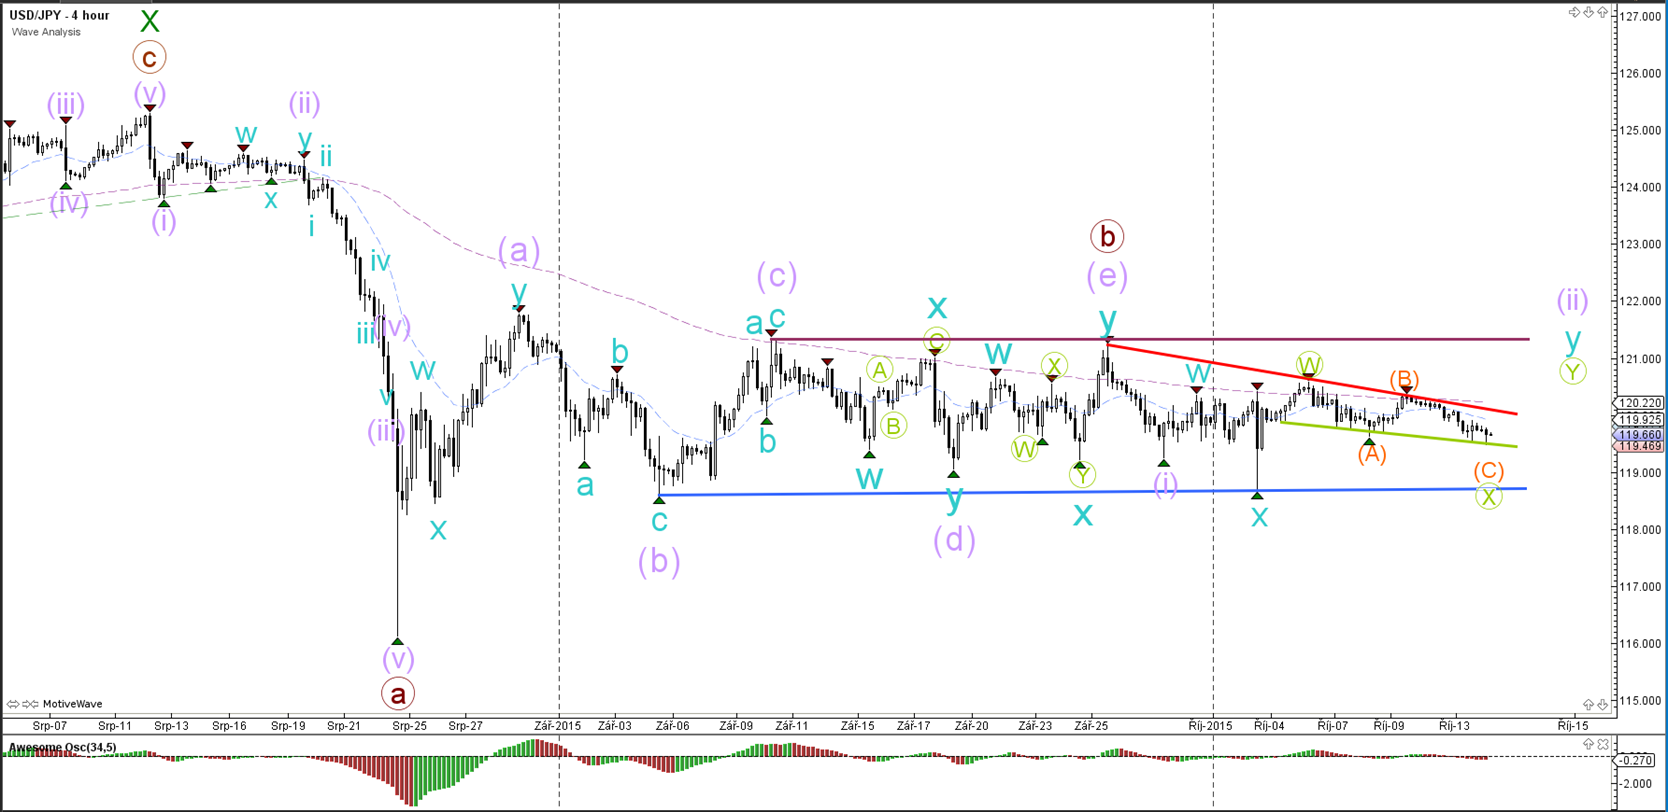


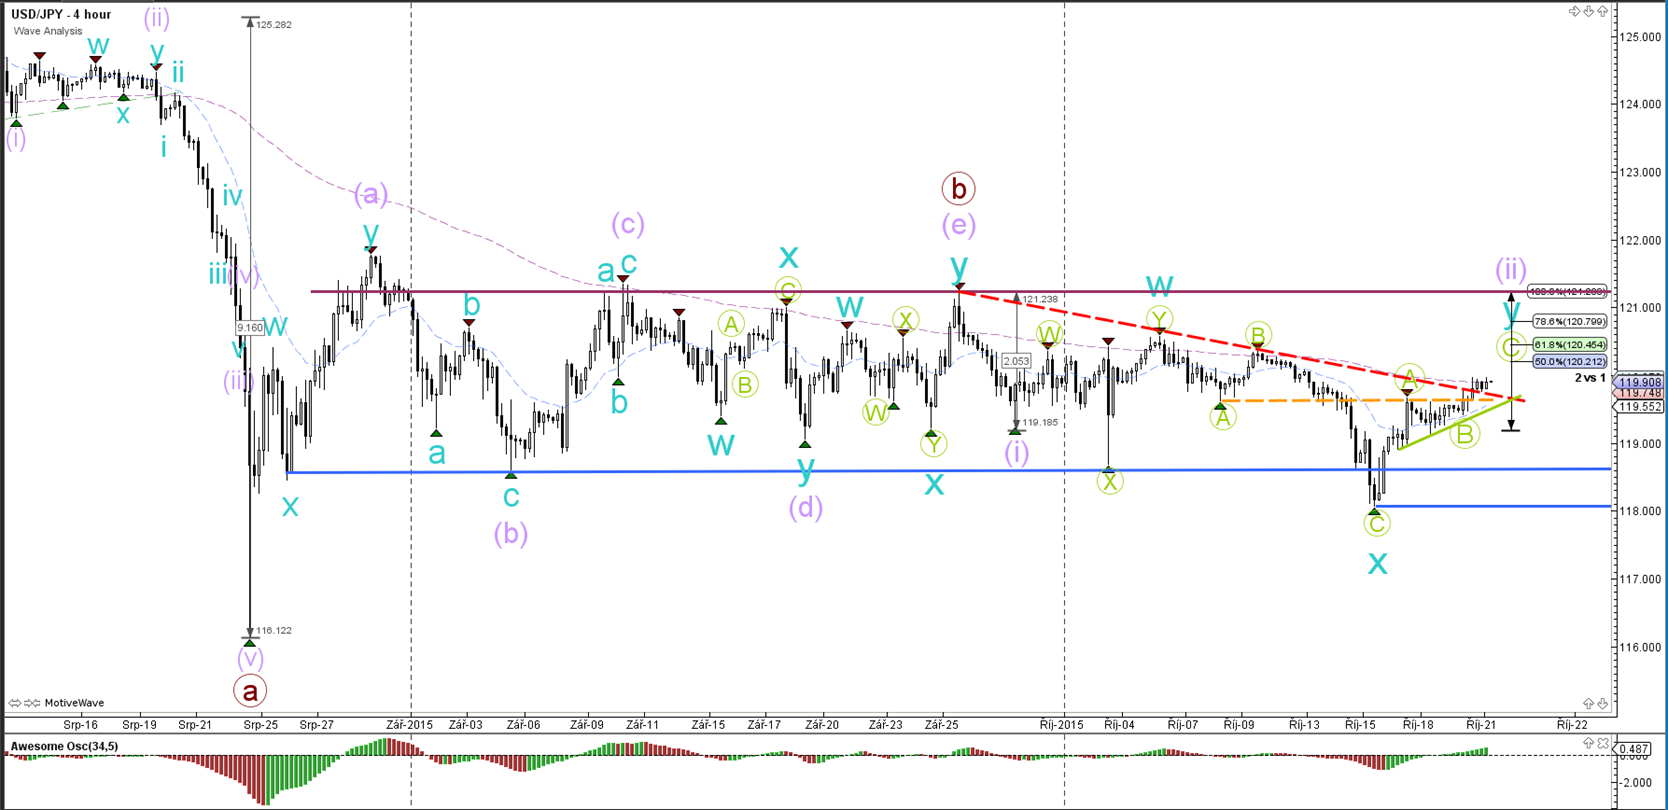
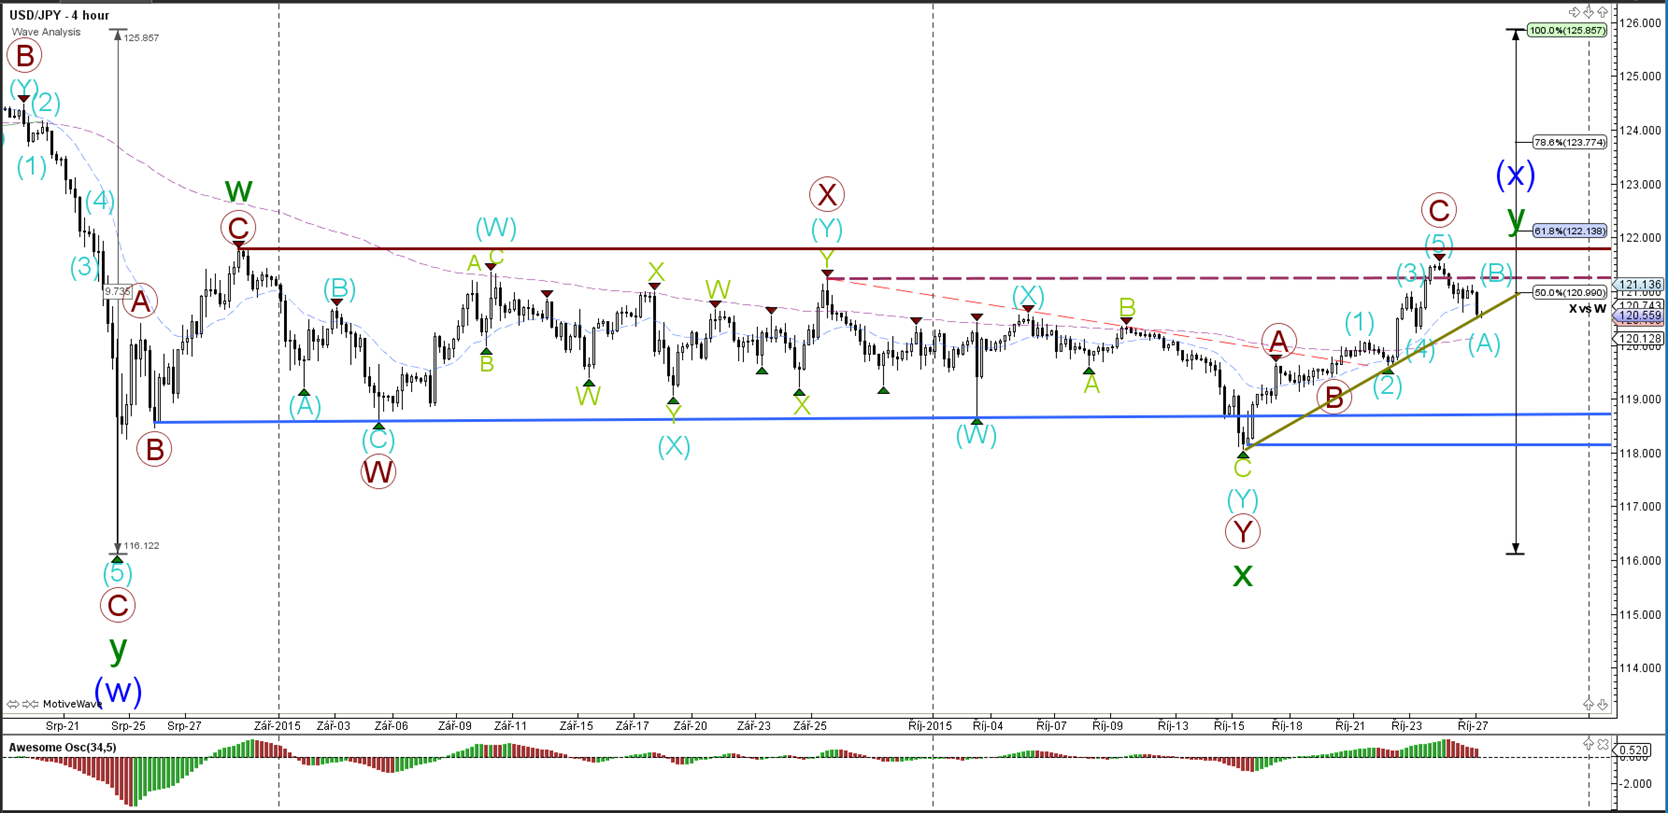
The USD/JPY remains very choppy and price action has significantly slowed down.


“Original analysis is provided by Admiral Markets
 
EURUSD’s Break of Resistance & GU’s Sturdy Momentum

EUR/USD

4 hour


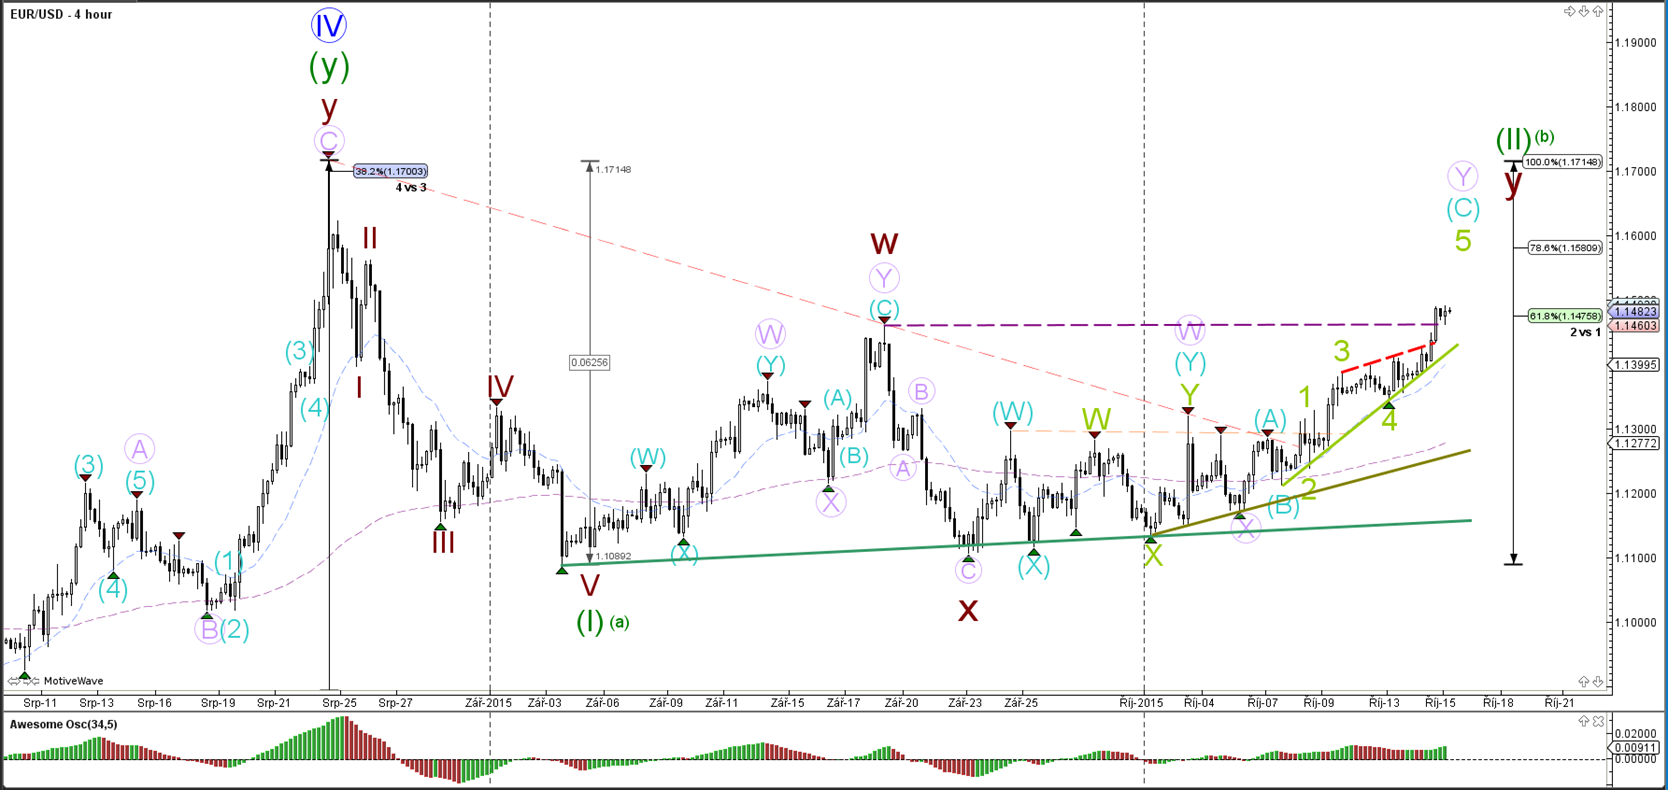
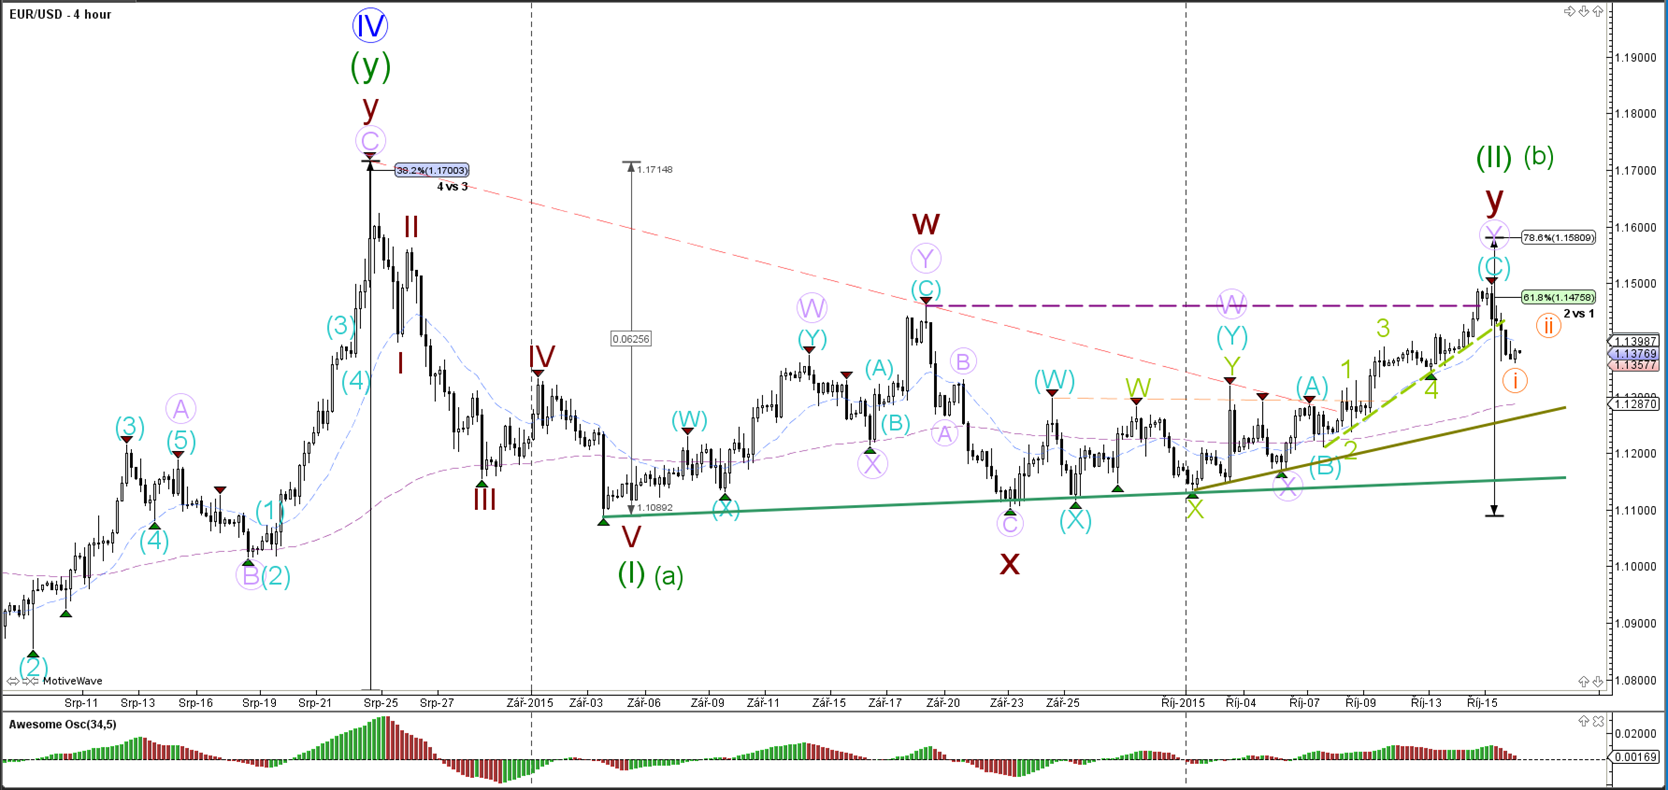
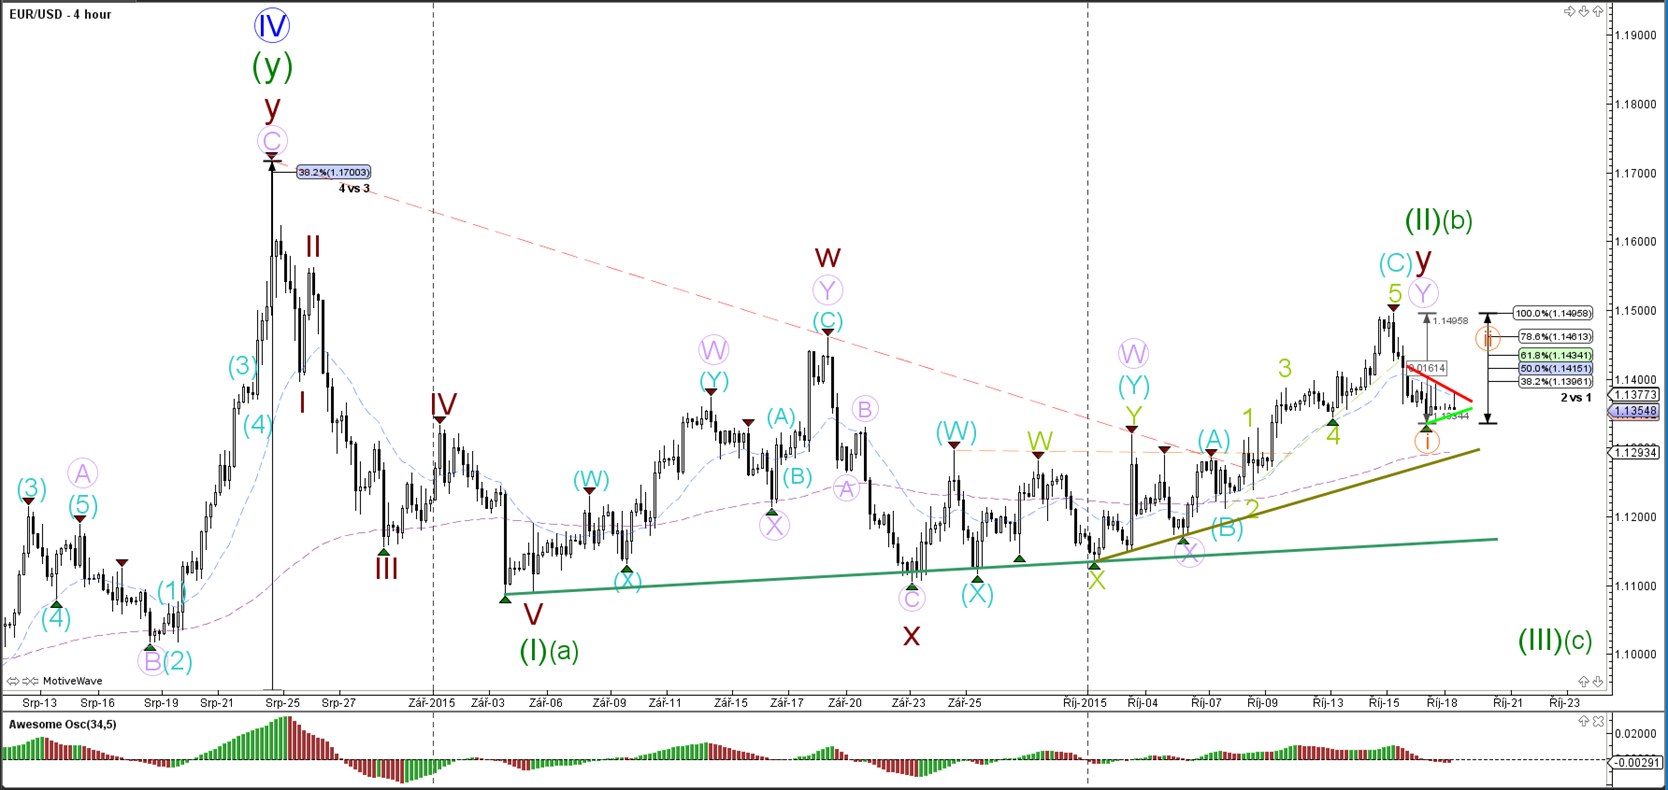
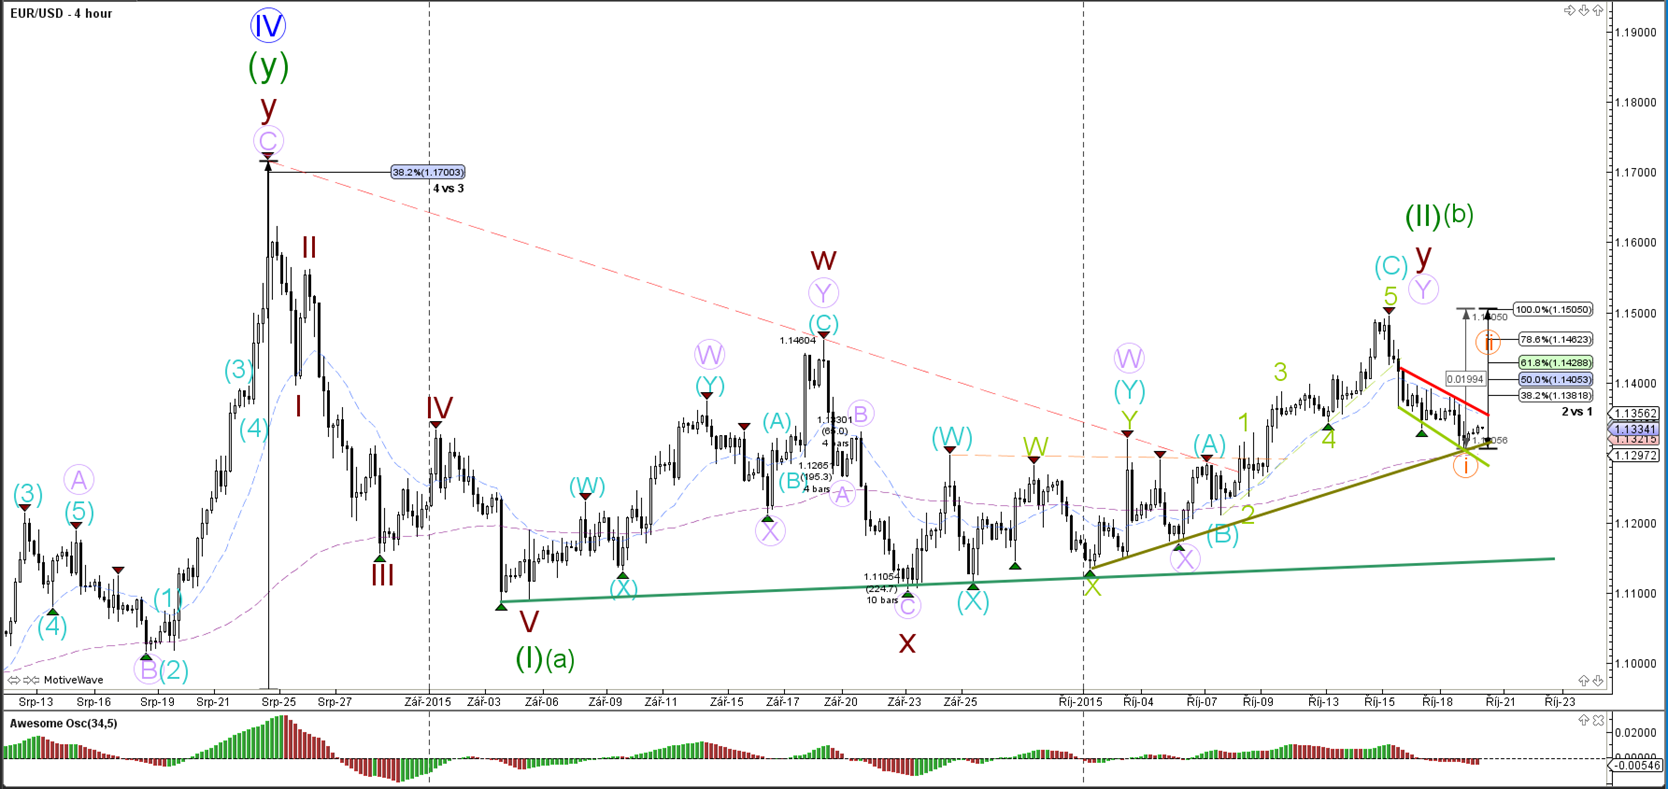
The EUR/USD has broken through the resistance top (dotted purple) and thereby invalided the wave count which therefore necessitates a change in the wave structure. Price has been marked as a wave 5 (green) within a bigger C (blue) correction within waves Y of wave 2 or B (green) for the moment. This wave count changes once price breaks above the 100% level or the October monthly candle fails to push below the support trend lines.

1 hour


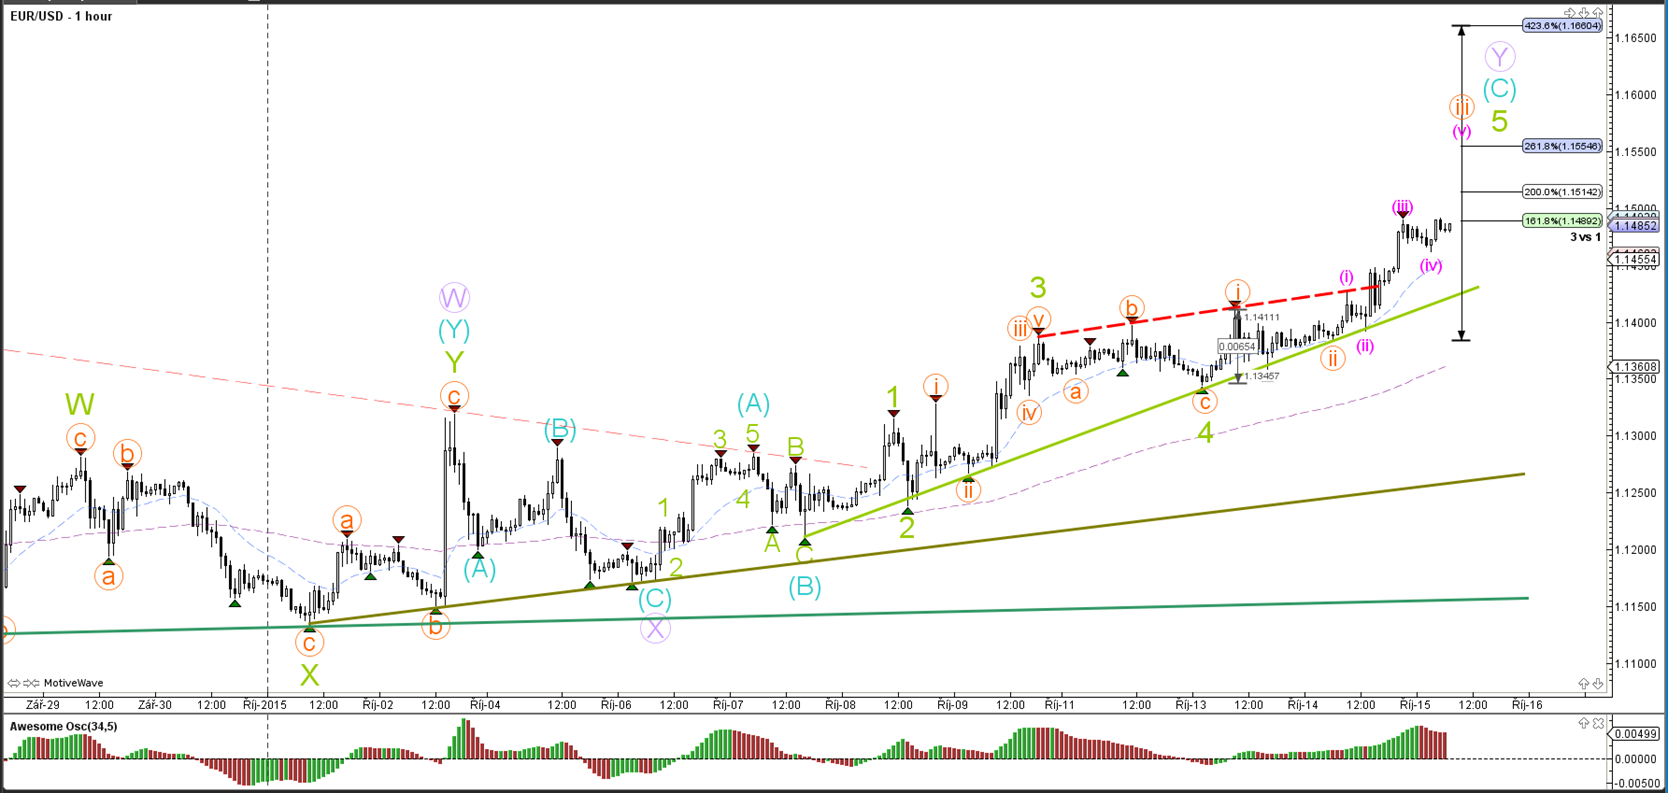
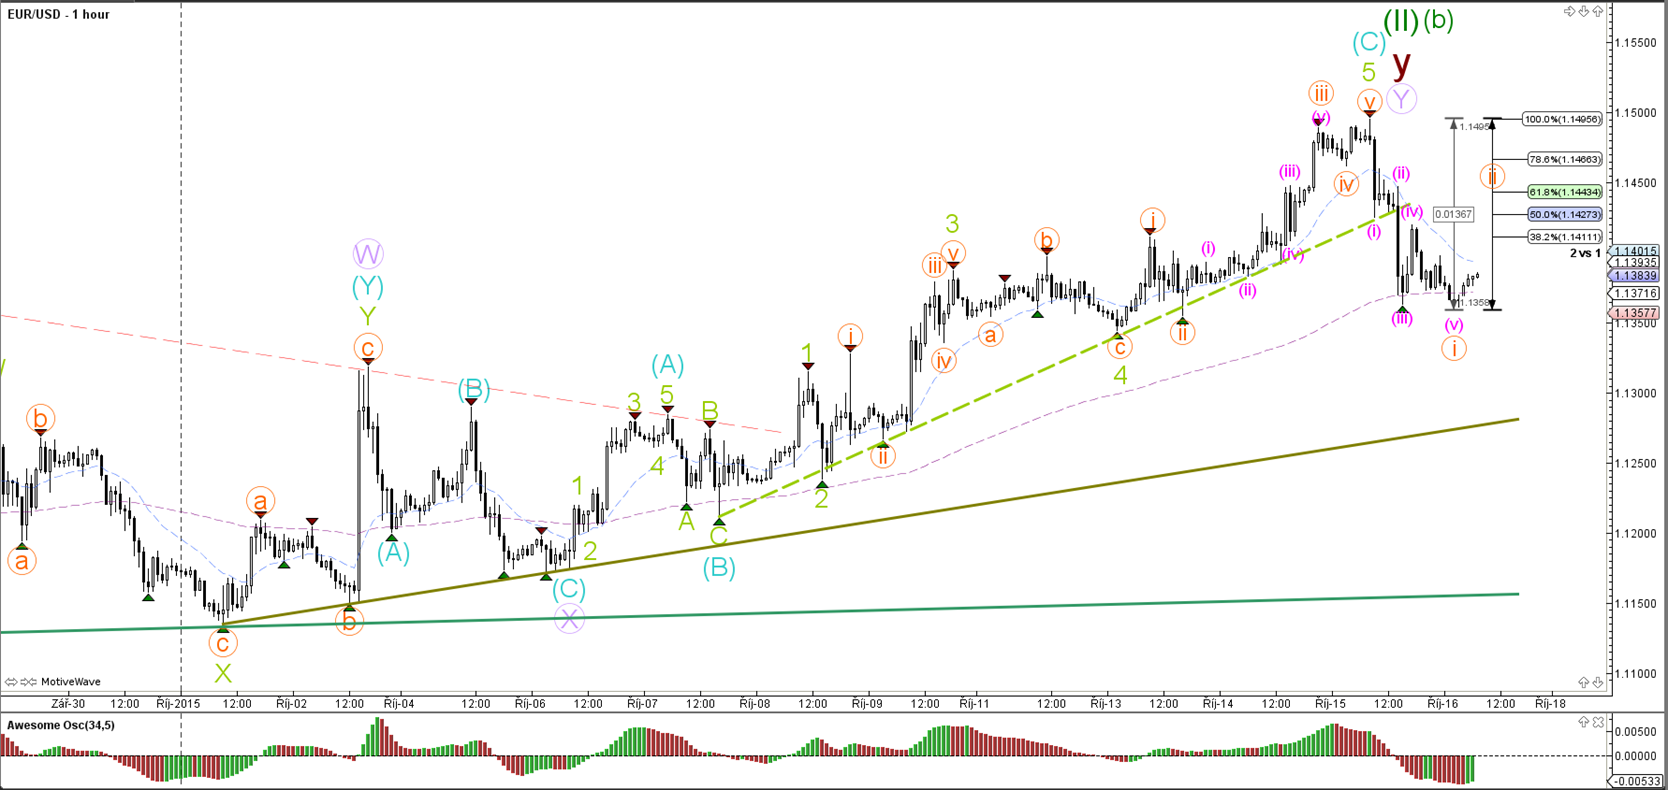
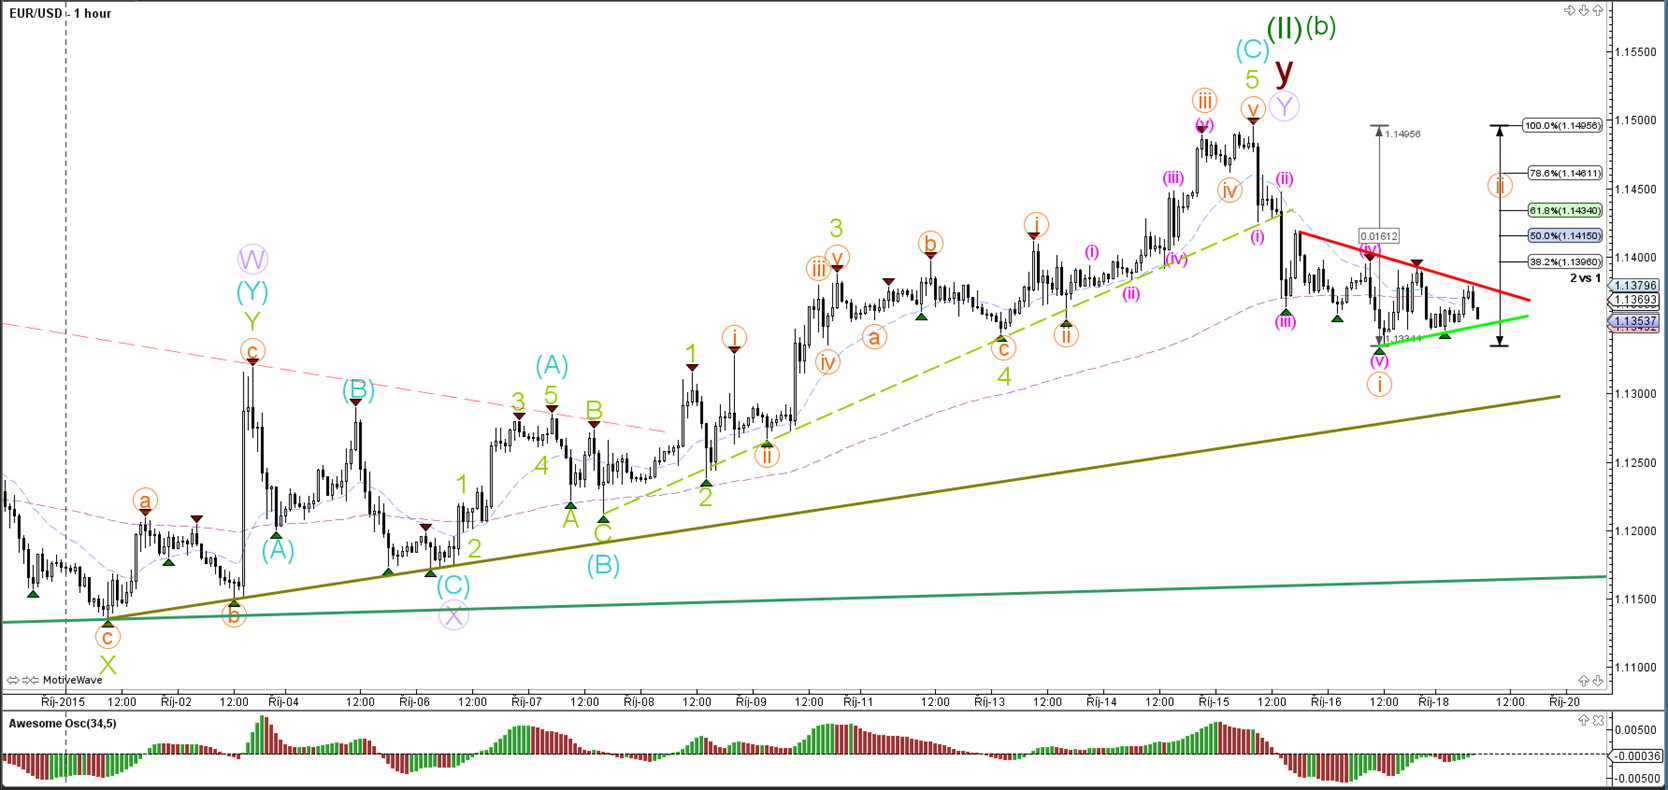
The EUR/USD broke the rising wedge formation (dotted red) and accelerated to the upside with an extended wave 5 (green).

GBP/USD

4 hour


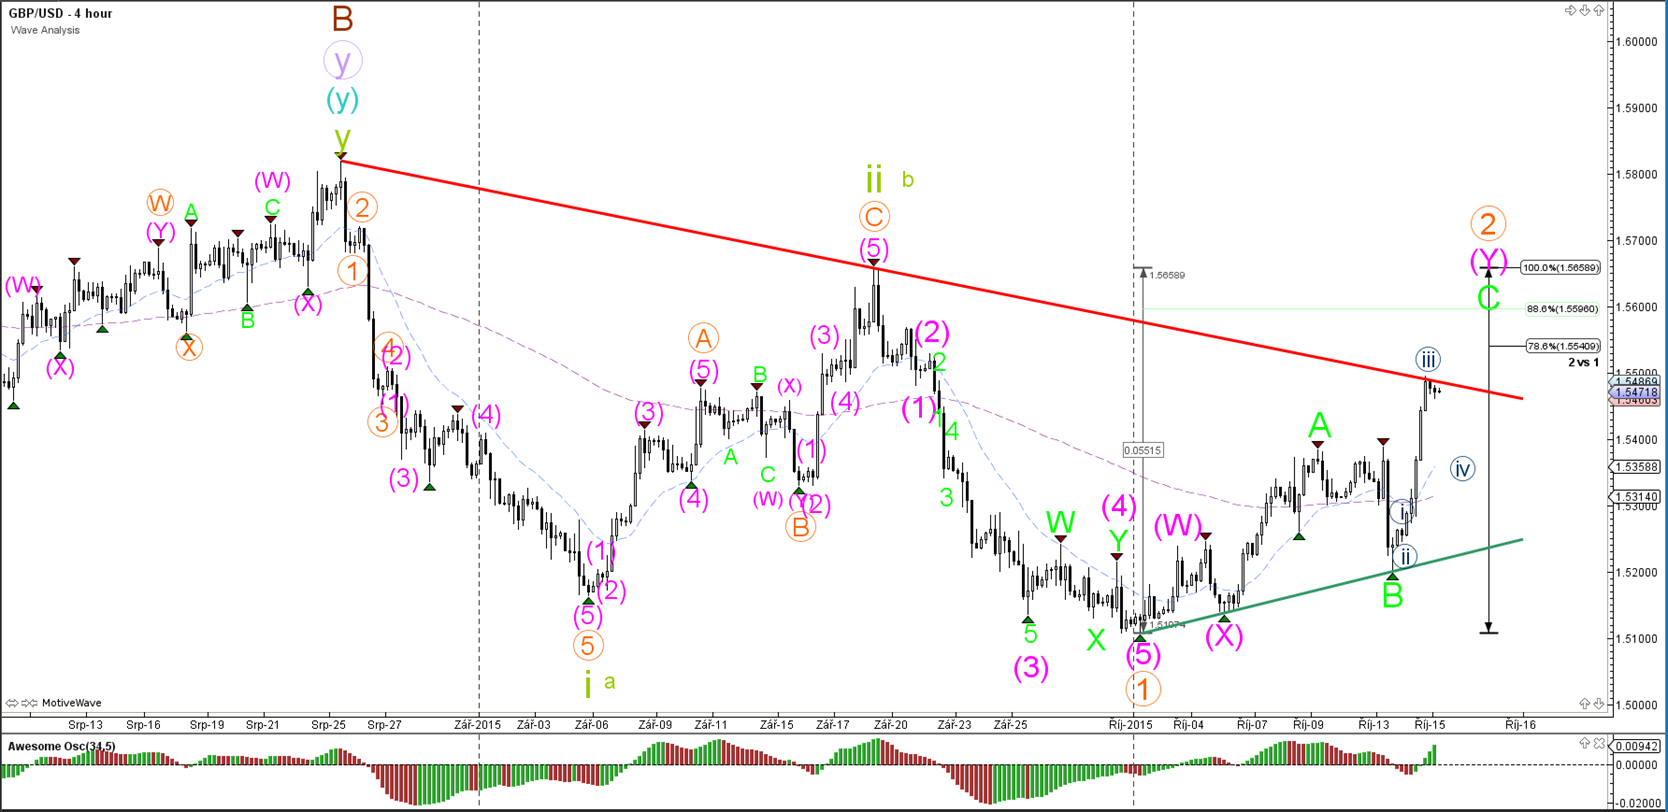
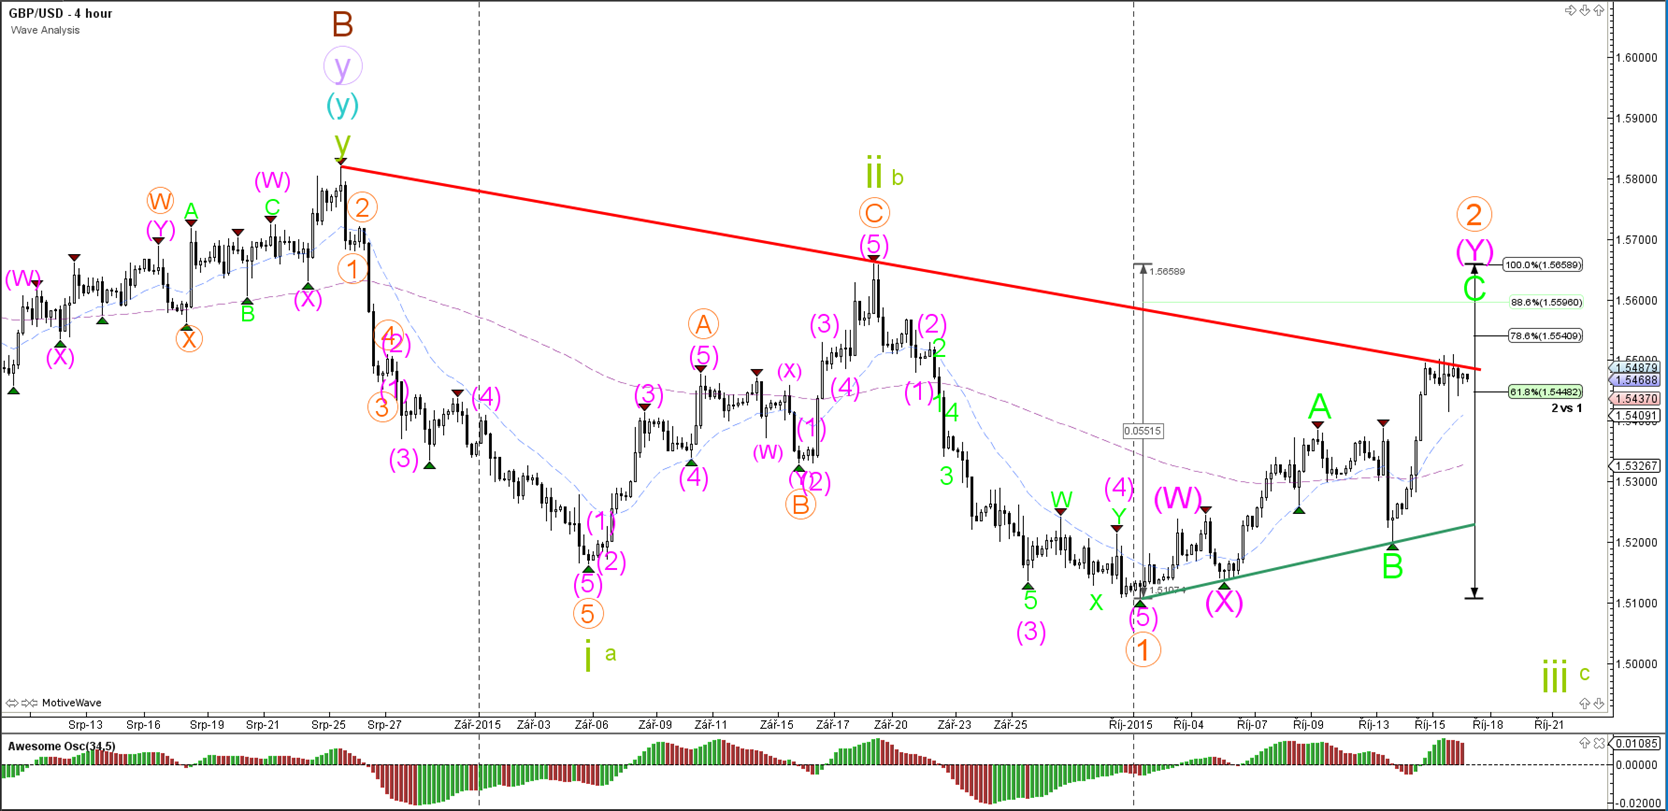
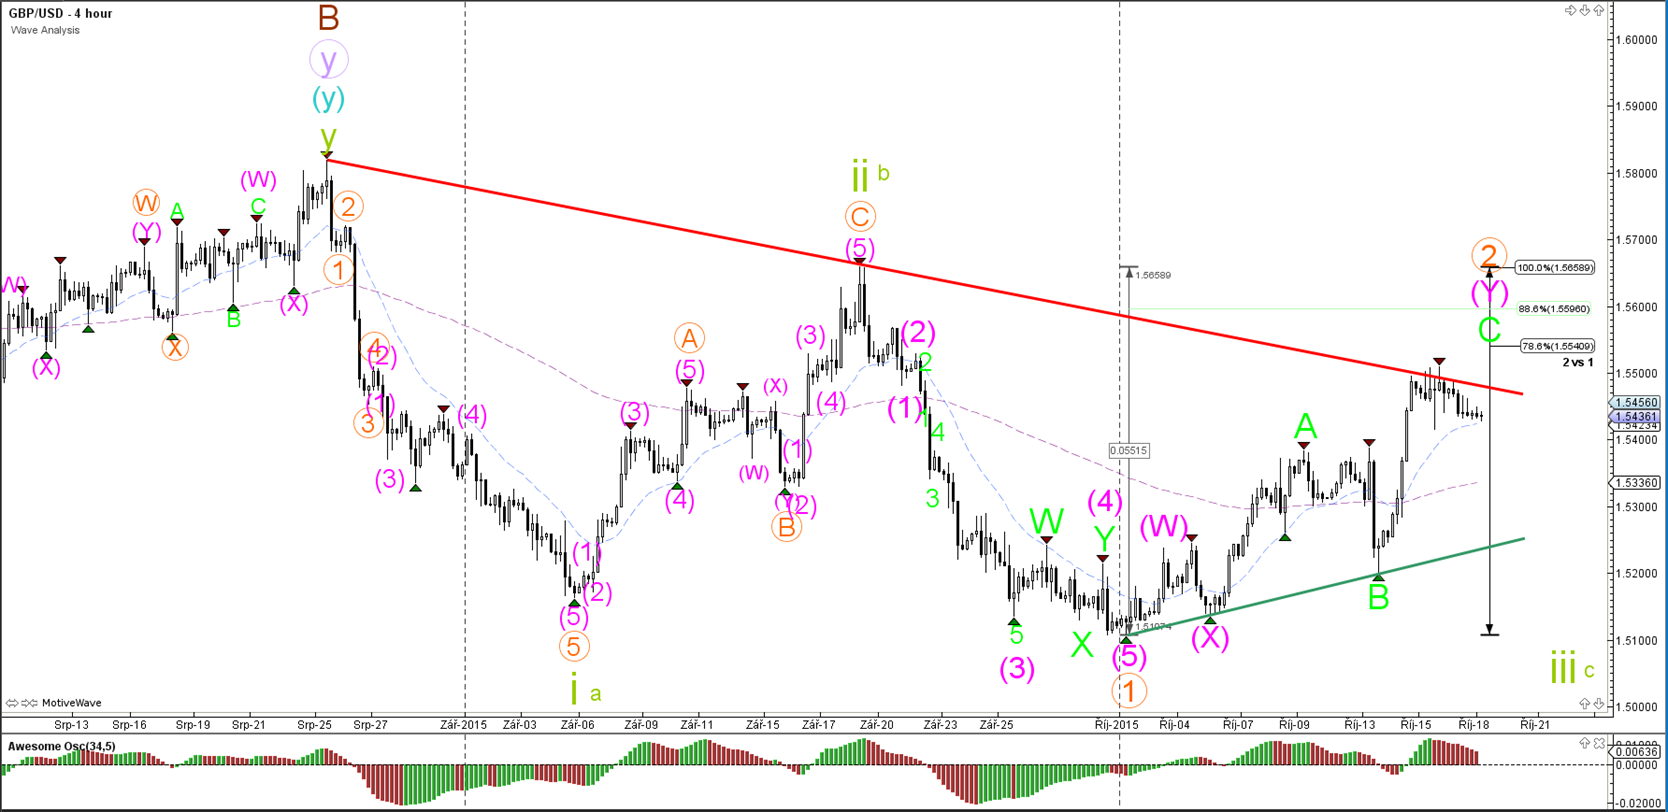
The GBP/USD has indeed made the rally up from the support (green) trend line and the wave B turning spot all the way to the resistance trend line (red). Considering the strong bullish momentum, price could still make one more push up towards the 78.6% and 88.6% Fibonacci levels. The 100% level marks the invalidation level for wave 2 (orange).

1 hour


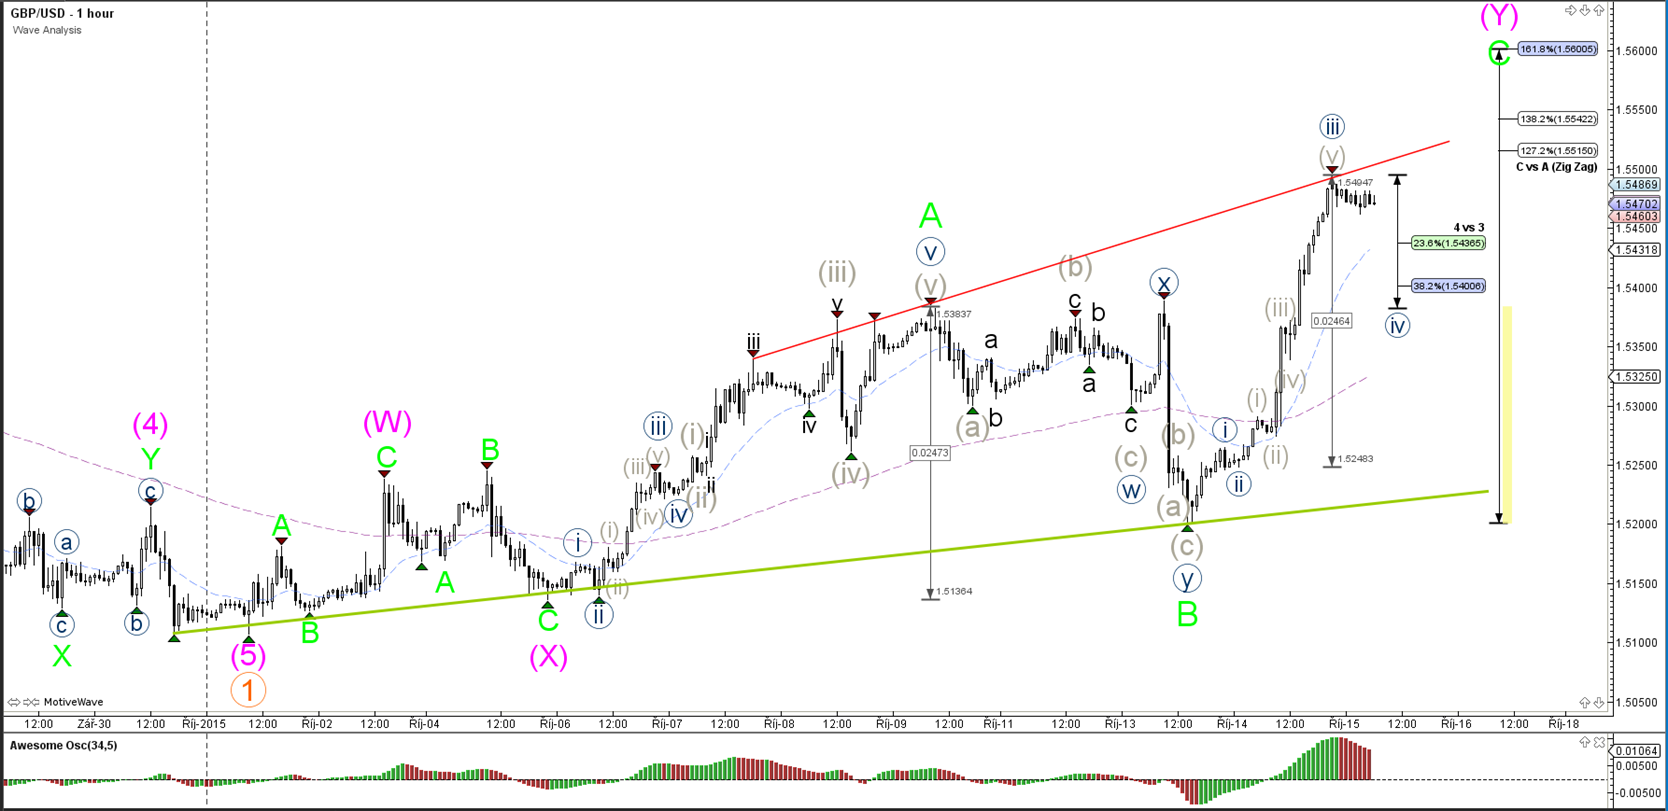
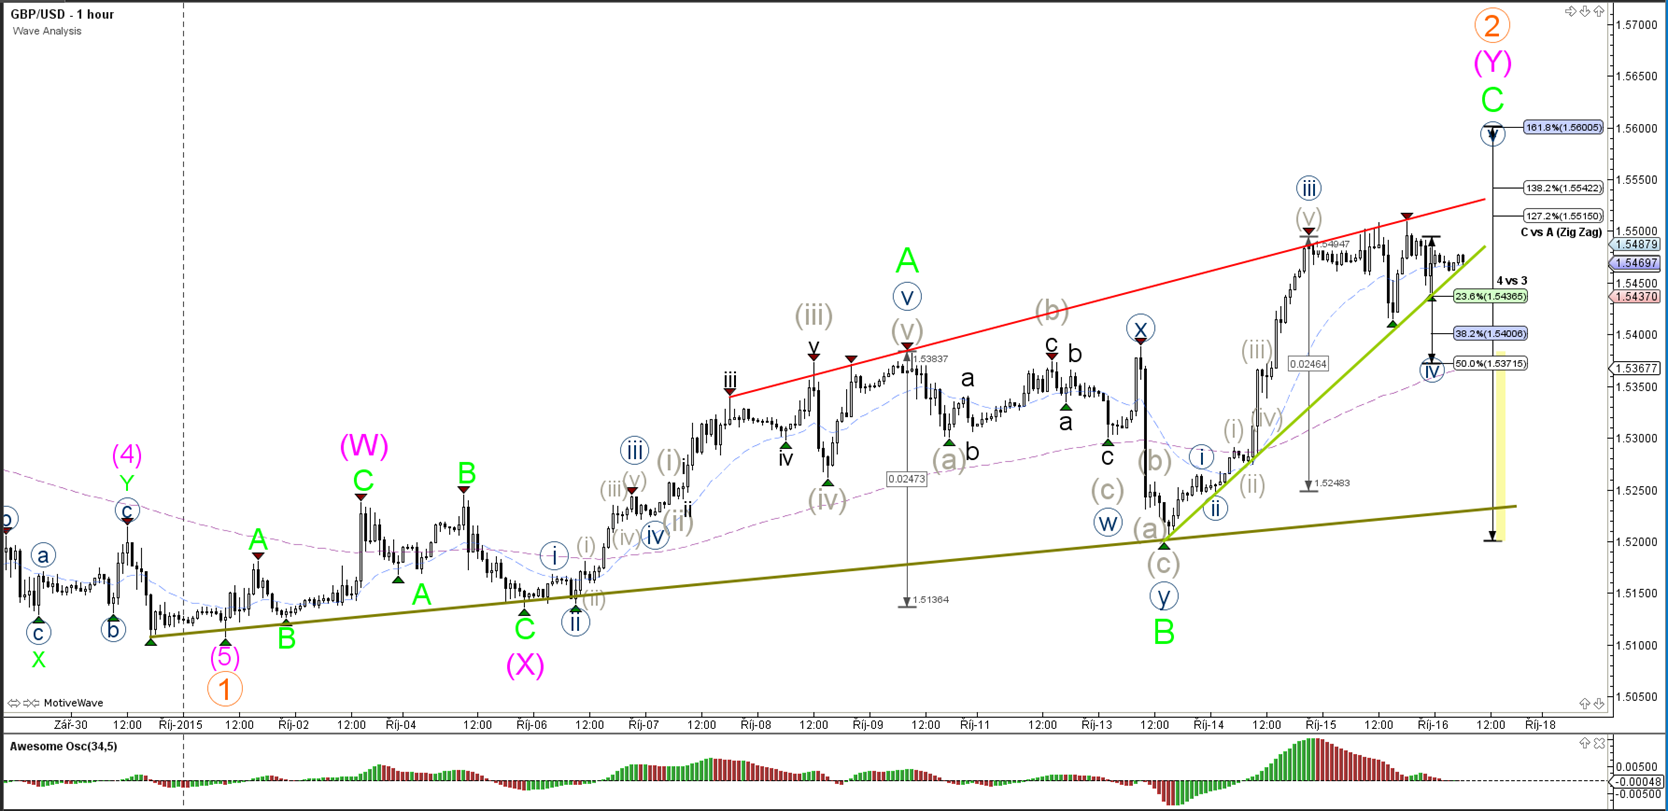
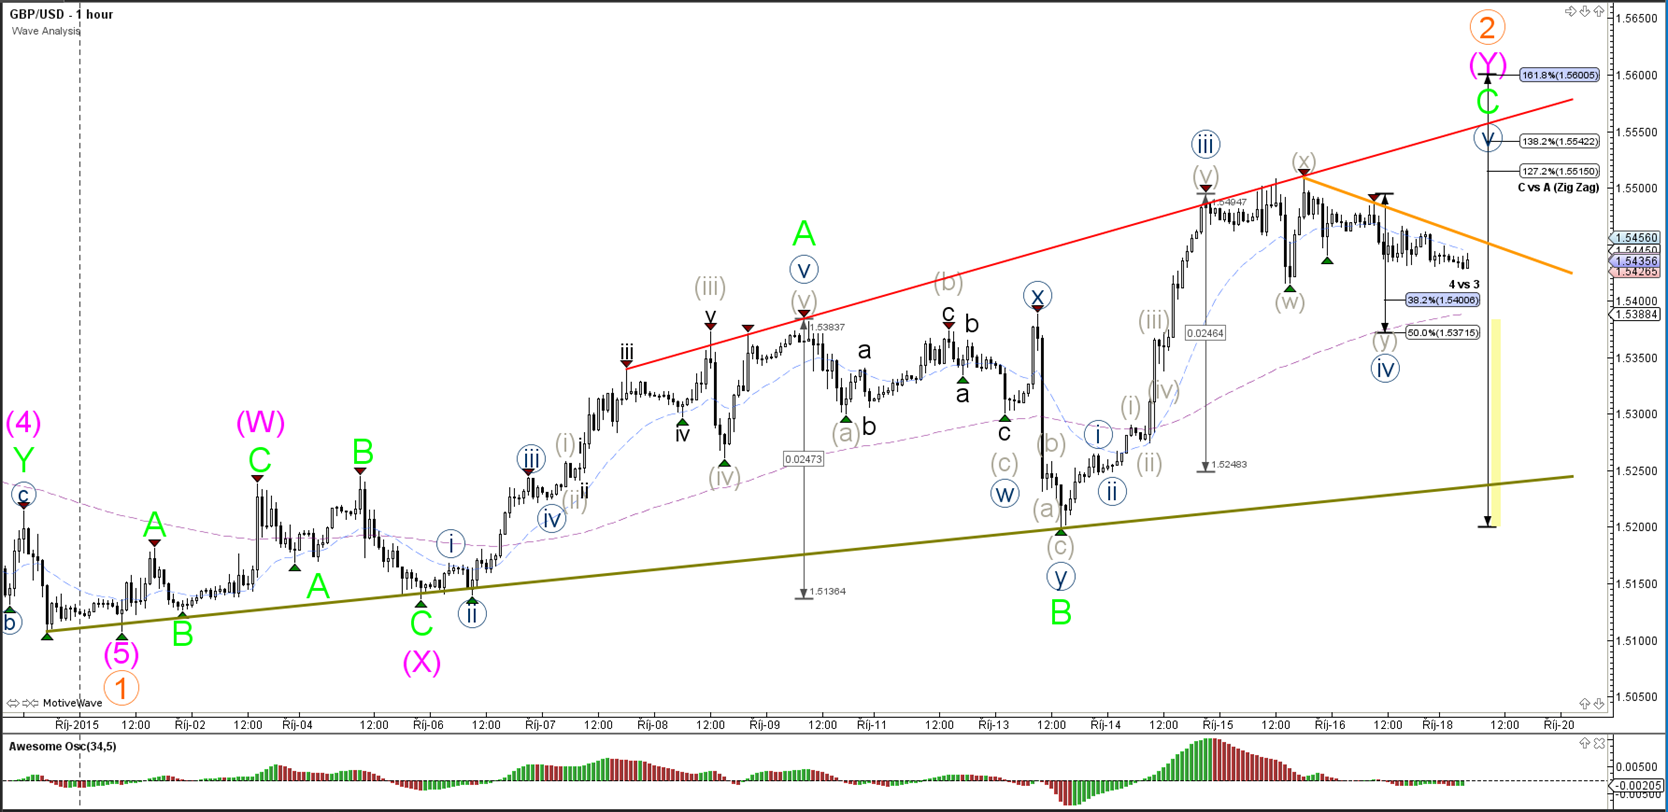
The GBP/USD showed acceleration during its wave C (green) development. Considering that strong bullish impulse, it seems most likely that the current upside will not top here and that a wave 4 and (blue) within that wave C is still remaining. A break below the 38.2% or 50% Fibonacci (4 vs 3) decreases the chances of a wave 4 occuring.

USD/JPY

4 hour


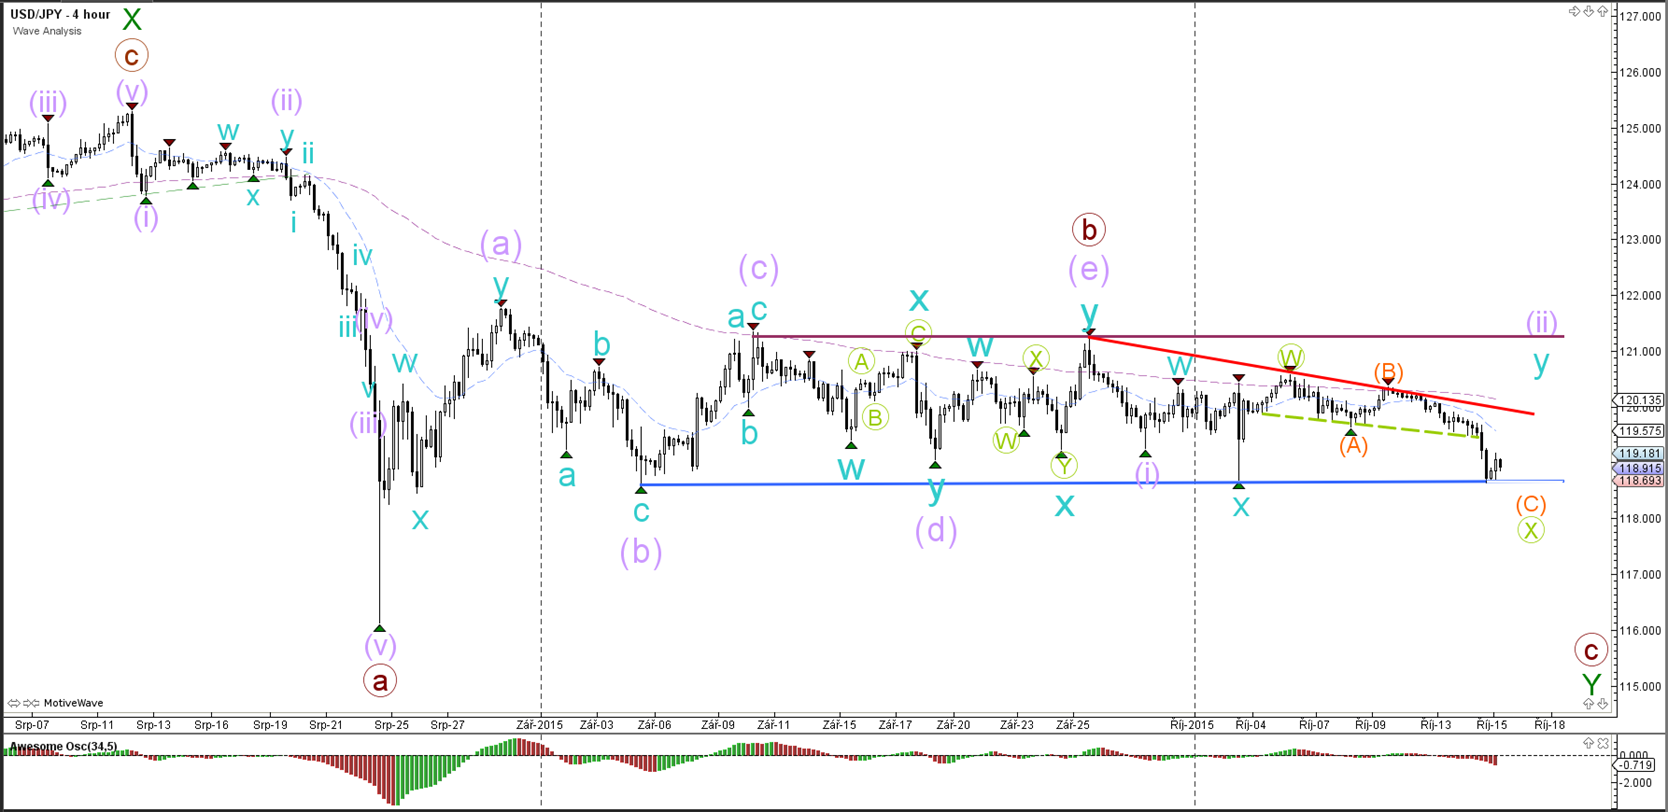
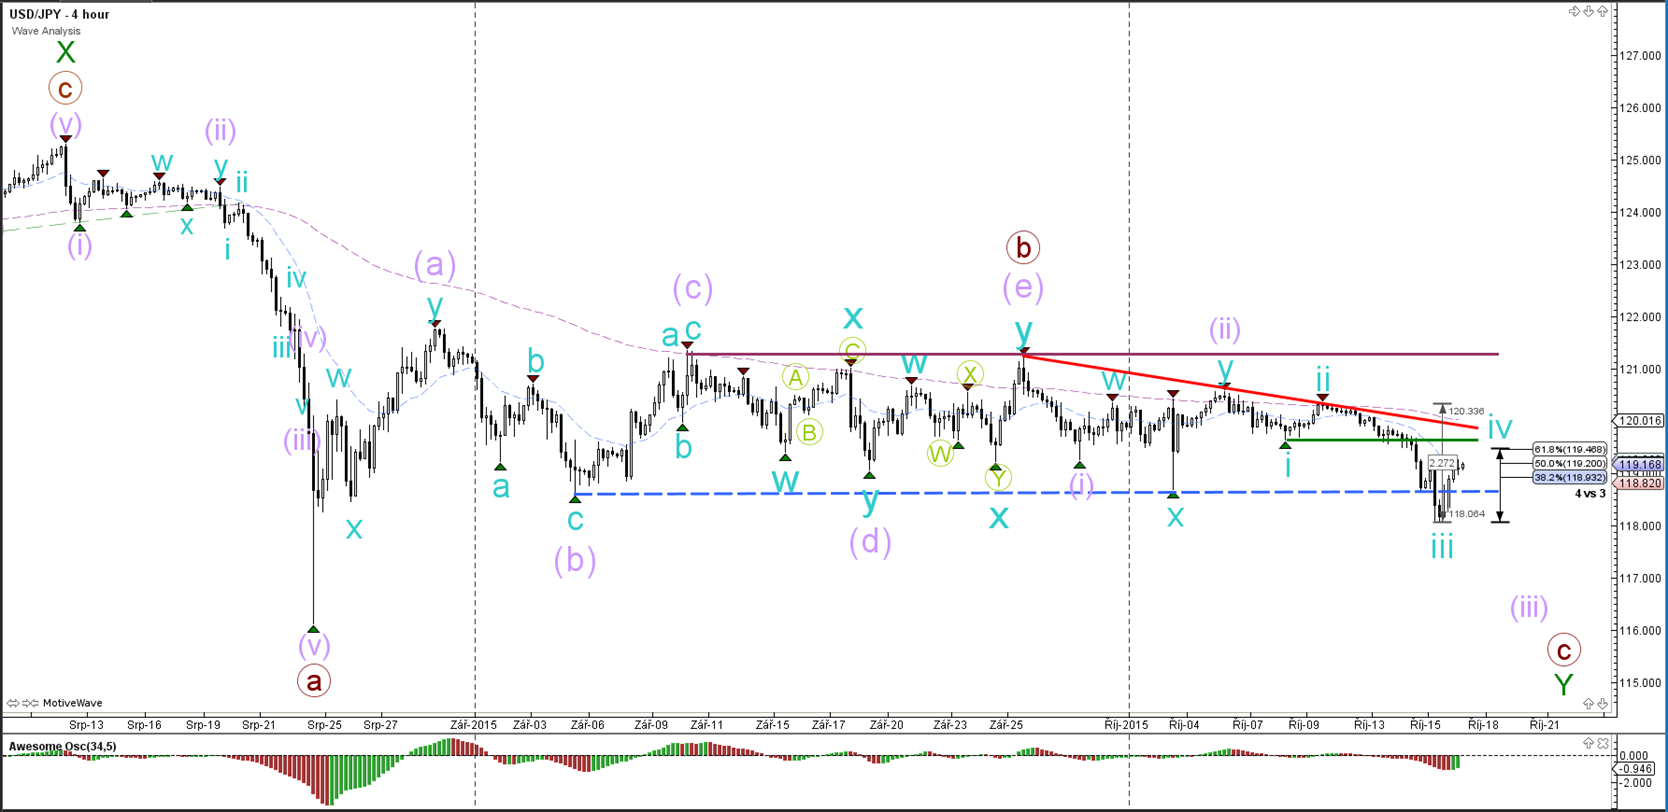
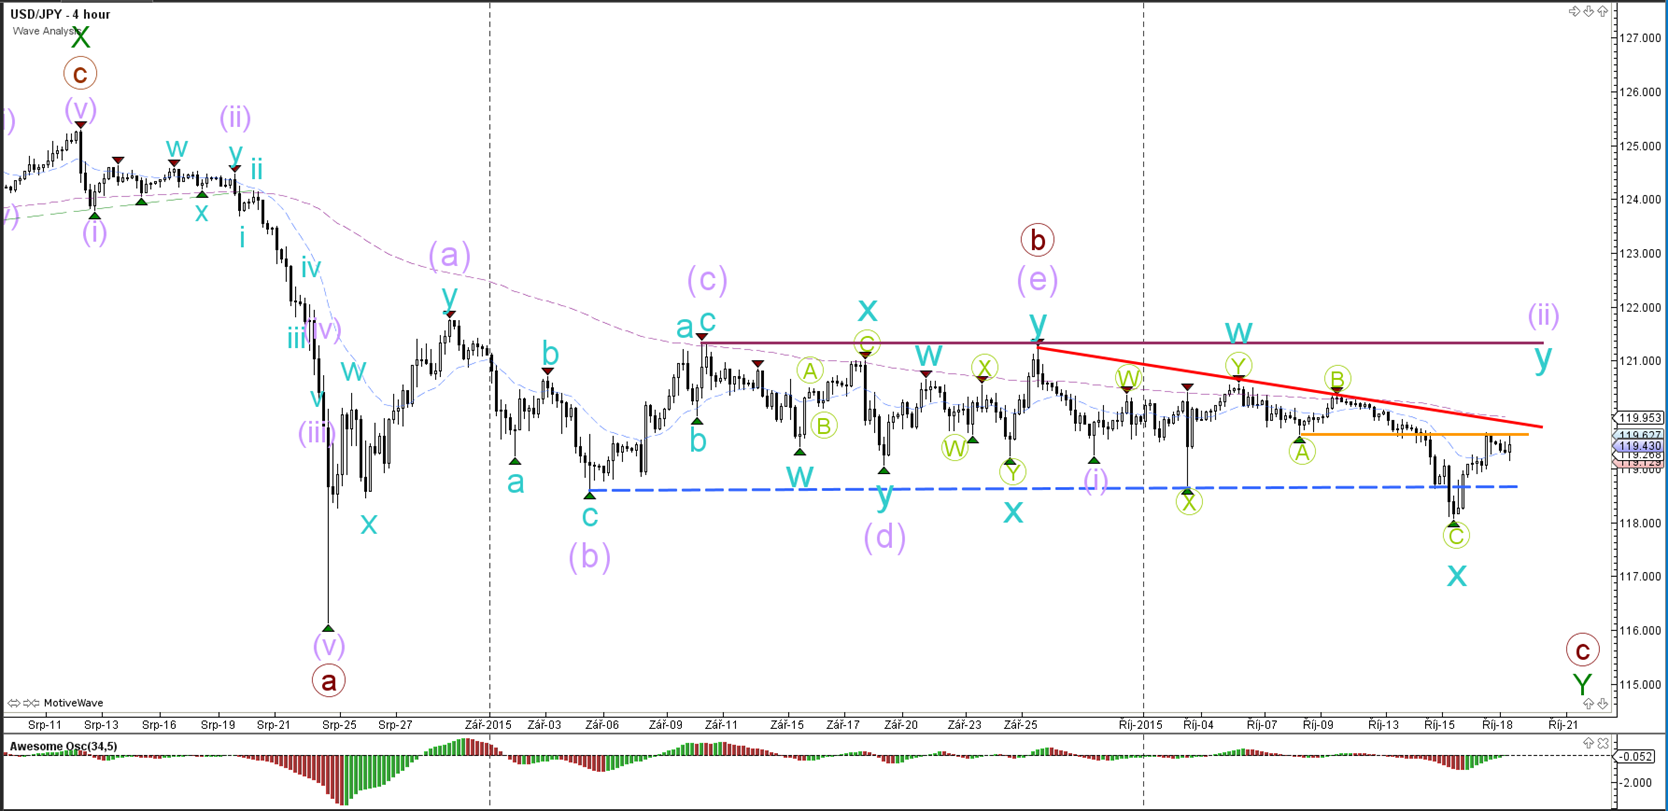
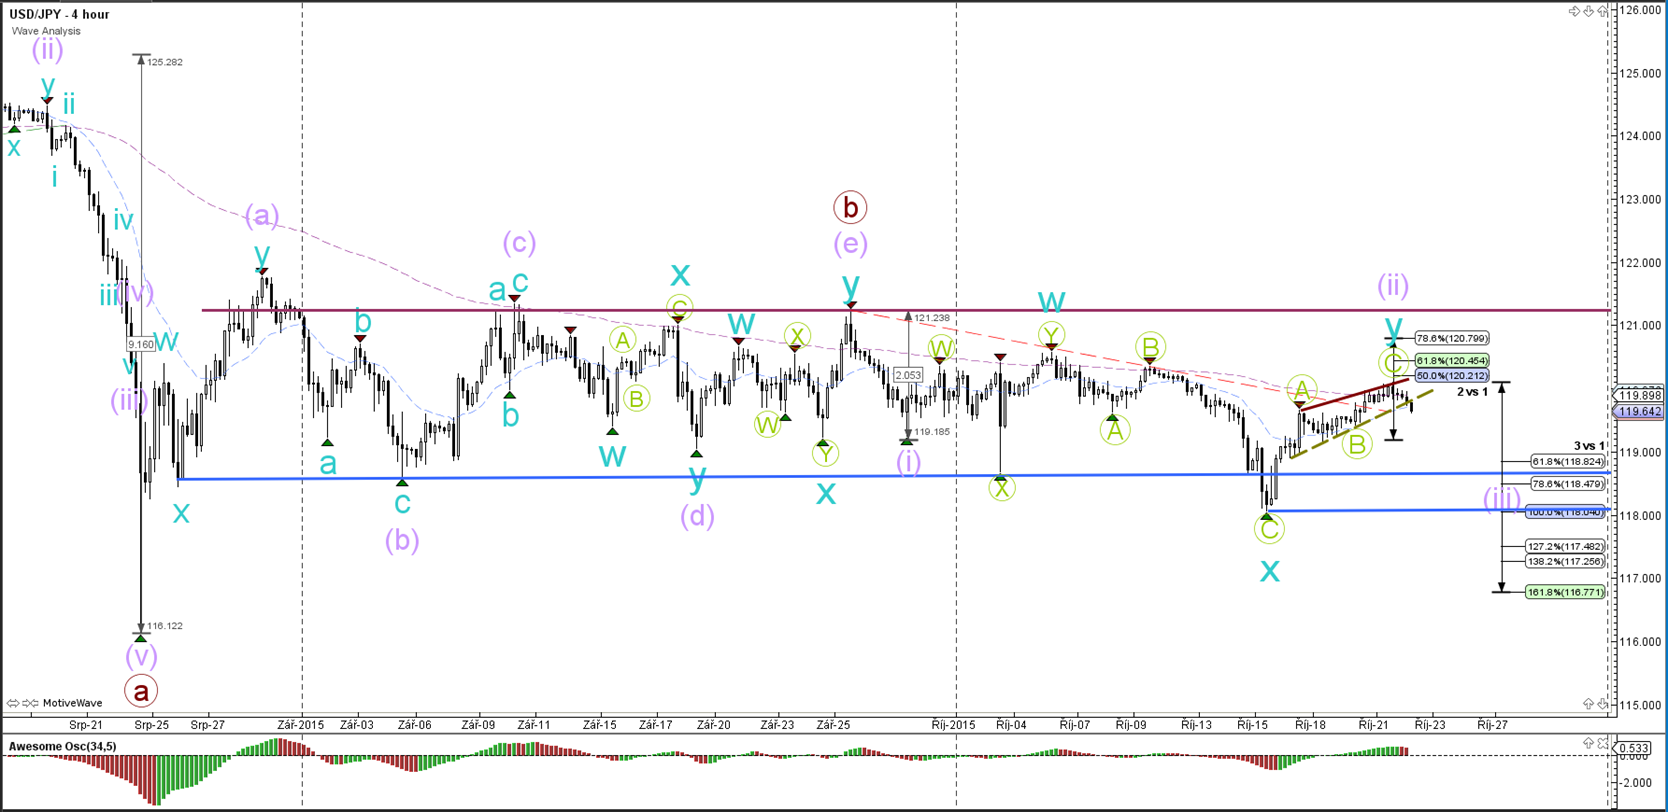
The USD/JPY has moved down towards a major support level (blue) of the sideways zone. A break below support would change the wave count from an ABC (orange) to a 123 and mark the wave 2 (purple) as completed.


“Original analysis is provided by Admiral Markets
 
EUR/USD Completes Bullish Wave 5 and Starts Bearish Wave 1

EUR/USD

4 hour


The EUR/USD seems to have completed a bullish 5 wave (green), which in turn could have completed the larger wave 2 (green) or wave B (green). Price has reached an interesting point where it will either continue with the bullish correction up to the 78.6% Fibonacci retracement level or start a new bearish impulse as marked on the current chart with a wave 1-2 (orange).

1 hour


The EUR/USD broke the support trend line (dotted green) which thereby completed the bullish 5 wave structure (green) and wave C (blue). Price could now be starting a new bearish impulse when analyzing the 5 waves down (pink). A break of the 100% Fib level invalidates the bearish count and indicates the potential for price to move up to the 78.6% Fib on the 4 hour chart.

GBP/USD

4 hour


The GBP/USD has been struggling around the resistance trend line (red). Another layer of resistance is slightly higher at the 78.6% and 88.6% Fibonacci retracement levels. A move up towards that level could complete the expected ABC formation (green). A break above the 100% level invalidates the wave 1-2 (orange). A break below the support trend line (green) is needed before a wave 3 or C (green) becomes more likely.

1 hour


The GBP/USD is using the support from the wave 4 Fibonacci levels. A break below the 50% Fibonacci level indicates that the wave 5 (blue) and wave C (green) have completed at the most recent top. At the moment there is a decent chance that price will push higher within the wave 5 (blue) to the 78.6/88.6% region of the 4 hour chart.

USD/JPY

4 hour


The USD/JPY managed to break below the support (blue) of the sideways zone but quickly reverted back into the area. Whether price has sufficient steam to make a sustainable bearish breakout remains to be seen. It will be interesting to see how price reacts when it retraces back to the mean: will there be a bounce for more downside or will price relapse into a consolidation?


“Original analysis is provided by Admiral Markets
 
GBPUSD Prepared for Bullish Wave 5 Breakout

EUR/USD

4 hour


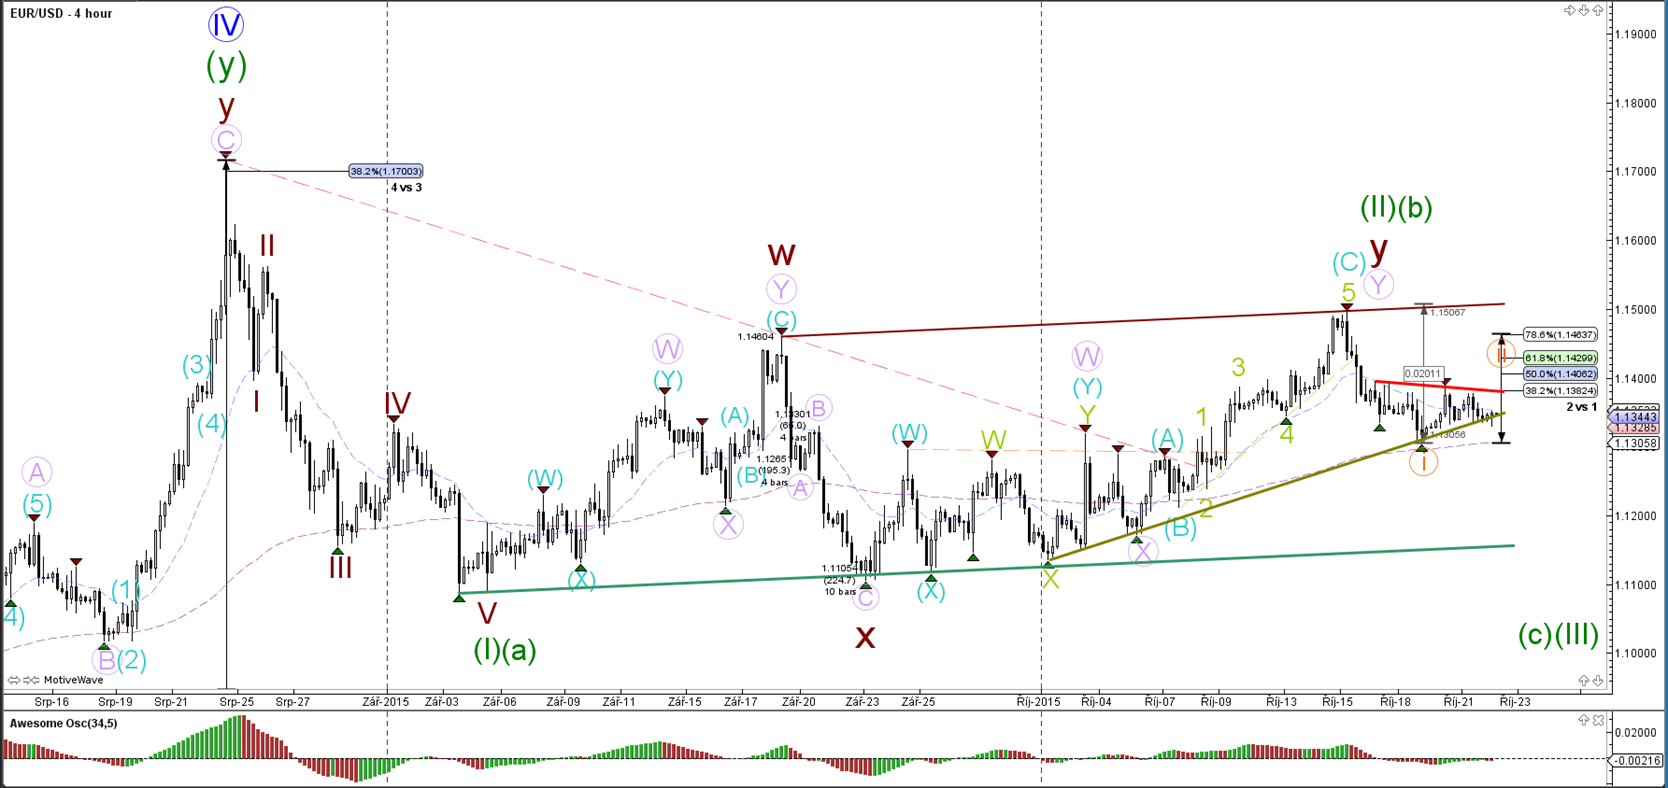
Whether the EUR/USD completed its bullish price action and thereby wave 2 or wave B (greens) depends on whether price is able to push below the various layers of support (green trend lines).

1 hour


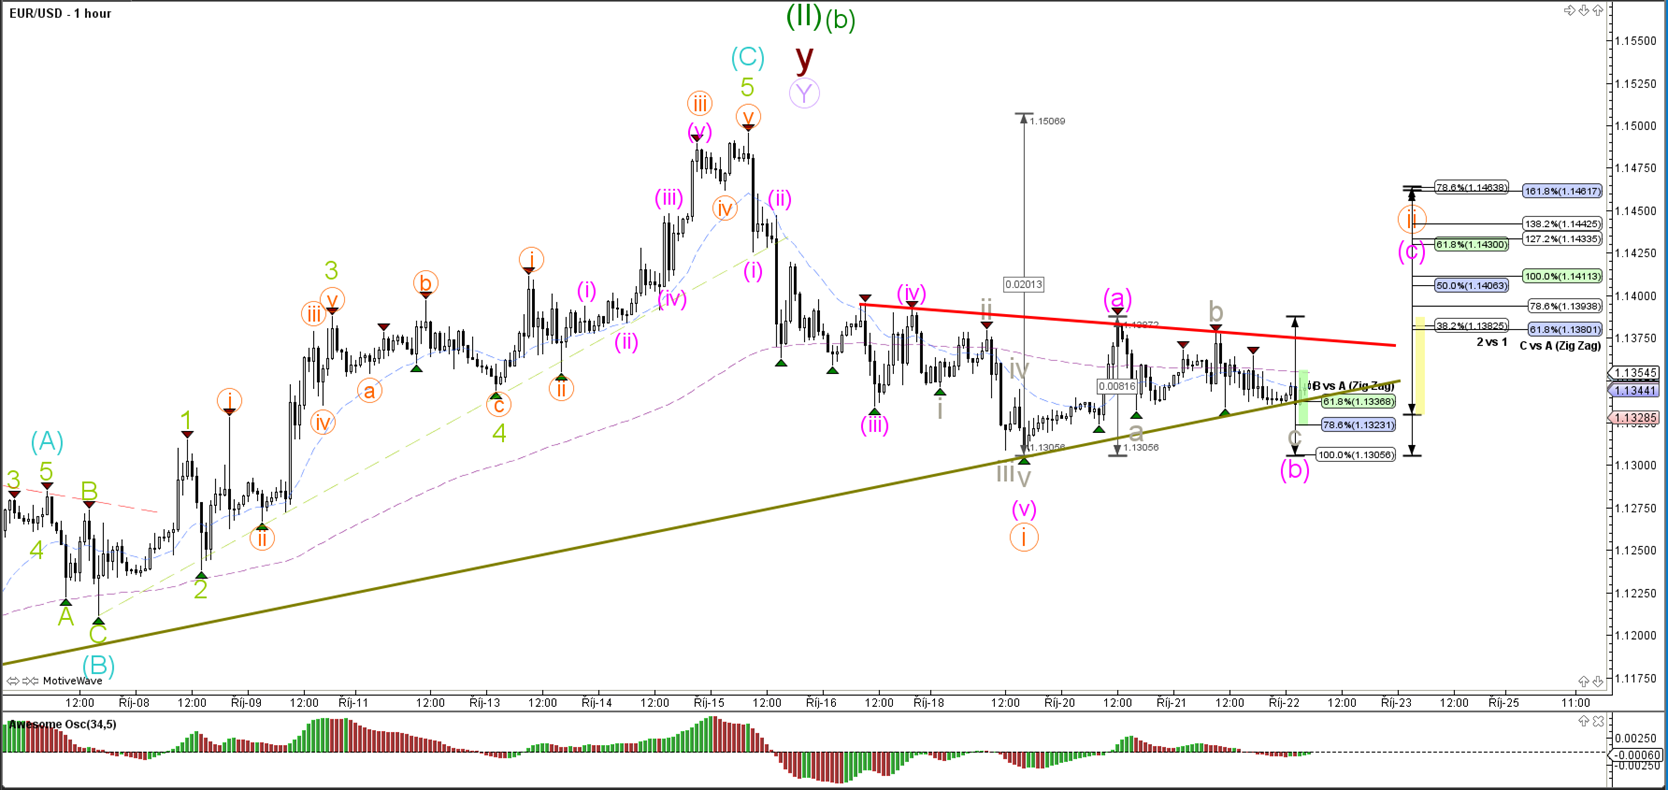
The EUR/USD is in a mini triangle chart formation (red / green lines). It has wave 2 resistance Fib levels above it and support trend lines below it. At the moment a bearish turn seems the most likely wave count (current 1-2 orange).

GBP/USD

4 hour


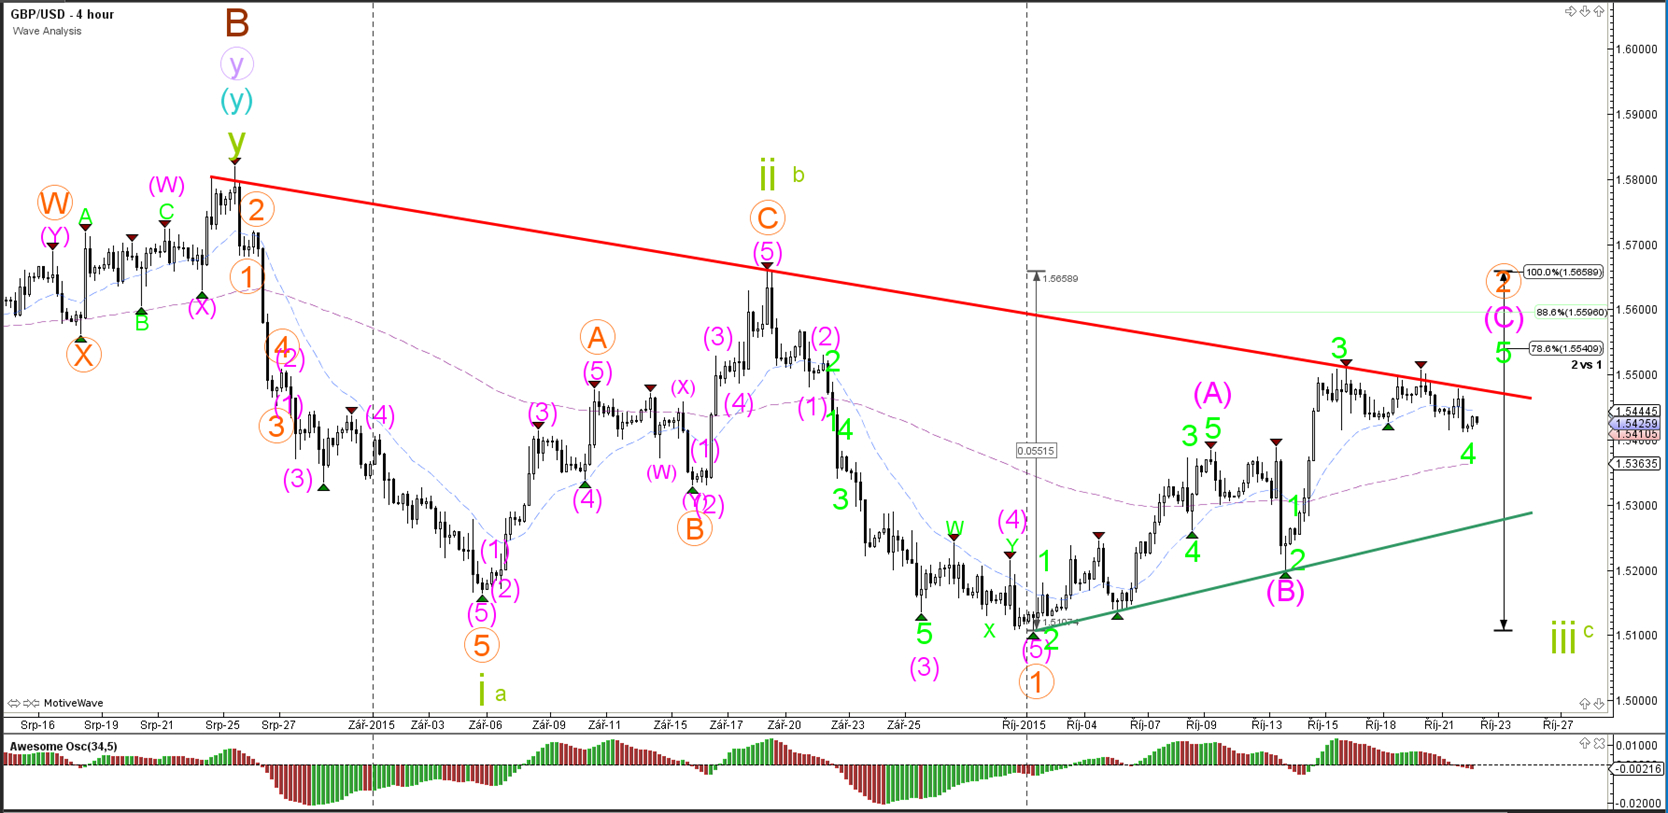
The GBP/USD has not managed to break the resistance trend line (red) but if price does break it, then another resistance zone is higher at the 78.6% and 88.6% Fibonacci retracement. A move up towards that level could complete the expected ABC formation (green). A break above the 100% level invalidates the wave 1-2 (orange). A break below the support trend line (green) is needed before a wave 3 or C (green) becomes more likely.

1 hour


The GBP/USD is building a wave 4 (blue) consolidation zone. A break above resistance (orange) would increase the chance of the development of a wave 5 (blue). A break below the 50% Fibonacci retracement level increases the likelihood that the ABC (green) has already been completed.

USD/JPY

4 hour


The USD/JPY price action was not able to push away from the consolidation zone and price reverted back to the moving averages.


“Original analysis is provided by Admiral Markets
 
EUR/USD Downtrend Channel Challenges Support Trend Lines

EUR/USD

4 hour


The EUR/USD price action has been moving choppily within the wave 2 or wave B (green). A downtrend is confirmed when price has made a clear higher low via a potential wave 2 (orange) or when price breaks the 2 support trend lines.

1 hour


The EUR/USD broke the mini support trend line (dotted green) and moved down lower to the next support (olive green). A break below it could see another extension of wave 5 (pink) of wave 1 (orange). A break above the top of the channel (red) could see price move towards the wave 2 resistance Fibs.

GBP/USD

4 hour


The GBP/USD is attempting to break the resistance trend line (red) and if price does break it, then another resistance zone is higher at the 78.6% and 88.6% Fibonacci retracement. A move up towards that level could complete the expected ABC formation (green). A break above the 100% level invalidates the wave 1-2 (orange). A break below the support trend line (green) is needed before a wave 3 or C (green) becomes more likely.

1 hour


The GBP/USD is building a wave 4 (blue) triangle formation. A break above resistance (orange) would increase the chance of the development of a wave 5 (blue). A break below the 50% Fibonacci retracement level increases the likelihood that the ABC (green) has already been completed.

USD/JPY

4 hour


The USD/JPY price action is back in the middle of consolidation zone (purple and blue dotted lines).


“Original analysis is provided by Admiral Markets
 
EUR/USD & USD/JPY Developing ABC Zigzag Formation

EUR/USD

4 hour


The EUR/USD broke the resistance (dotted red) and has moved up towards the 38.2% Fibonacci level of wave 2 (orange). Typically waves 2 tend to see deep retracements on average, which could see price move towards the 61.8% or 78.6% Fibs. A break of support (olive green) could trigger the start of a bearish breakout whereas a break above the 100% level invalidates the 1-2 (orange).

1 hour


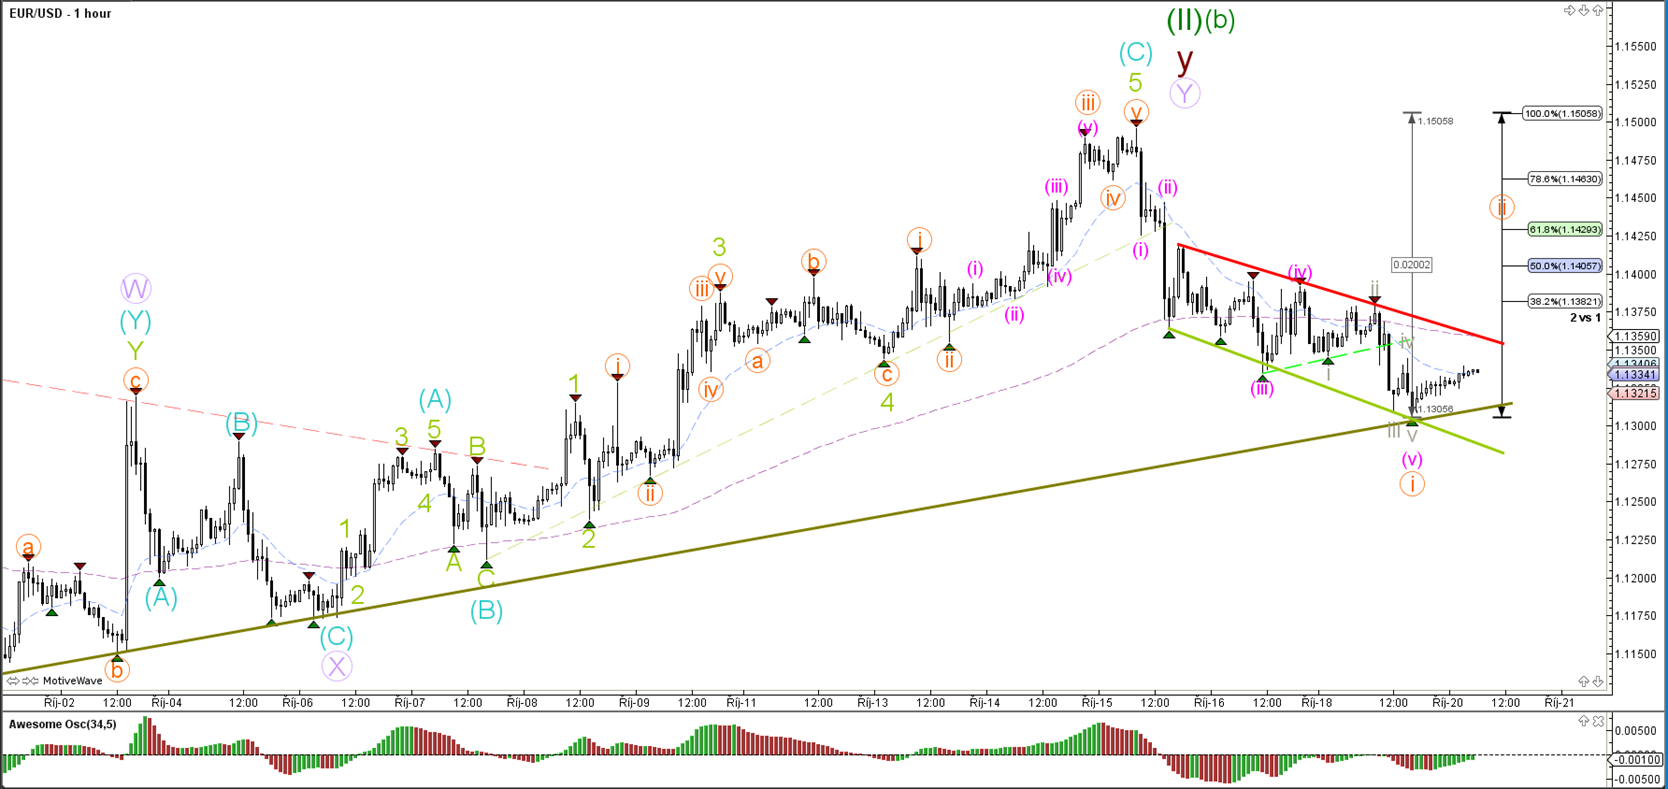
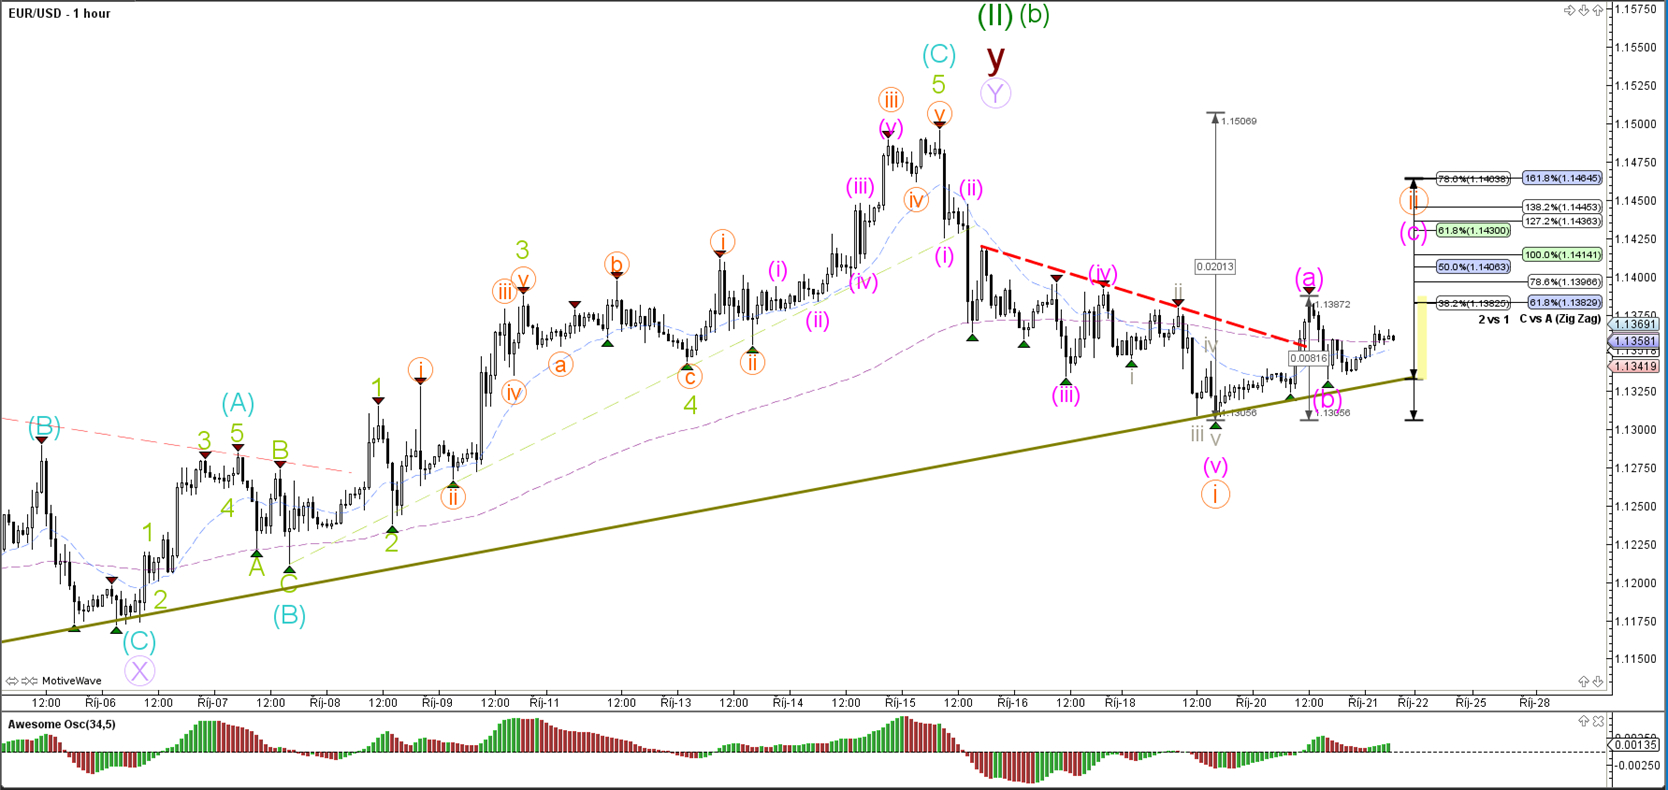
The EUR/USD break above resistance (dotted red) can be considered impulsive, which in turn increases the likelihood of an ABC zigzag (pink) development within the wave 2 (orange).

GBP/USD

4 hour


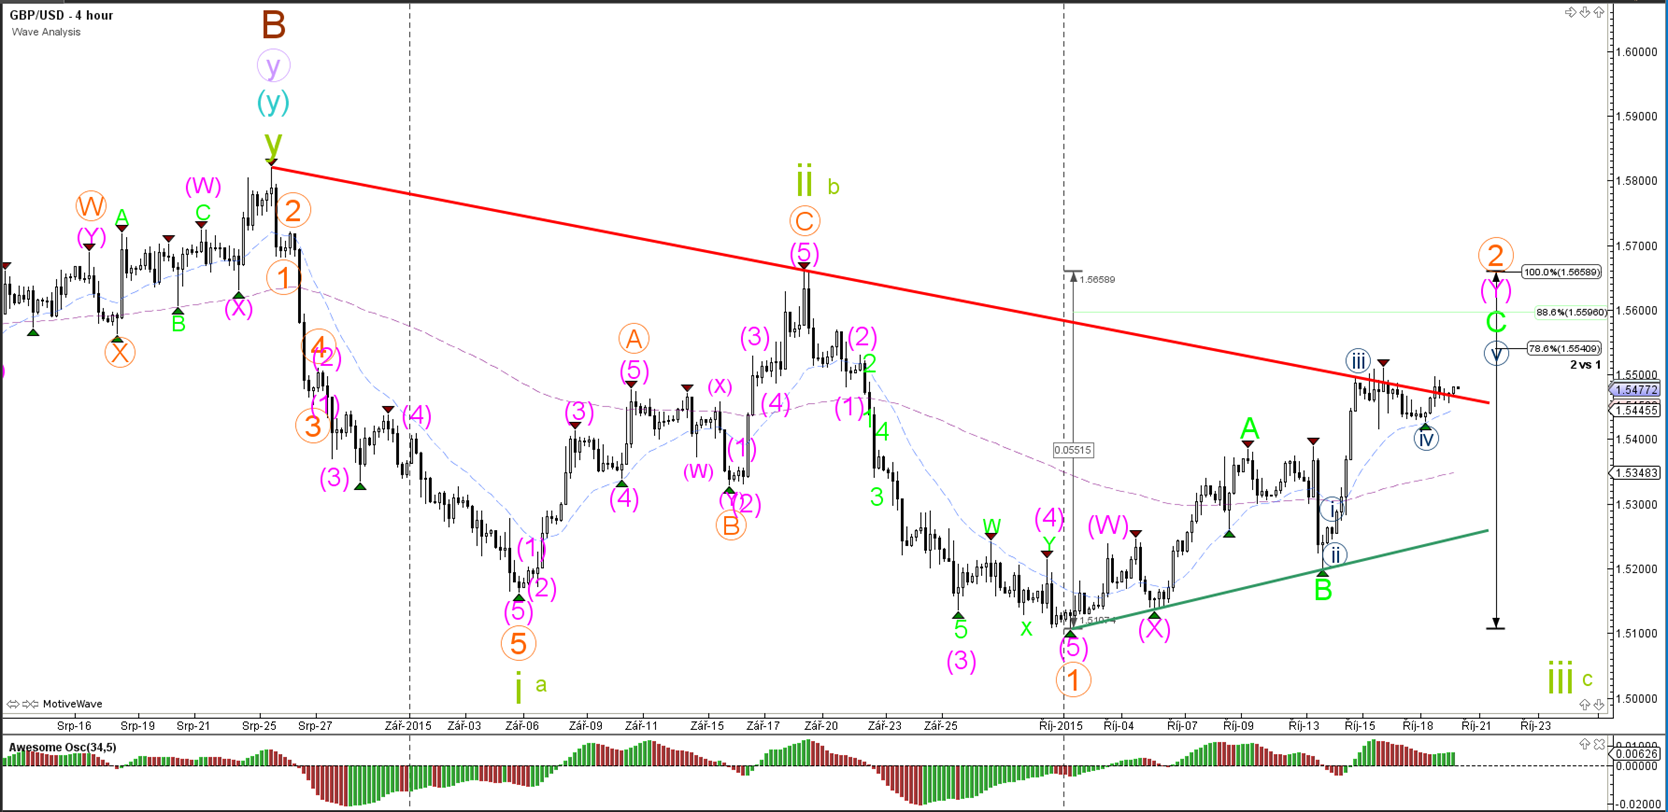
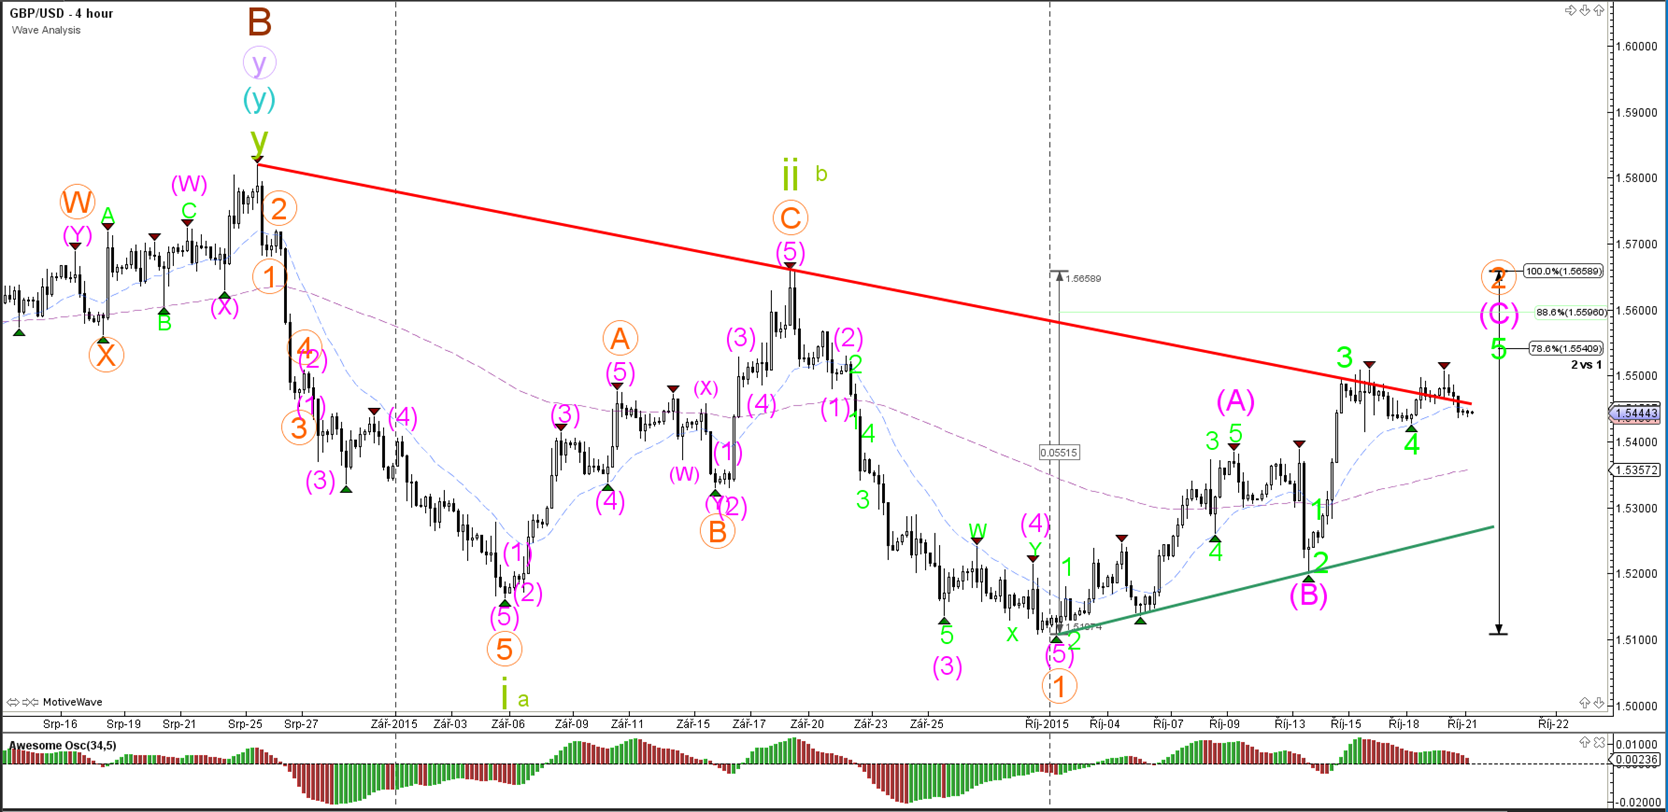
The GBP/USD is struggling at the resistance trend line (red) and it has more resistance at the 78.6% and 88.6% Fibonacci retracement levels. A move up towards that level could complete the expected ABC formation (green). A break above the 100% level invalidates the wave 1-2 (orange).

1 hour


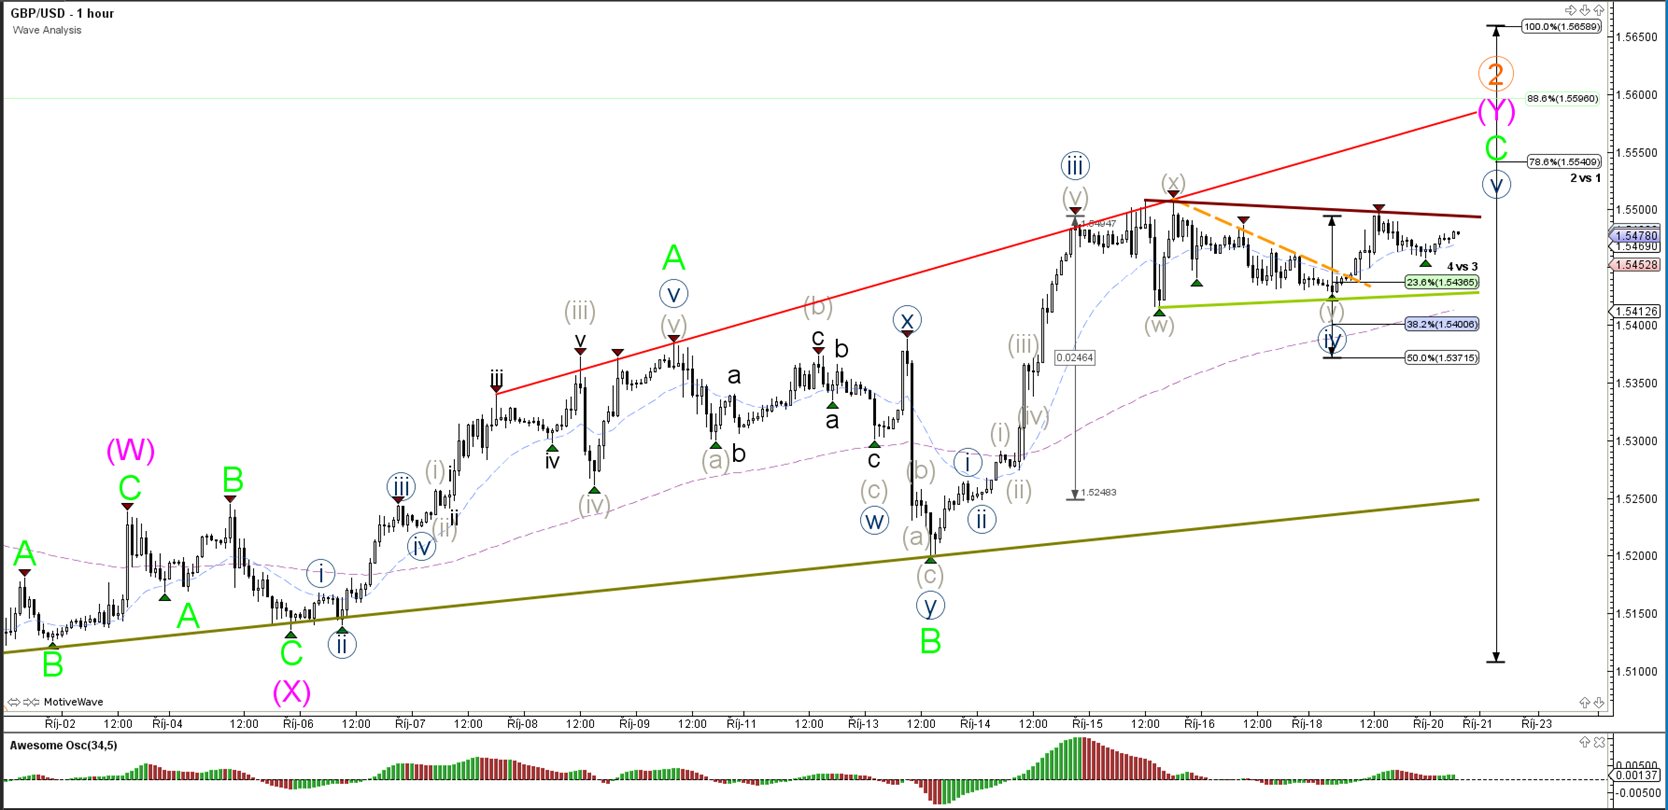
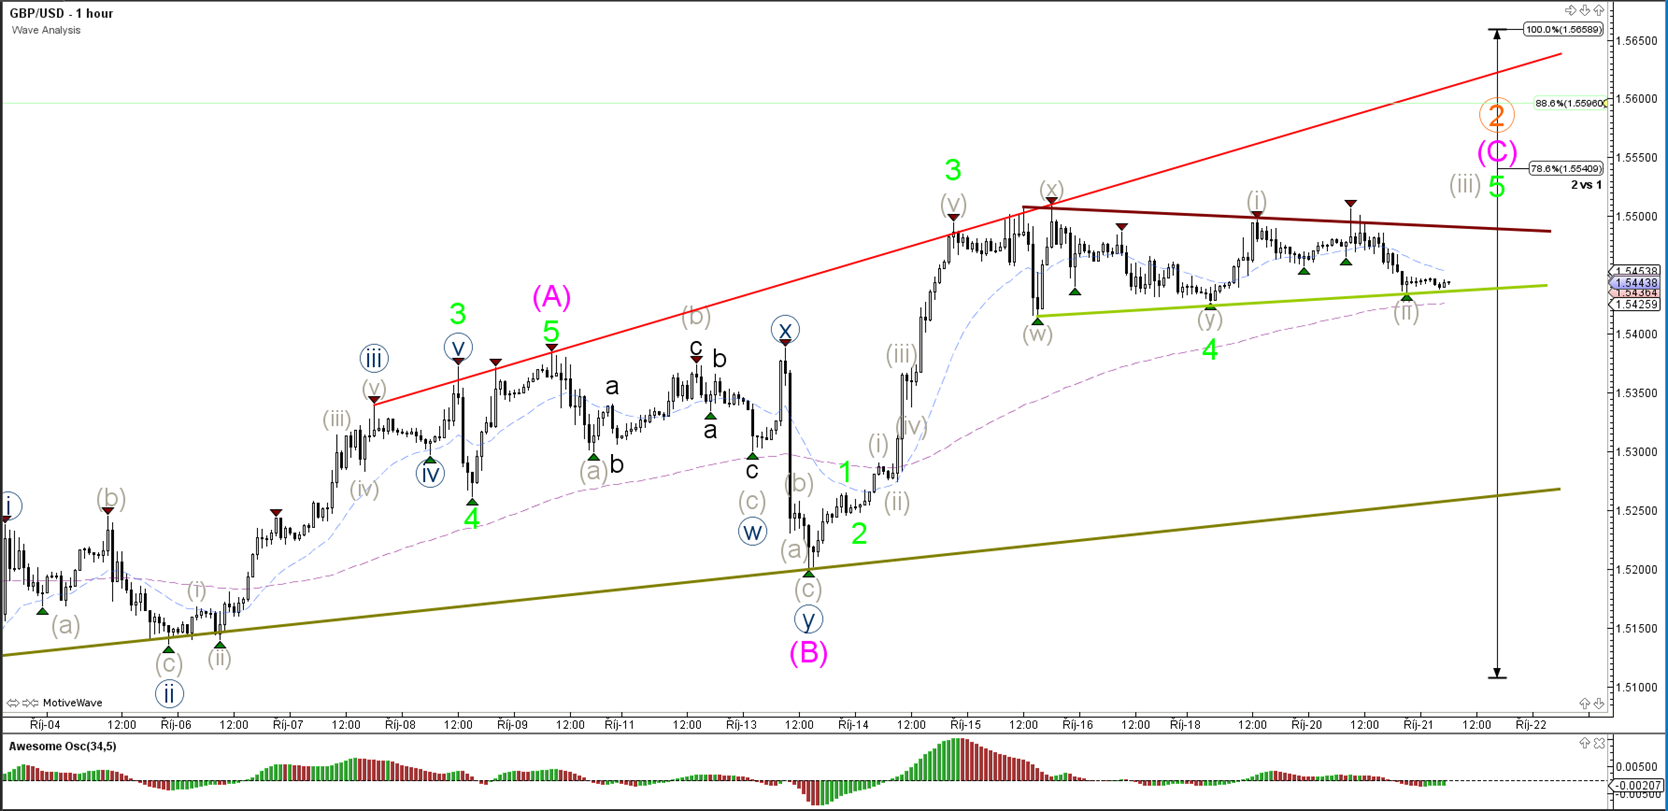
The GBP/USD has 2 different scenarios: 1) price has completed the wave 5 (blue) at the recent top, which most likely would be confirmed once break below the triangle support (green) or 2) price will building an ending diagonal (grey 123) within wave 5 (blue).

USD/JPY

4 hour


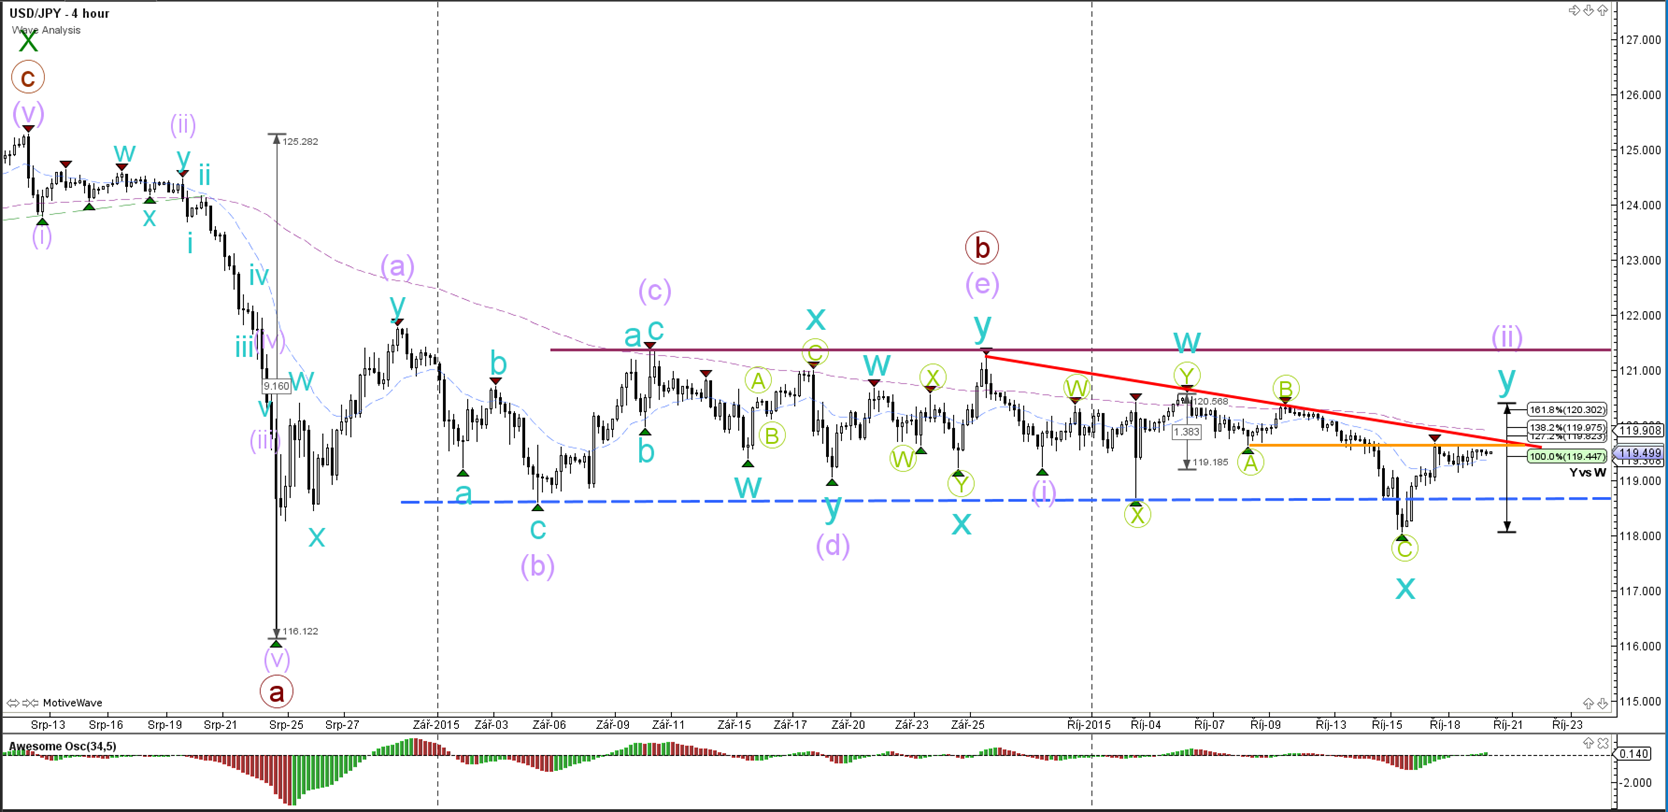
The USD/JPY broke the resistance levels (orange/red) and thereby made a bullish break above the ascending wedge. The invalidation level of the wave 2 (purple) is at the previous top (purple line).


“Original analysis is provided by Admiral Markets
 
EUR/USD & GBP/USD Trapped in Triangles with Fibs Nearby

EUR/USD

4 hour


The EUR/USD had calm price action yesterday which stayed in between the support (green) and resistance (red) levels. Today's interest rate decision plus press conference could the catalyst for price to break above or below the contracting triangle.

1 hour


From a wave perspective, could struggle and respect the deeper (50%, 61.8% or 78.6%) Fibonacci levels (break above 100% level invalidates wave 1-2 orange). A break below support (olive green) and the 100% level of wave B (pink) could trigger the start of a bearish breakout.

GBP/USD

4 hour


The GBP/USD could still be in a wave 4 (green), which explains the sideways price movement. A break above the resistance trend line (red) could price complete wave 5 (green) at the 78.6% and 88.6% Fibonacci retracement levels (a break above the 100% level invalidates the wave 1-2 orange).

1 hour


The GBP/USD remains in between the support (green) and resistance (dark red) trend lines. A break below the 50% Fibonacci level of wave 4 (green) is needed before wave 4 can be considered completed at an earlier bottom.

USD/JPY

4 hour


The USD/JPY broke the support trend line (dotted green) which in turn could indicate the completion of wave C (green). Whether price has also completed wave 2 (purple) is dependent on whether price can break below the bottom (blue).


“Original analysis is provided by Admiral Markets
 
EUR/USD Tumbles Lower in Impulsive Wave 3

EUR/USD

4 hour


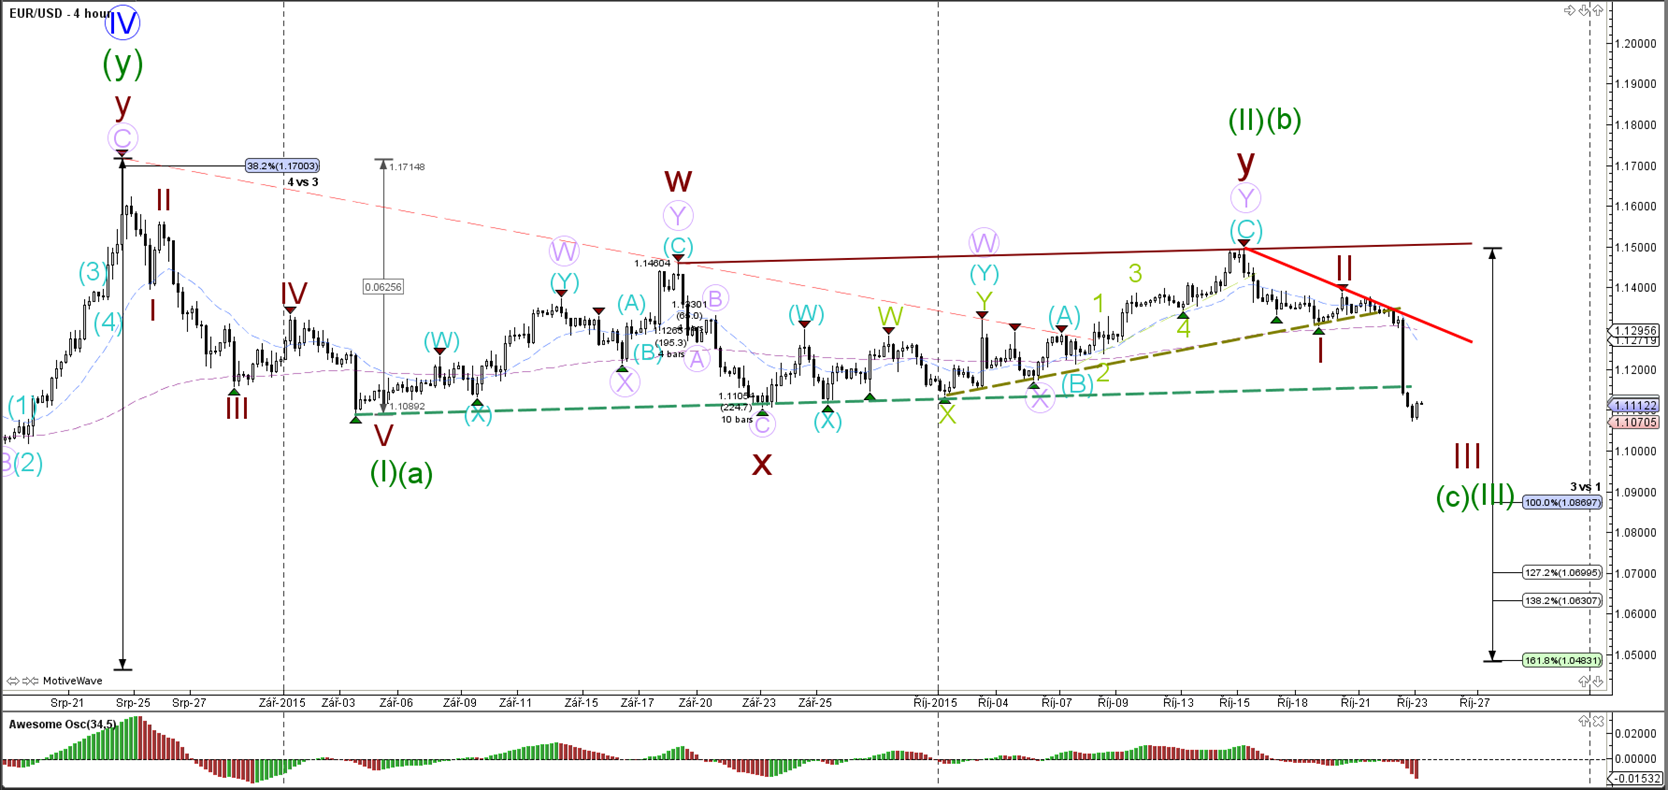
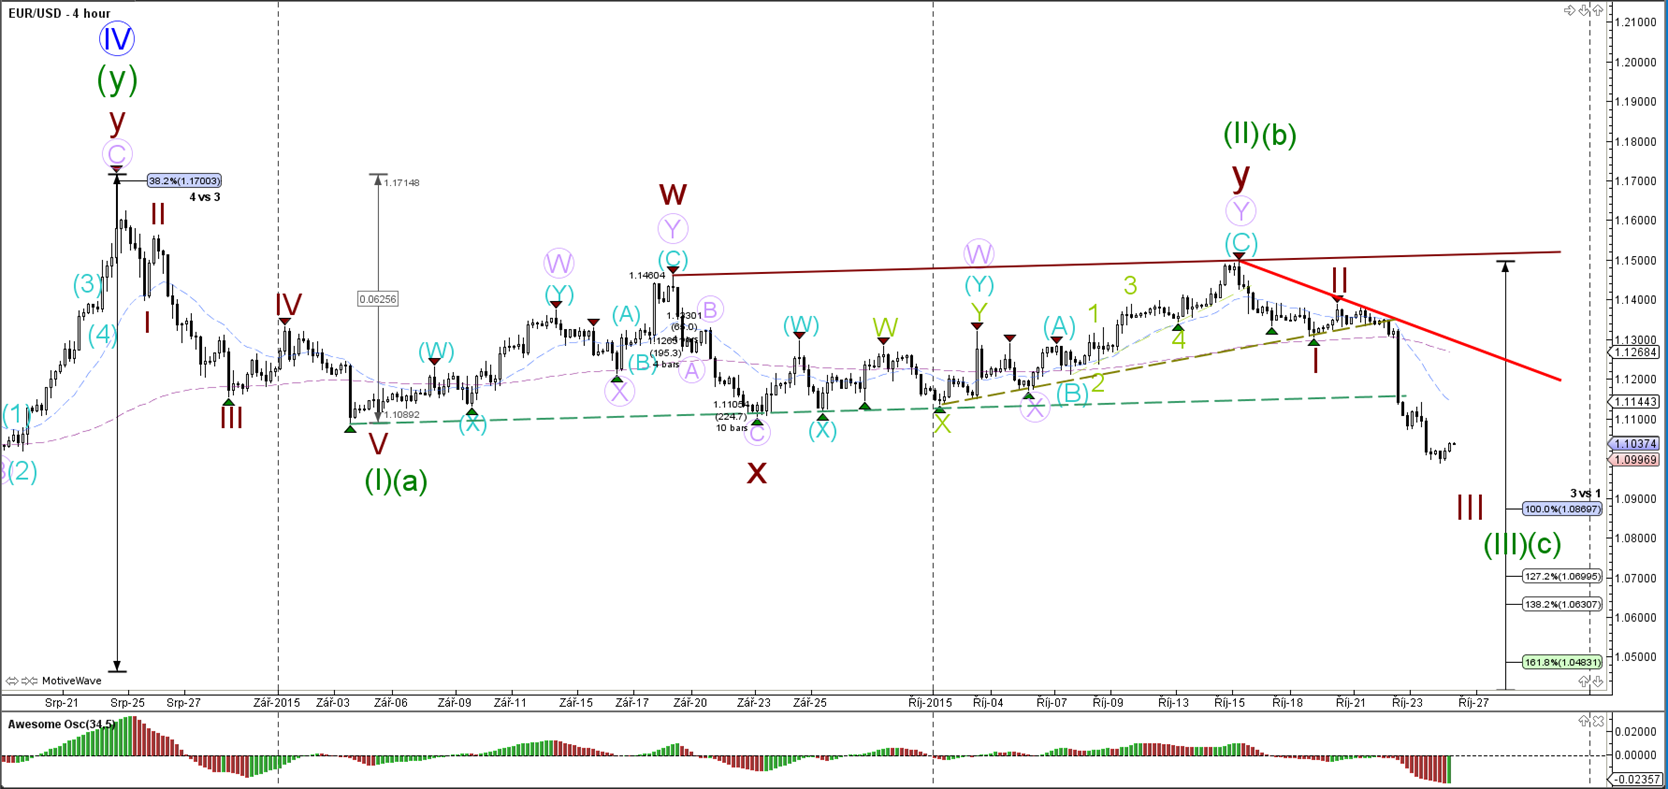
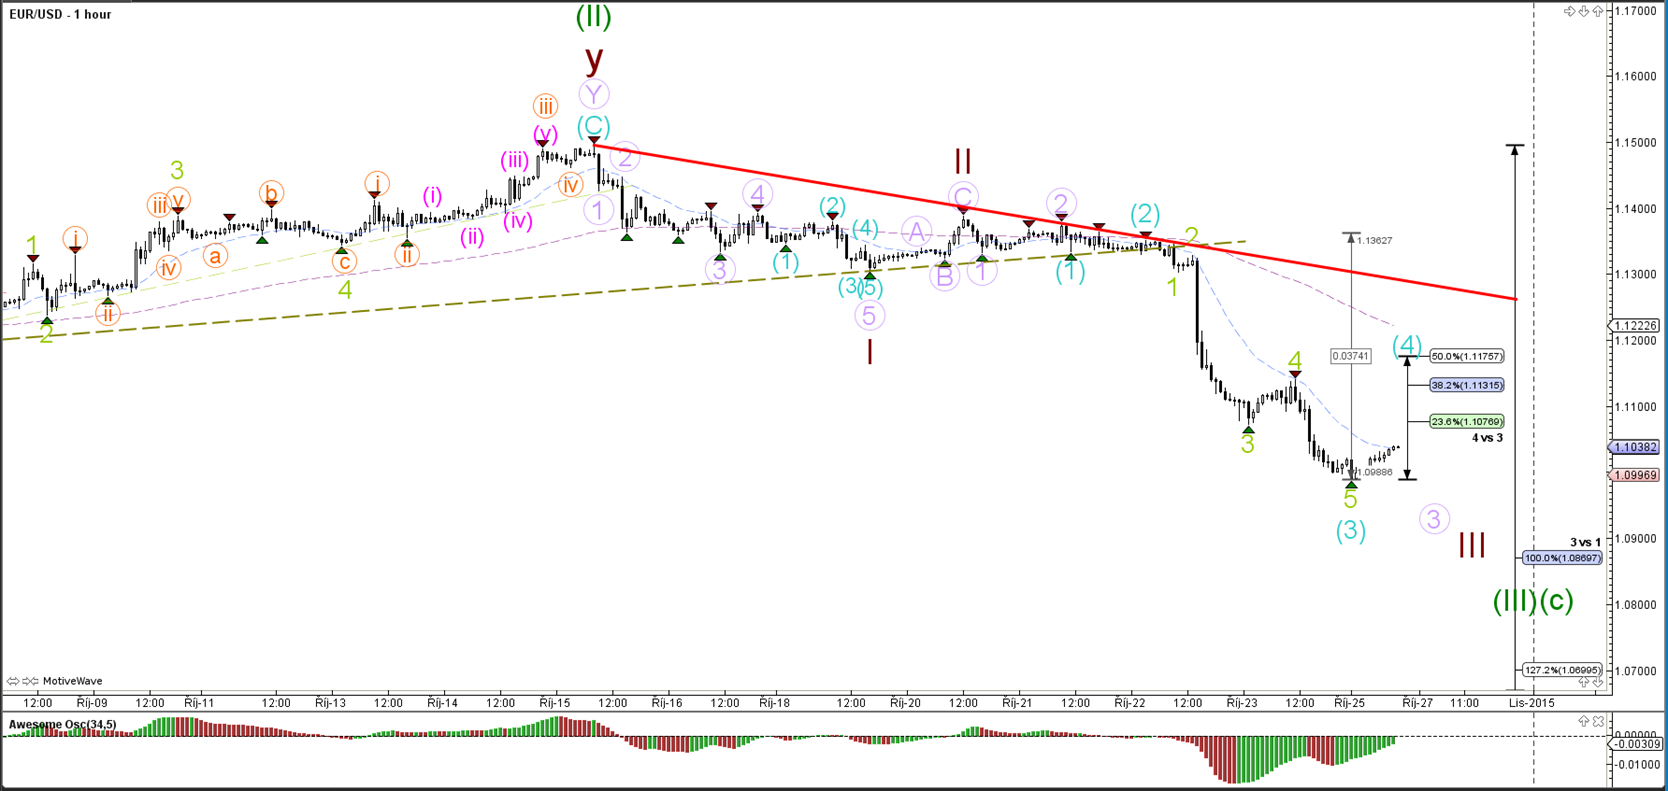
Yesterday's news events connected to the Euro sparked the start of the wave 3 (dark red). Price broke below the various support levels (green) in a very impulsive fashion, which resembles the typical price action of a wave 3 of wave 3 (green/dark red).

1 hour


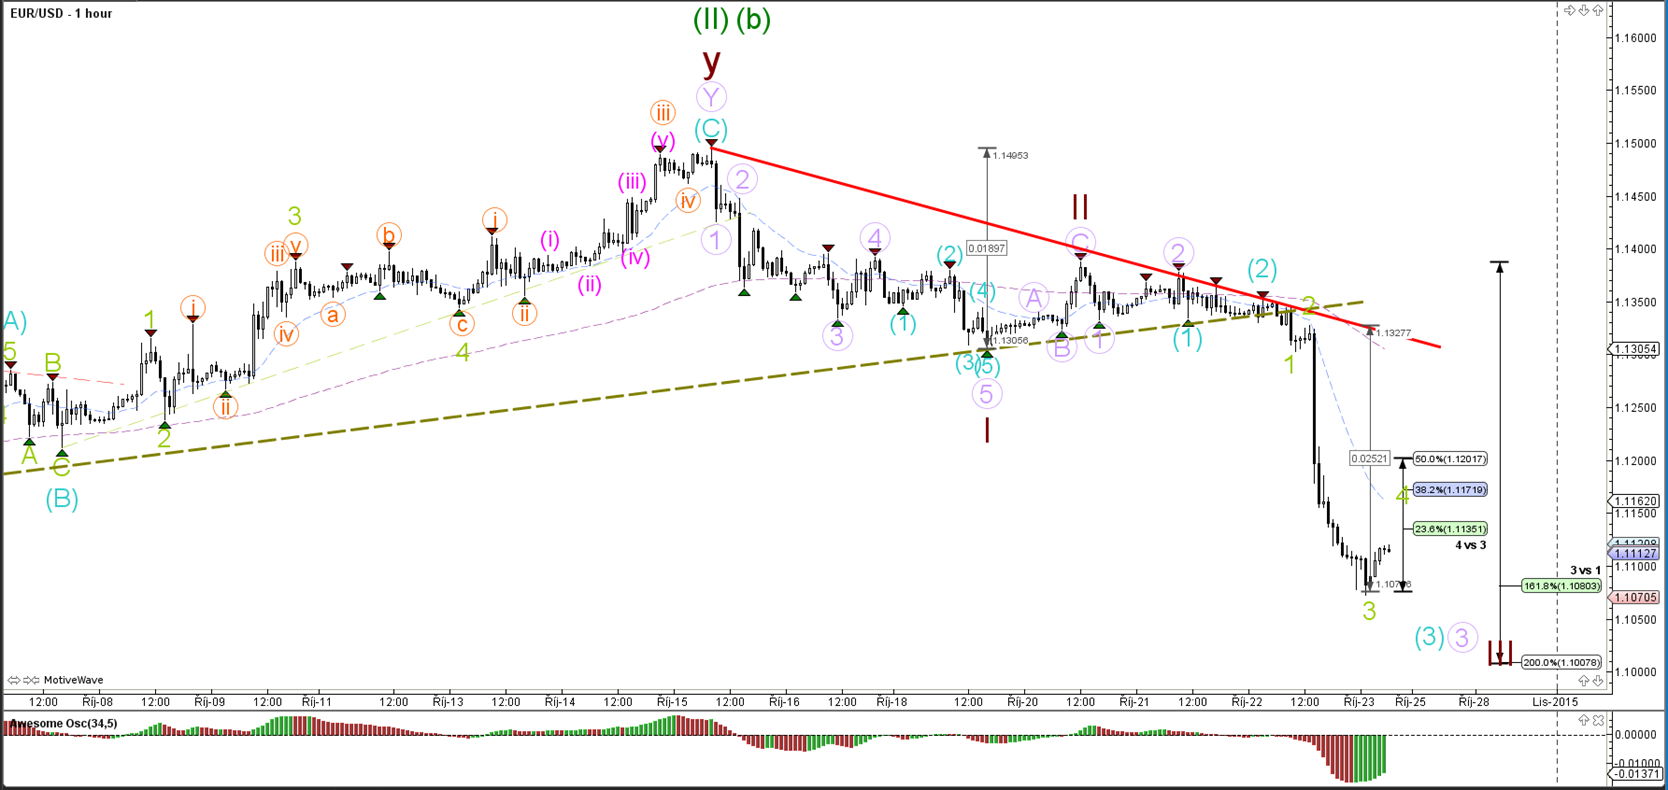
The wave 3 (dark red) has most likely not been completed and will see multiple continuations on lower time frames like the wave 3's mentioned in the 1 hour chart. Whether wave 3 (green) has been completed remains to be seen but a pullback for wave 4 (green) will most likely find resistance at the 23.6-38.2 (max 50) Fibonacci levels.

GBP/USD

4 hour


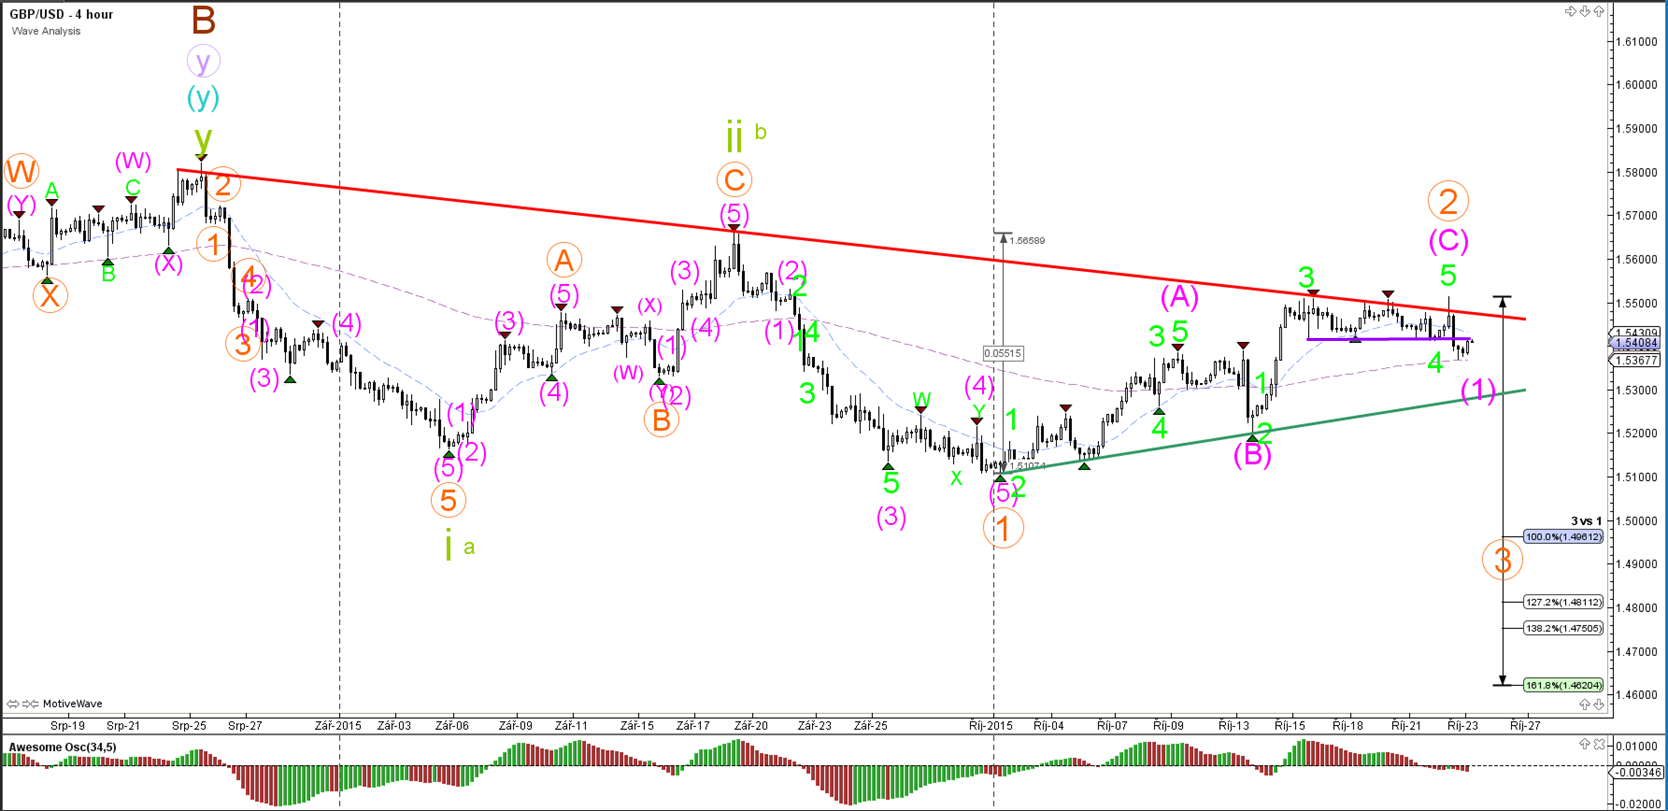
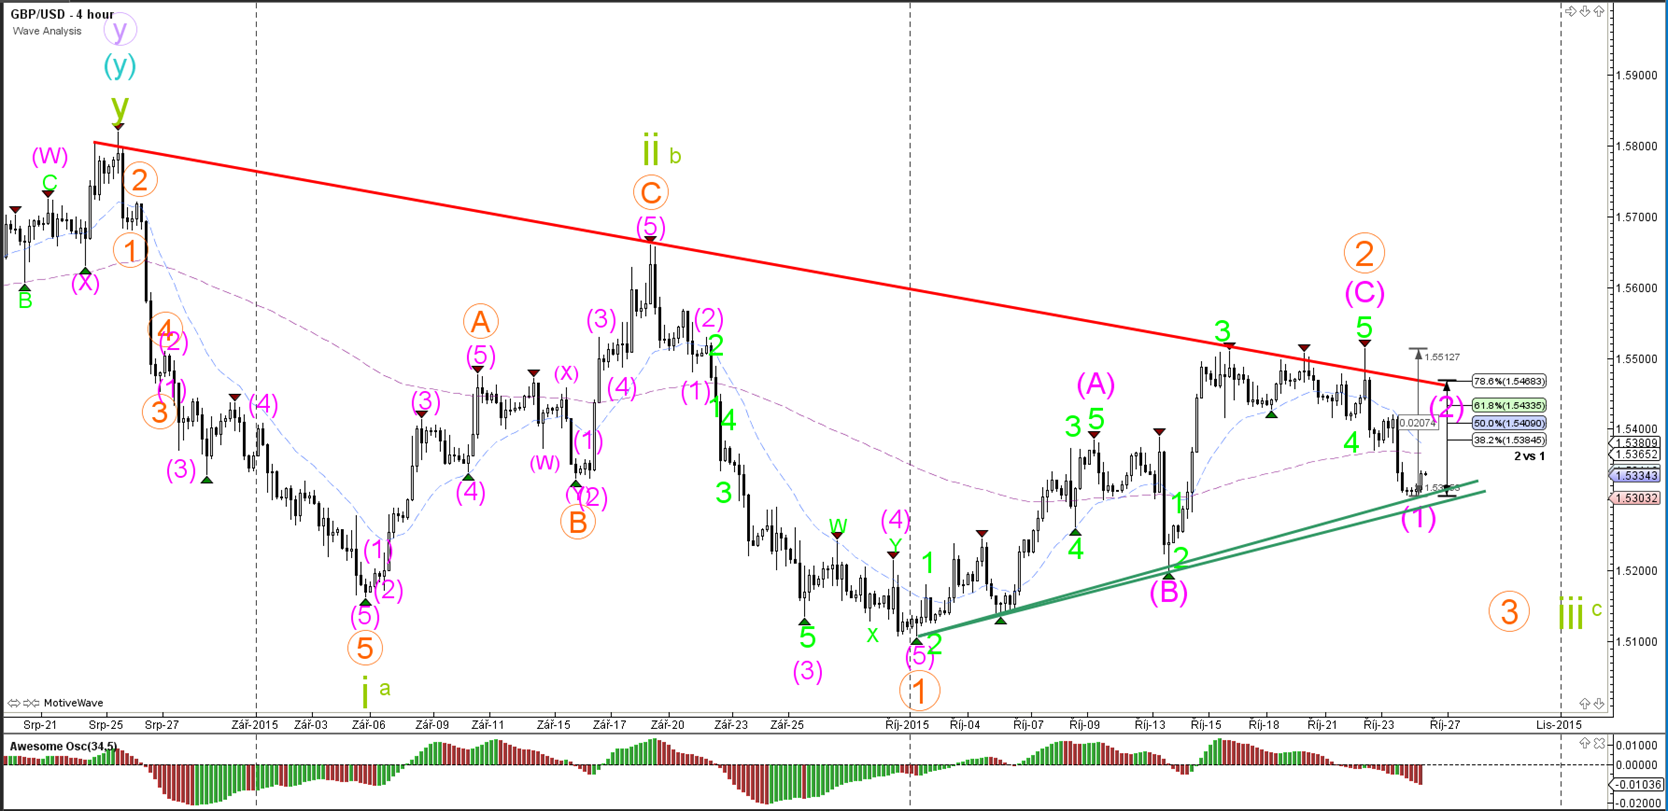
The GBP/USD broke below support (purple) after struggling at the resistance trend line (red) for quite a while. For the moment I have marked the wave 2 (orange) as completed and am anticipating a bearish turnaround on the GBPUSD.

1 hour


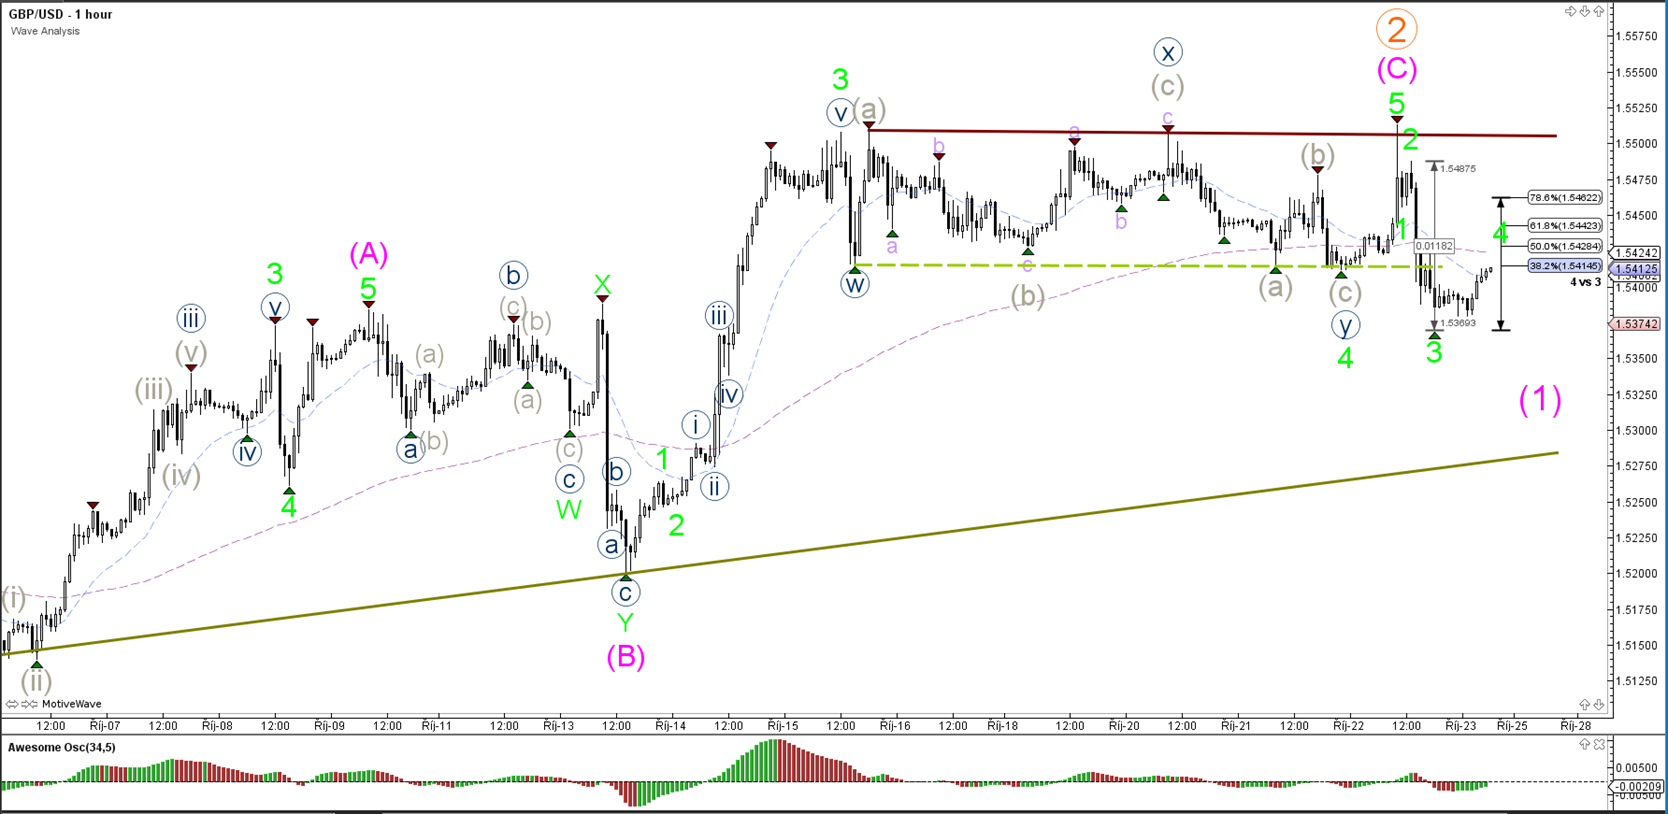
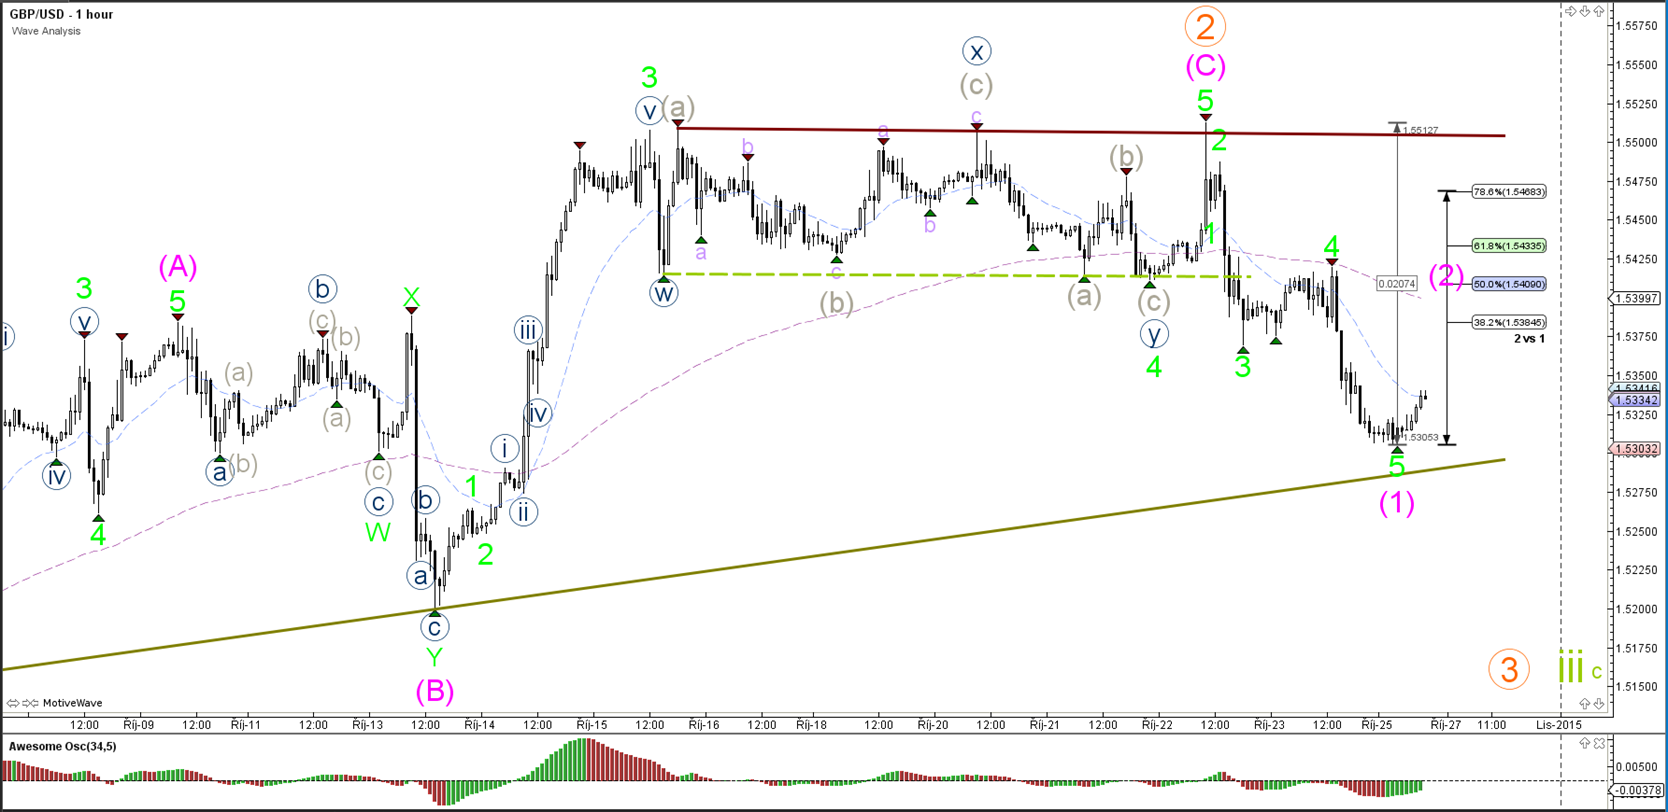
The GBP/USD could be building a bearish 5 wave (green) with price retracing for wave 4 and then following once more for wave 5. Price is still above the support level (green) which could be a level that supports the completion of a wave 1 (pink).

USD/JPY

4 hour


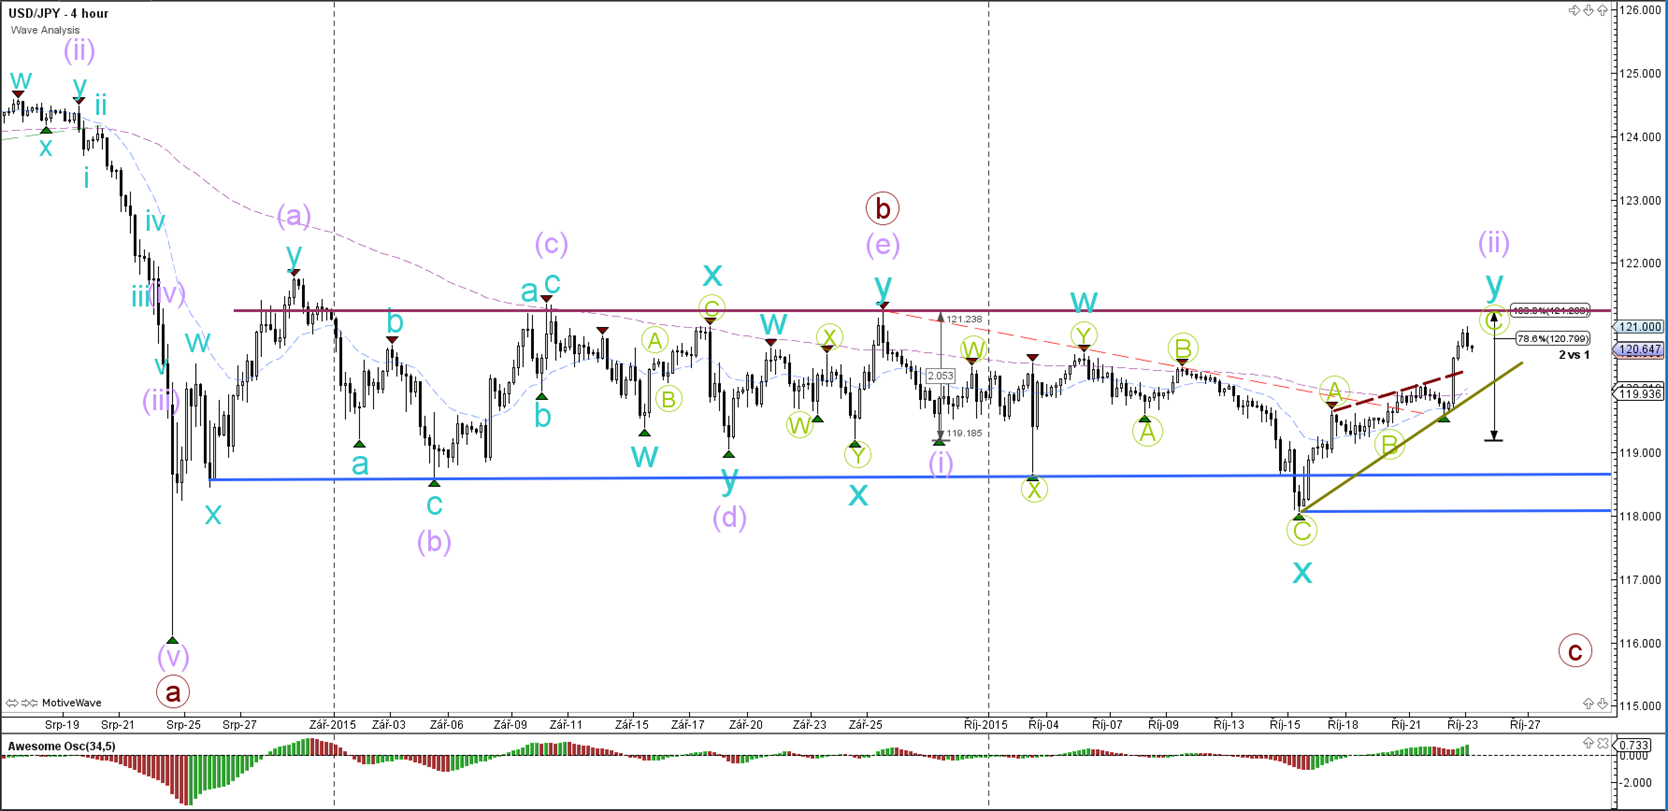
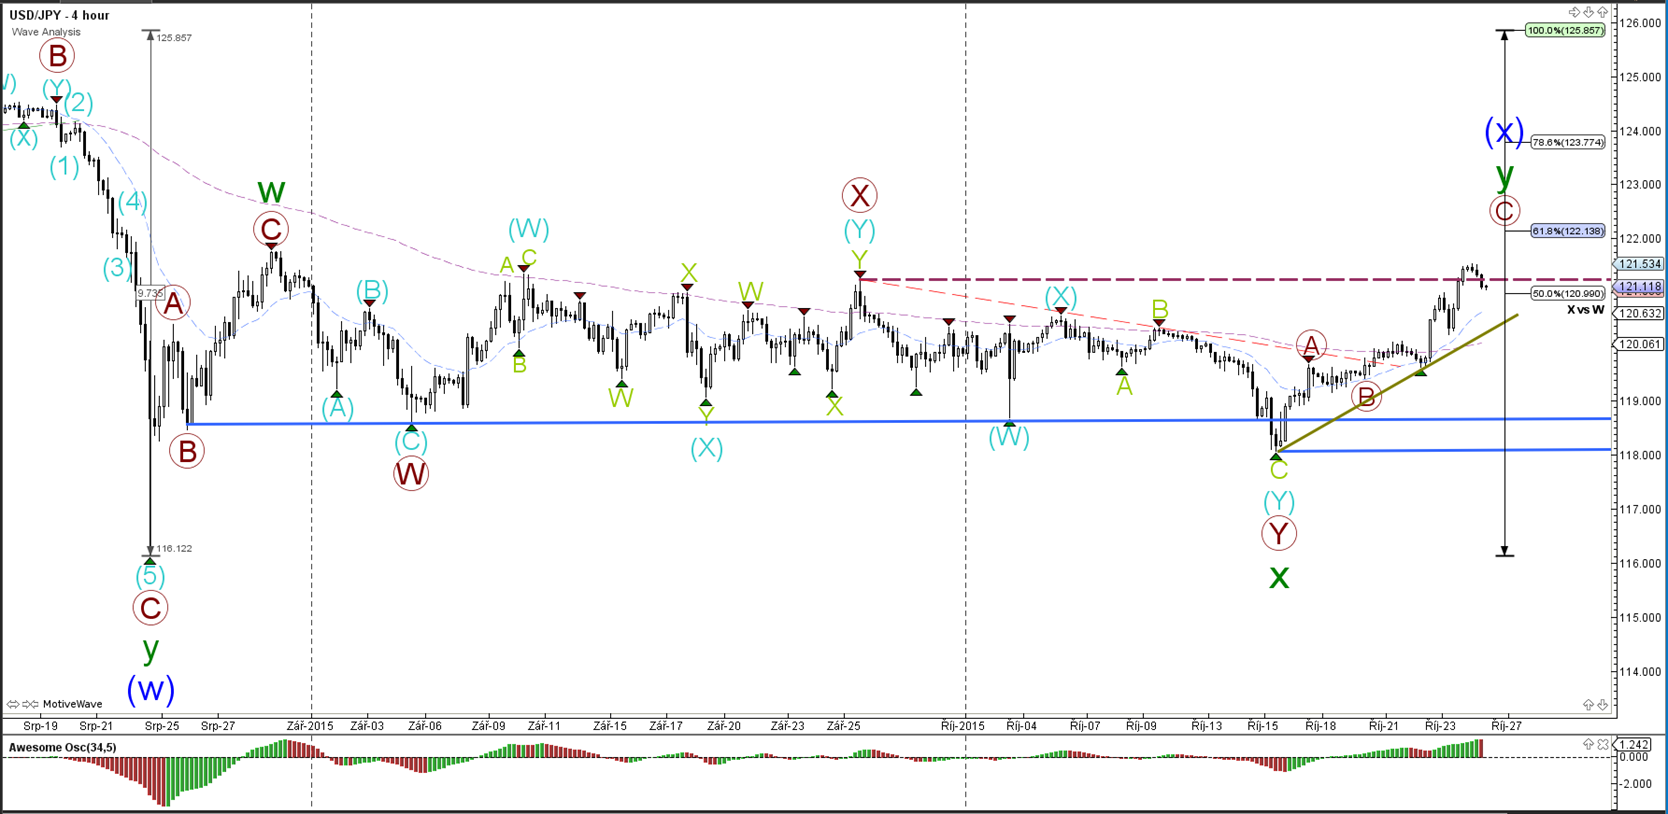
The USD/JPY is testing the top of the consolidation zoned (purple/blue) lines. The current wave 2 (purple) is invalided in case price is able to break above the resistance (purple) and origin of wave 1 (100% Fib). At the moment price could still subscribe to the ABC zigzag formation (green).


“Original analysis is provided by Admiral Markets
 
US Dollar Gains Solid Bullish Momentum

EUR/USD

4 hour


The EUR/USD has broken below the various support levels of the 4 hour chart which indicates the start of a wave 3 or wave C (green). Whether price is in a wave 3 or C will depend on how far price can drop, which will be impacted by the FOMC statement this week.

1 hour


The EUR/USD fell once more last week and has now probably completed wave 3 (blue). Waves 4 typically retrace back to the wave 4 of one degree lower (green).

GBP/USD

4 hour


The GBP/USD price action is caught in a contracting triangle in between support (green) and resistance (red) trend lines. A break of the resistance invalidates the bearish wave count whereas a break of support increases the chance of a wave 3 (orange/green) starting.

1 hour


The GBP/USD seems to have completed the bearish 5 wave (green) to complete wave 1 (pink) at the support trend line (green). A wave 2 retracement could potentially retest a deep Fibonacci level.

USD/JPY

4 hour


The USD/JPY broke the previous top (dotted trend line) and thereby changed its wave structure to a wave X (blue) with Fibonacci resistance levels mentioned in the chart. Price has to break the 100% level to invalidate the wave X (blue) and increase the chances of a bigger daily/weekly uptrend continuation.


“Original analysis is provided by Admiral Markets
 
EUR/USD & GBP/USD Building Bear Flag and ABC Correction

EUR/USD


4 hour


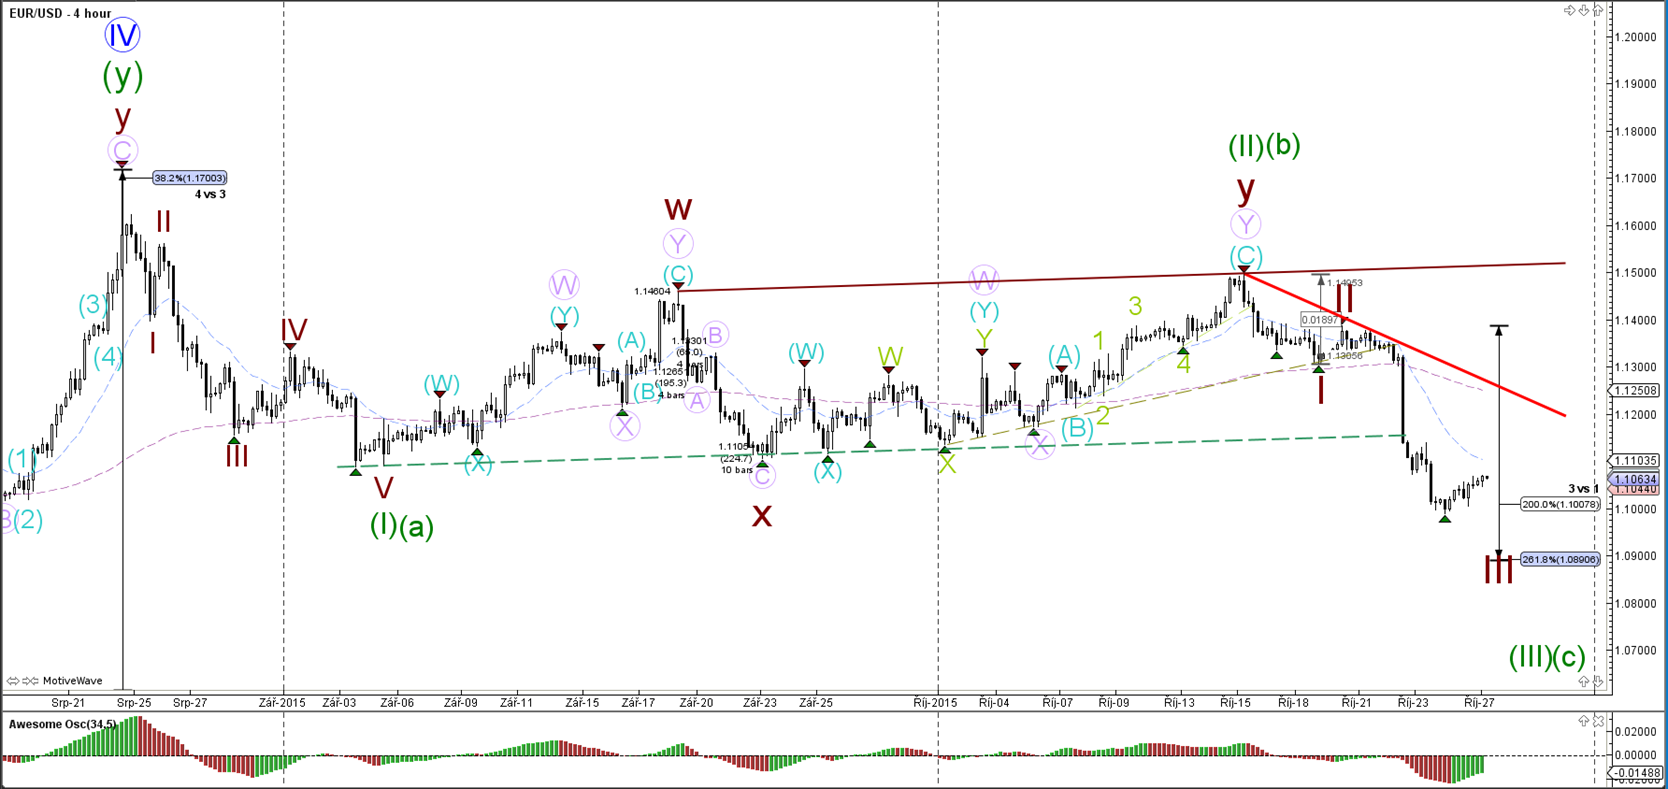
The EUR/USD has space to fall further within waves 3 (green/brown) but the momentum will depend on the FOMC rate decision and statement this week.

1 hour


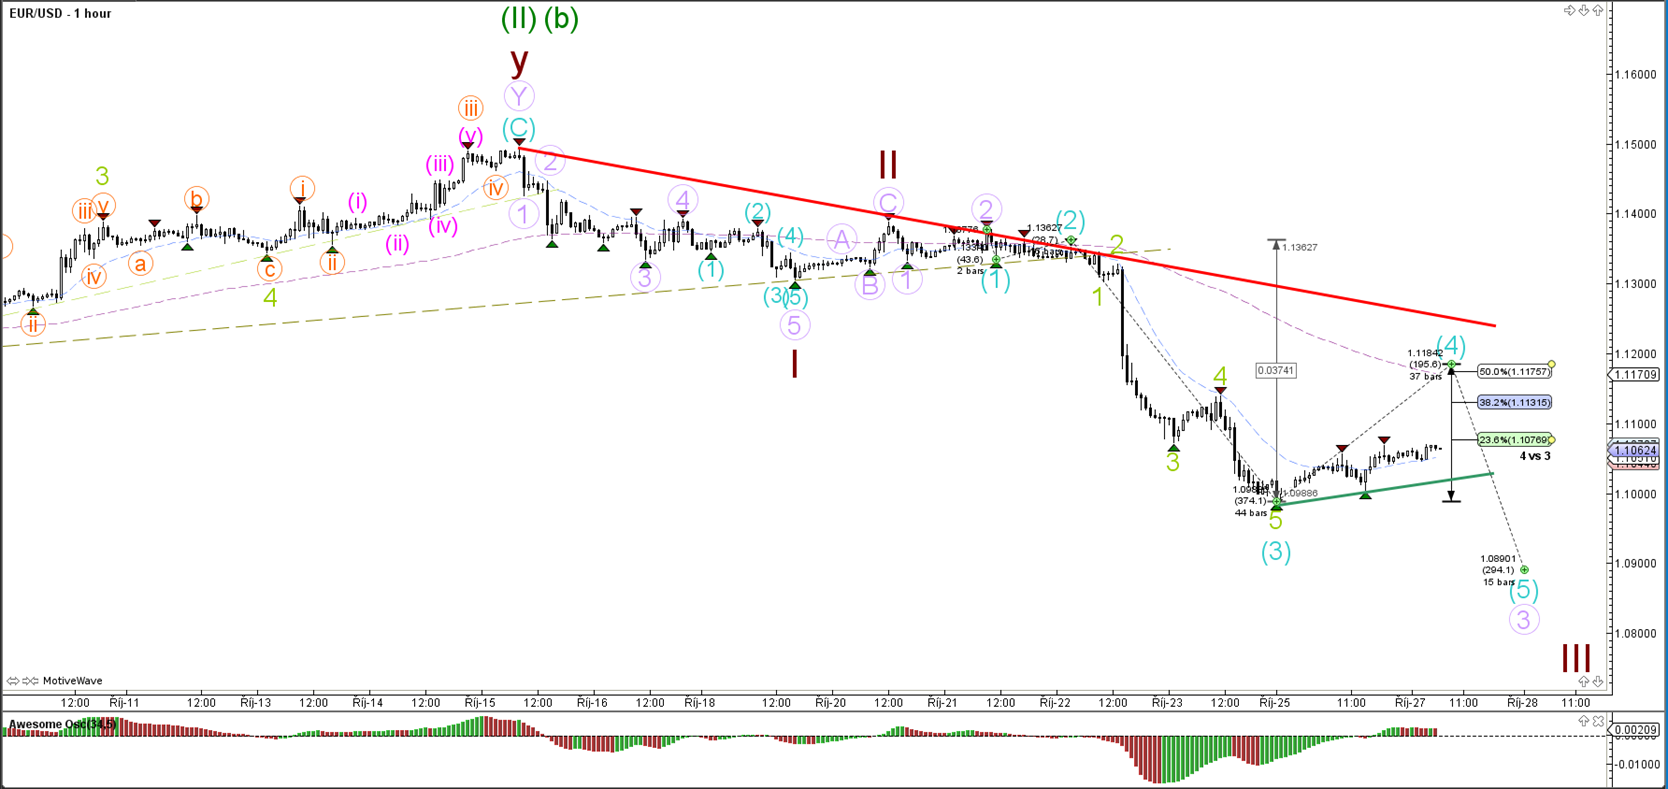
The EUR/USD is probably in a wave 4 bear flag formation (bottom is geen line) and could head lower again at the wave 4 Fibonacci levels. A break above the 50% Fibonacci retracement level and the resistance trend line (red) would invalidate the wave structure. A break below the trend line (green) could confirm the start of wave 5 (blue).

GBP/USD

4 hour


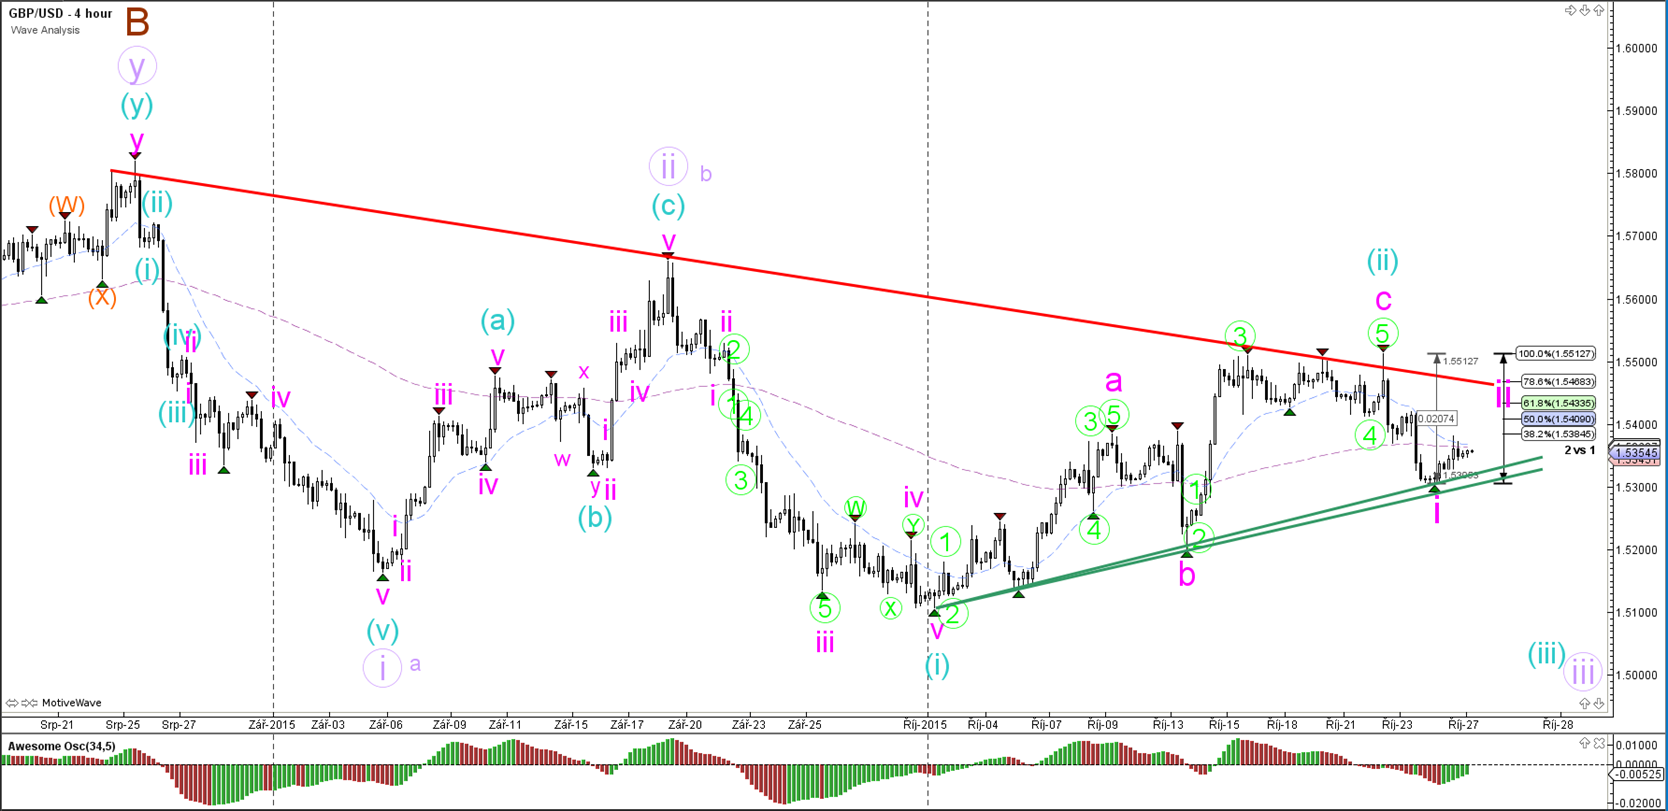
The GBP/USD price action is caught in a contracting triangle in between support (green) and resistance (red) trend lines. A break of the resistance invalidates the bearish wave count whereas a break of support increases the chance of a wave 3 (orange/green) starting.

1 hour


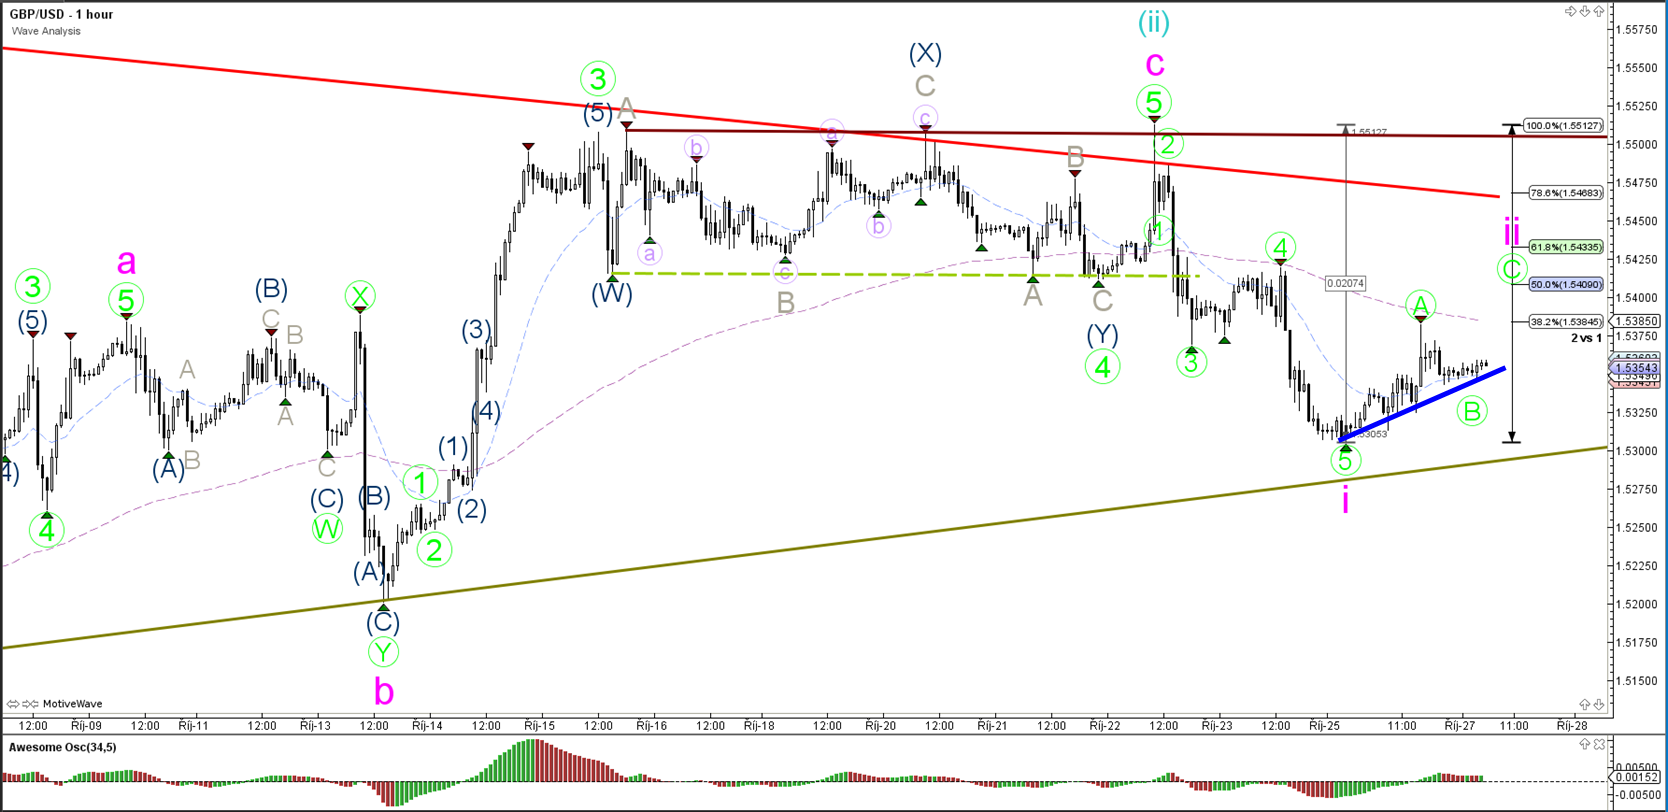
The GBP/USD made a bullish push up yesterday at support (green) after completing wave 1 (pink), which could be a wave A (green) of a bigger ABC zigzag in wave 2 (pink). The 100% level is the invalidation mark.

USD/JPY

4 hour


The USD/JPY has reached the top of the sideways zone which could act as a resistance area and price could correct lower because of it. Price has to break the 100% level to invalidate the wave X (blue) and increase the chance of a bigger daily/weekly uptrend continuation.


“Original analysis is provided by Admiral Markets
 
Back
Top