Admiral Markets
AdmiralMarkets.com Representative
- Messages
- 95
Forex Market Holding its Breath for FOMC Statement
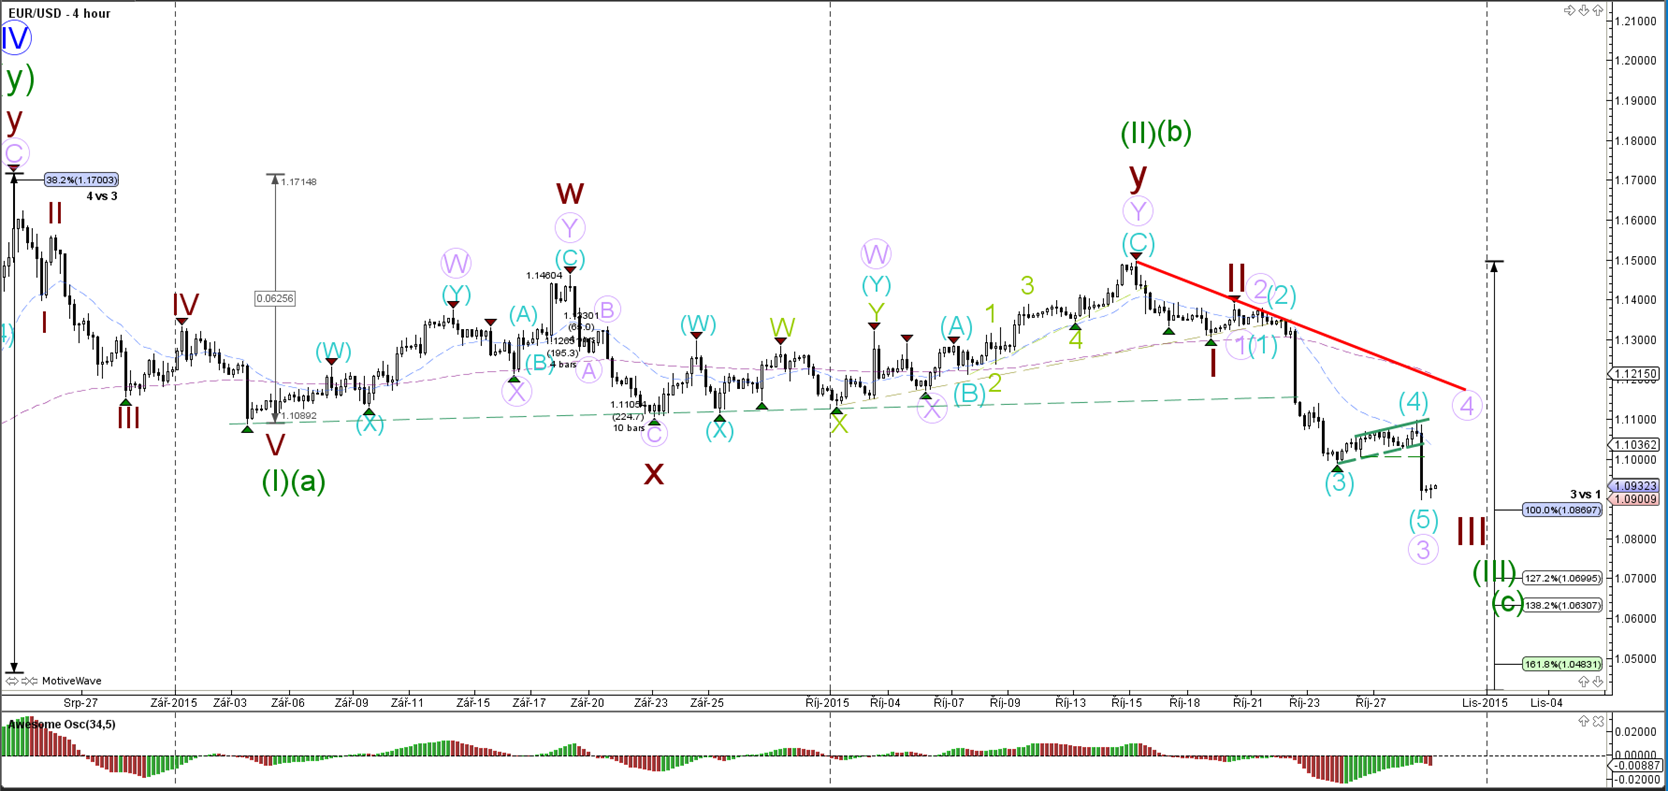
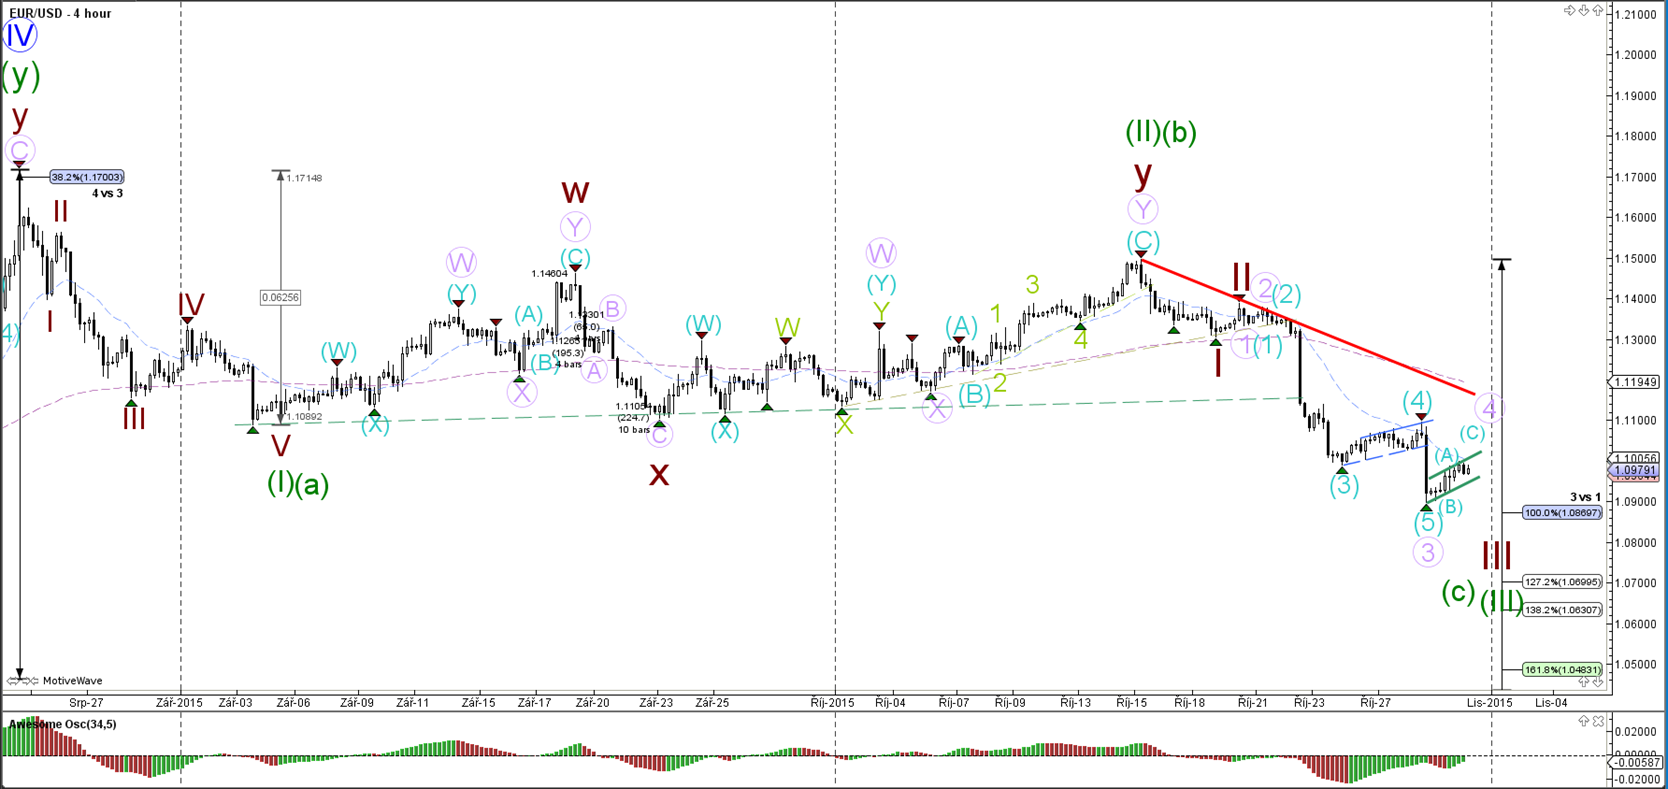
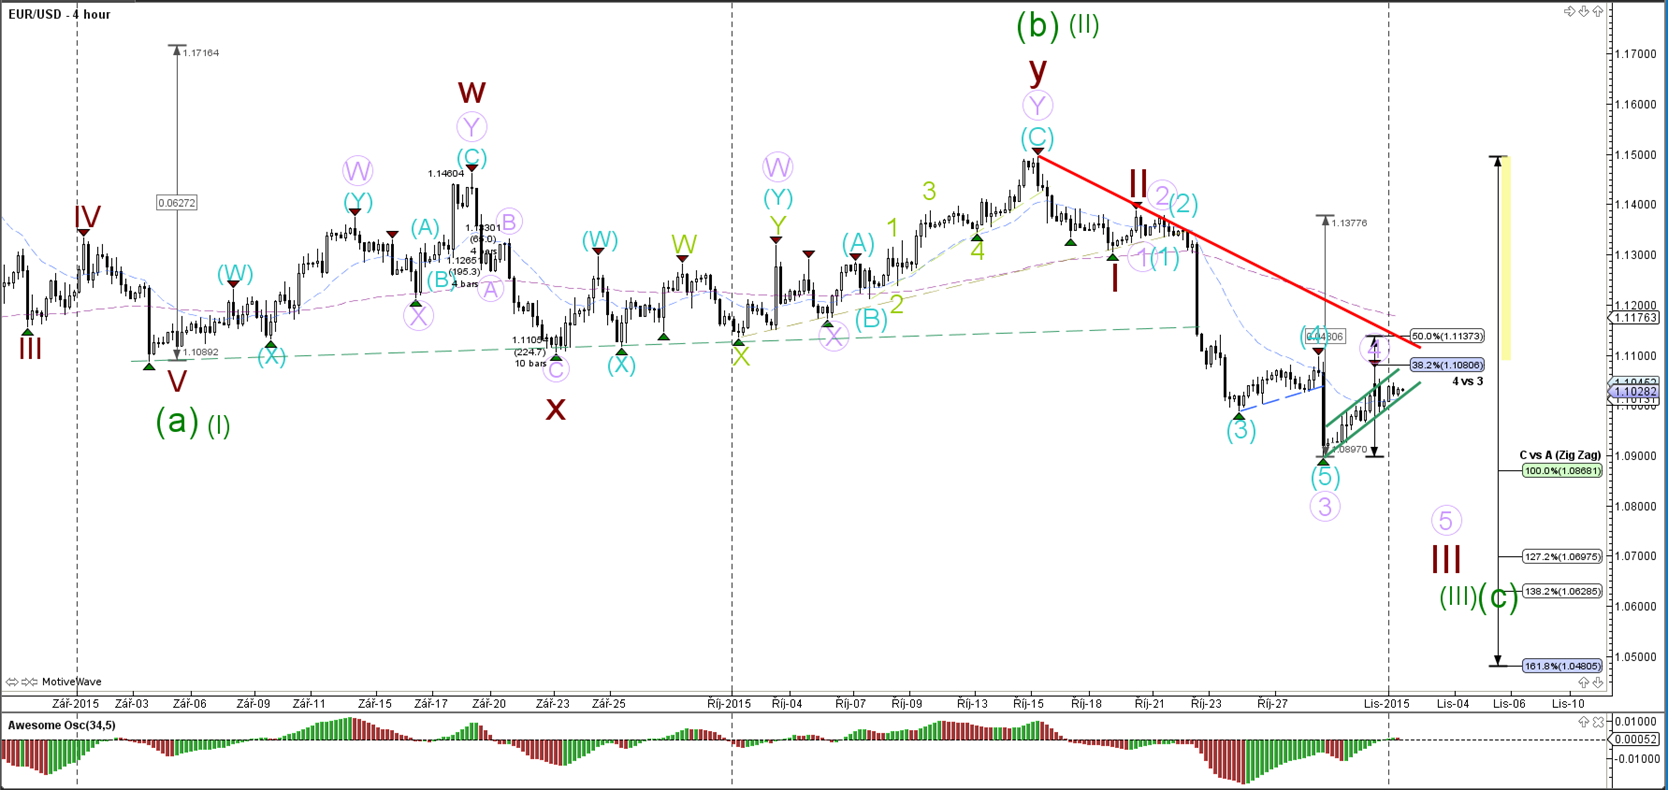
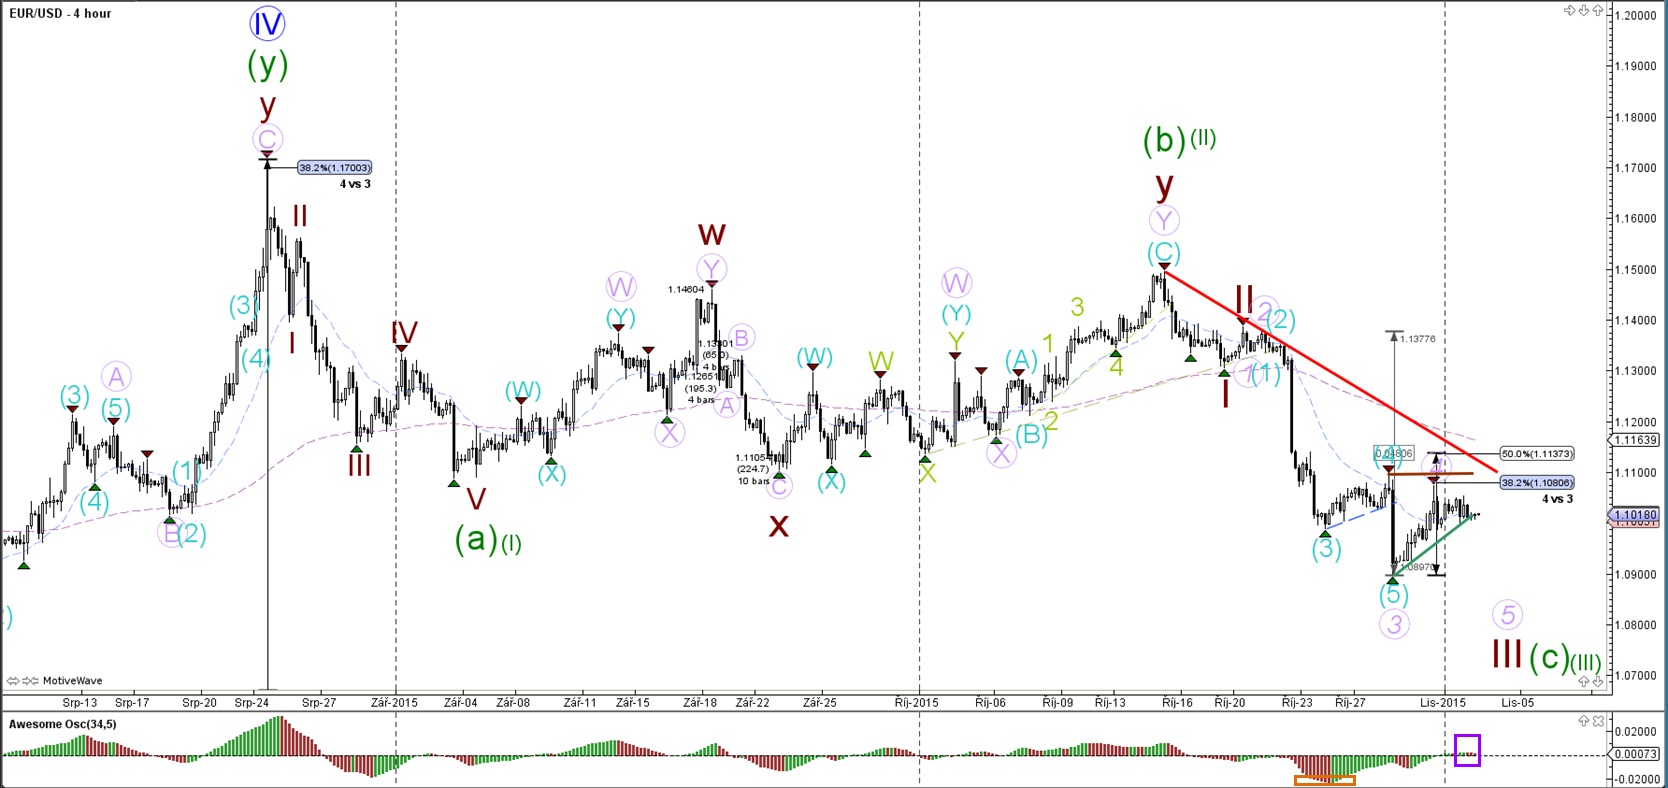
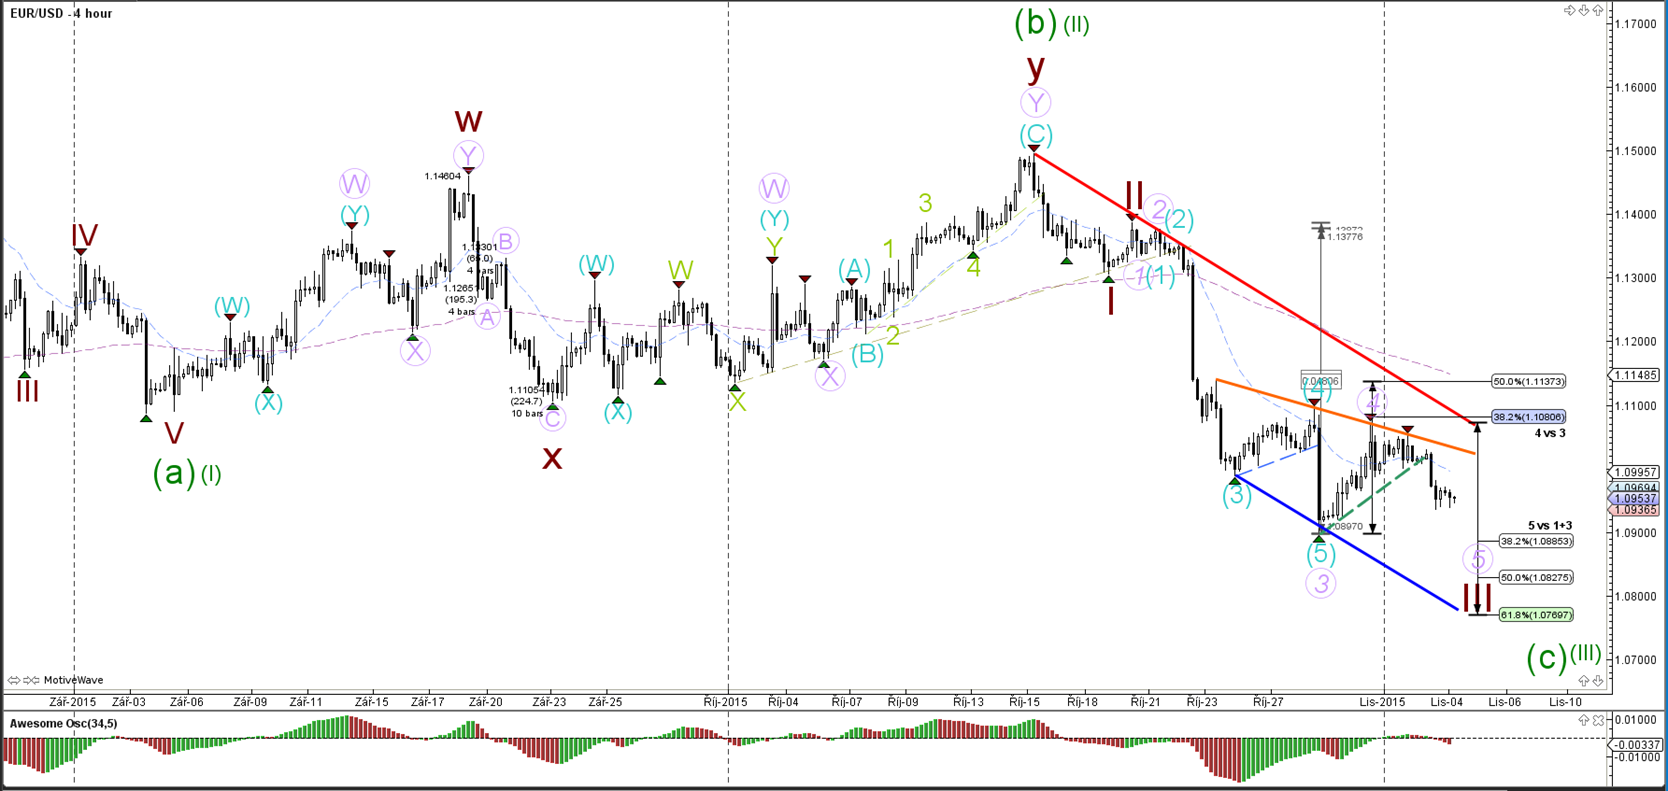
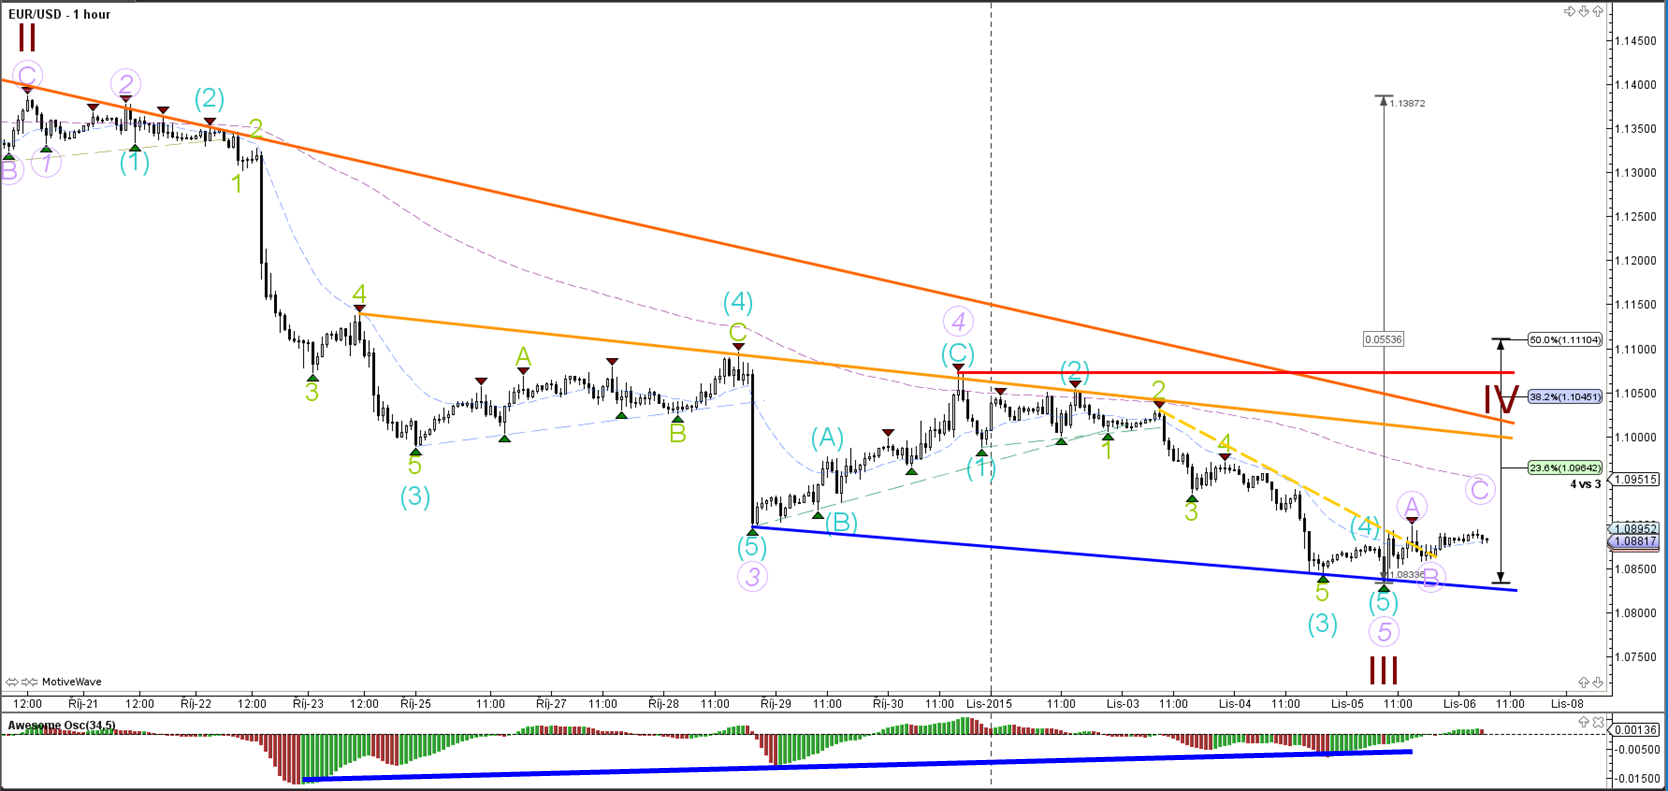
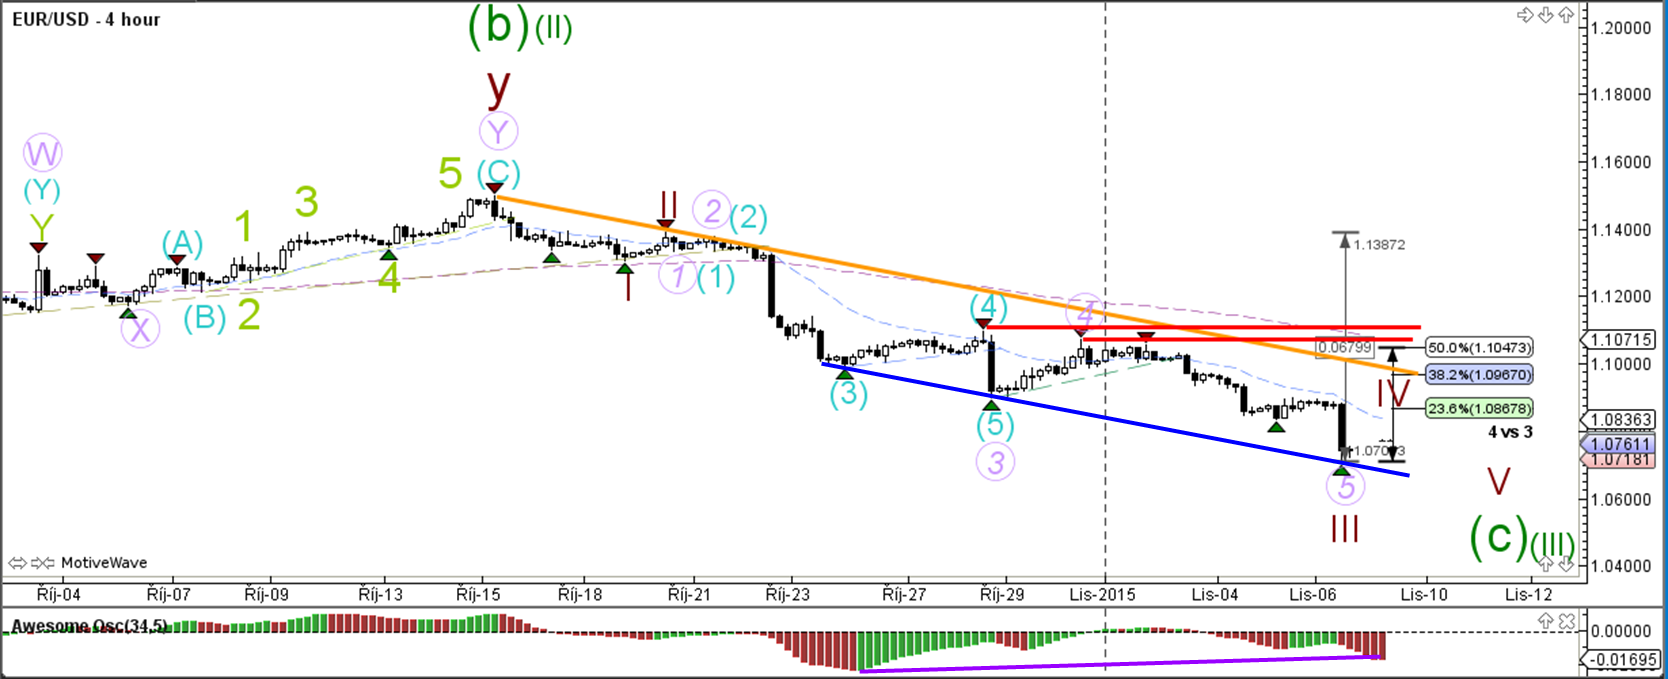
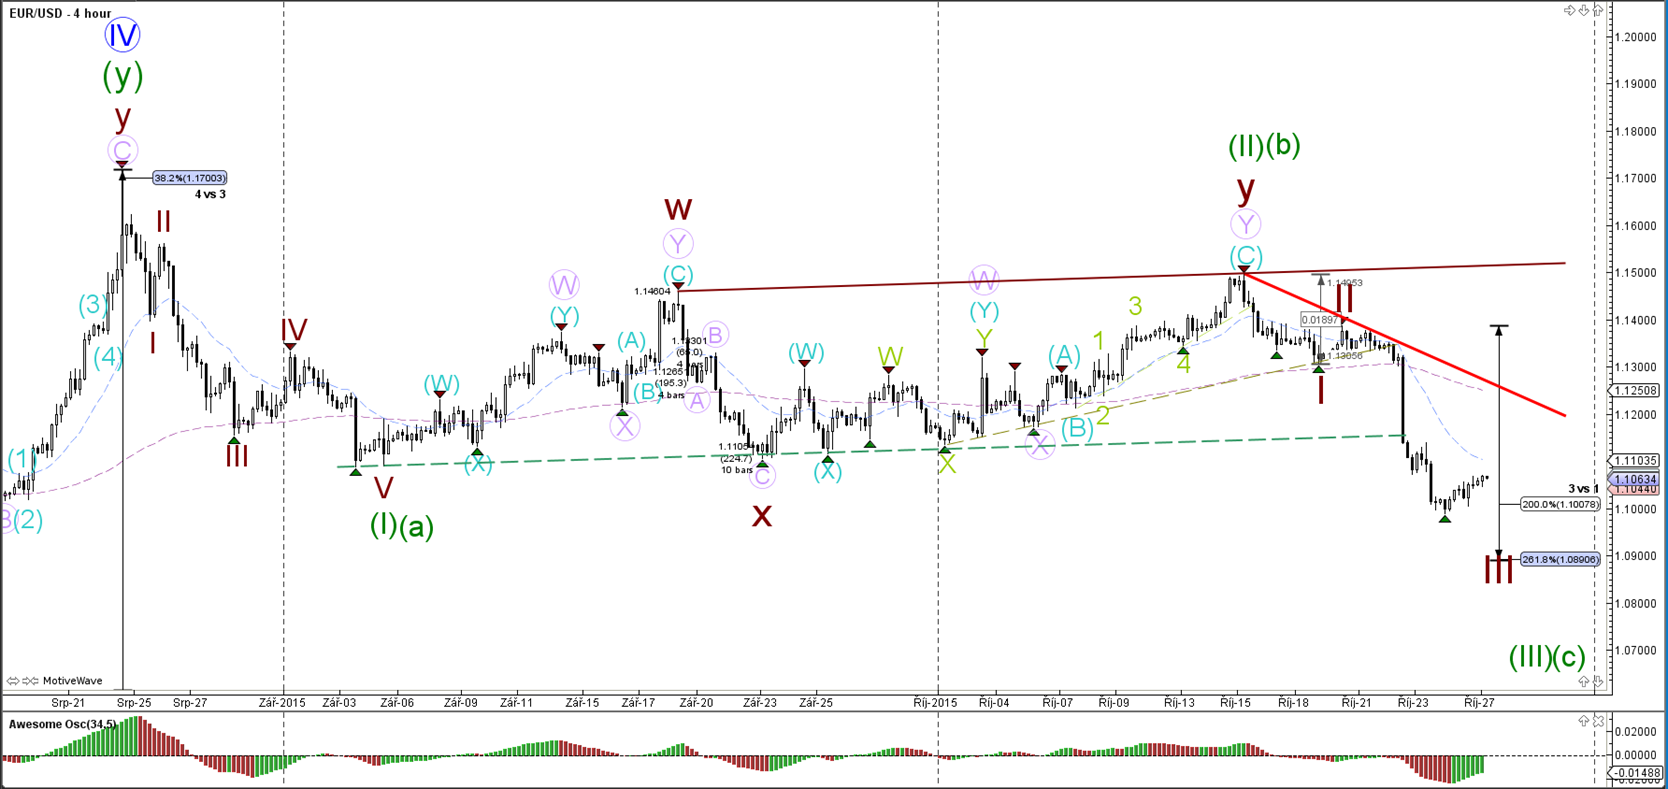
EUR/USD
4 hour

The EUR/USD will be heavily impacted by the FOMC rate decision and statement later today. A EUR/USD break above resistance (red) invalidates the current wave structure, whereas a break below support (green) could see price continue with its downtrend.
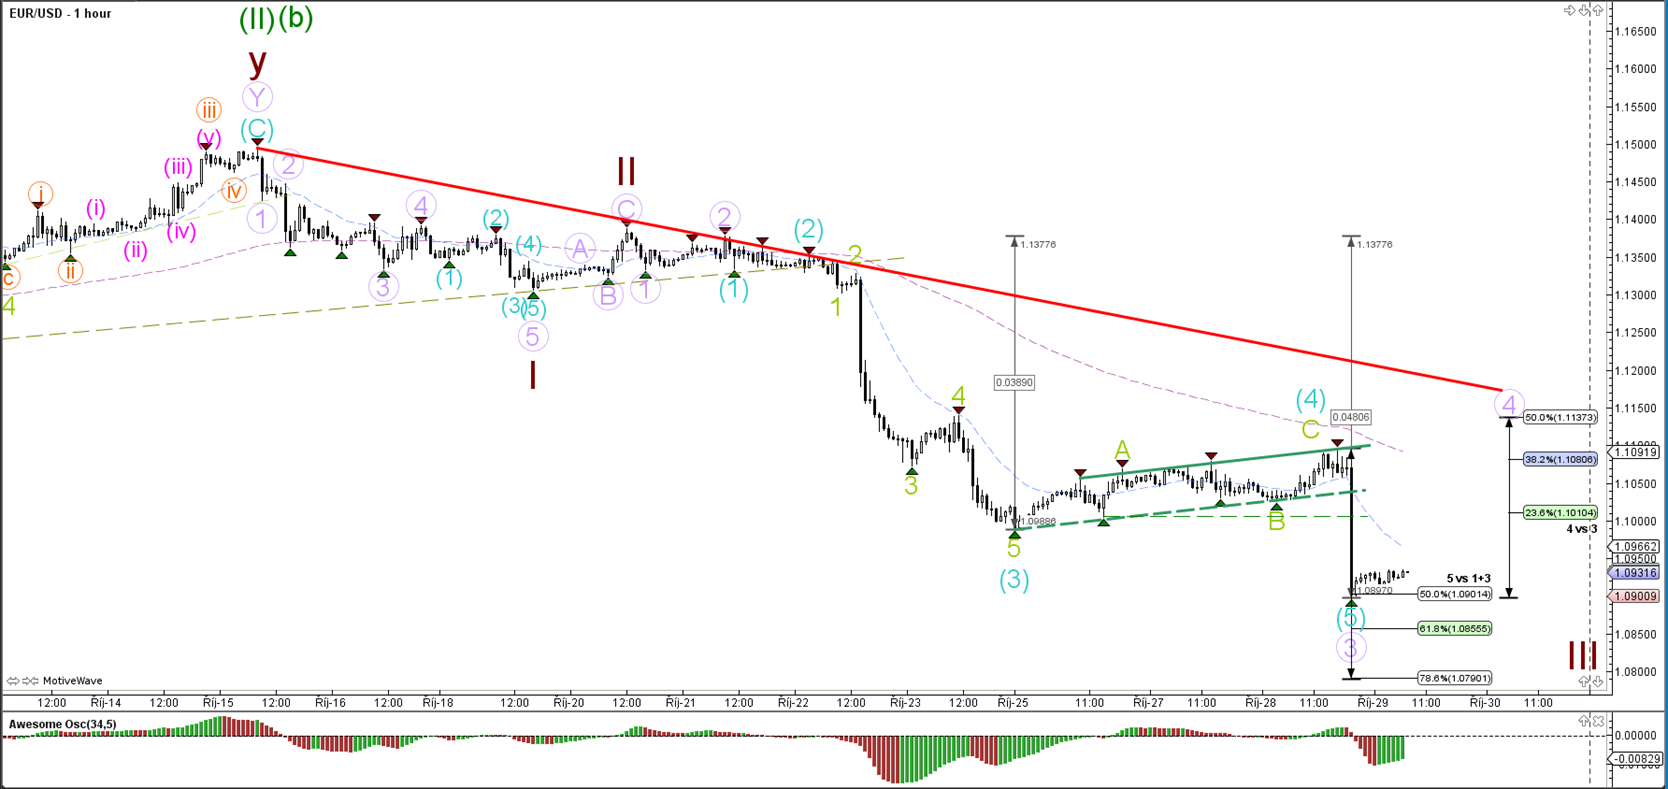
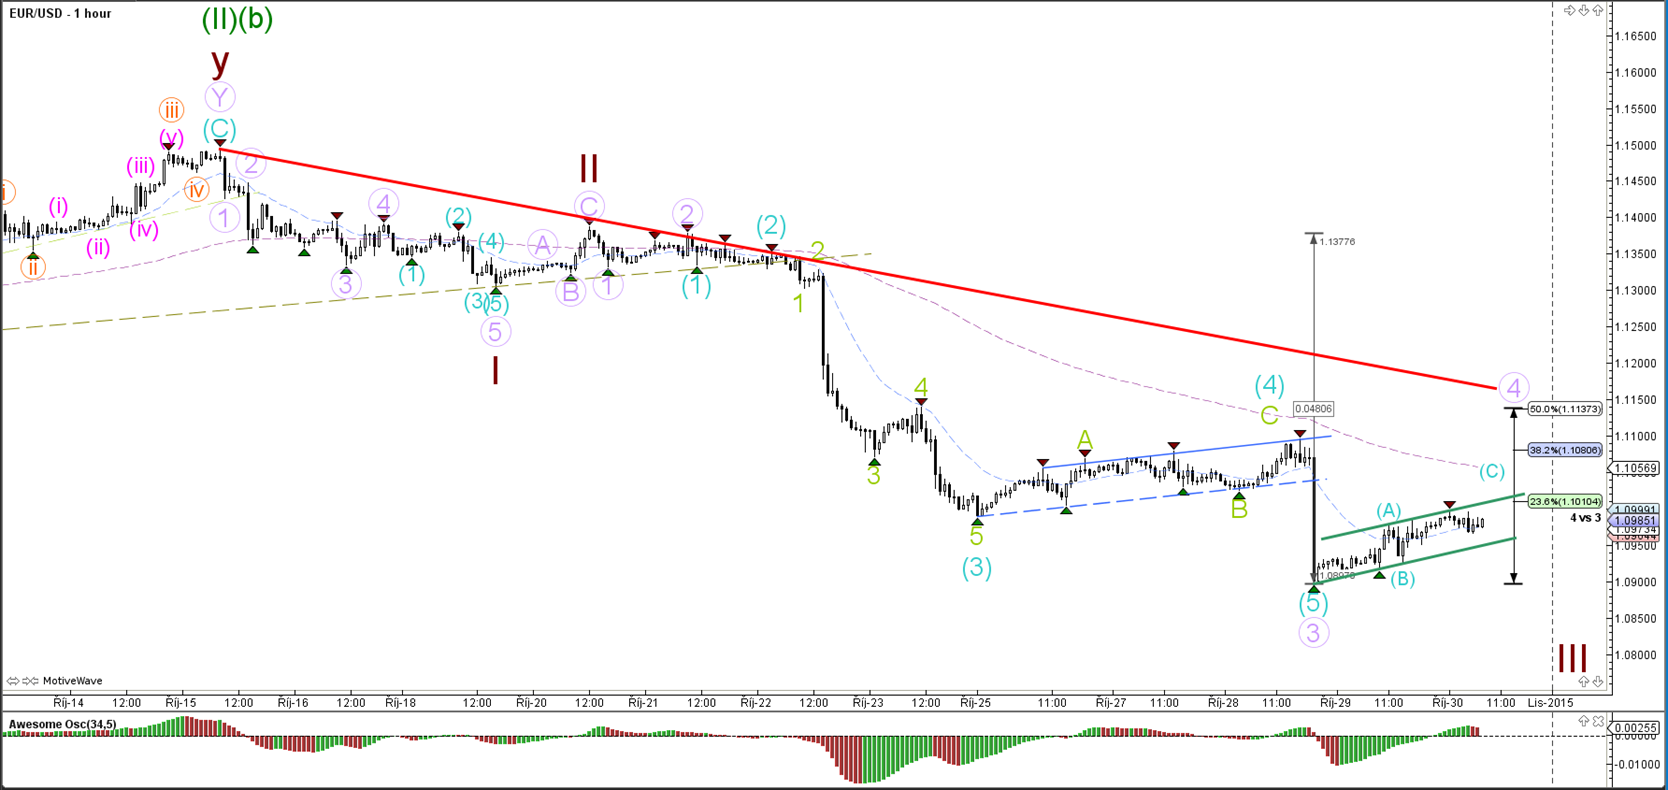
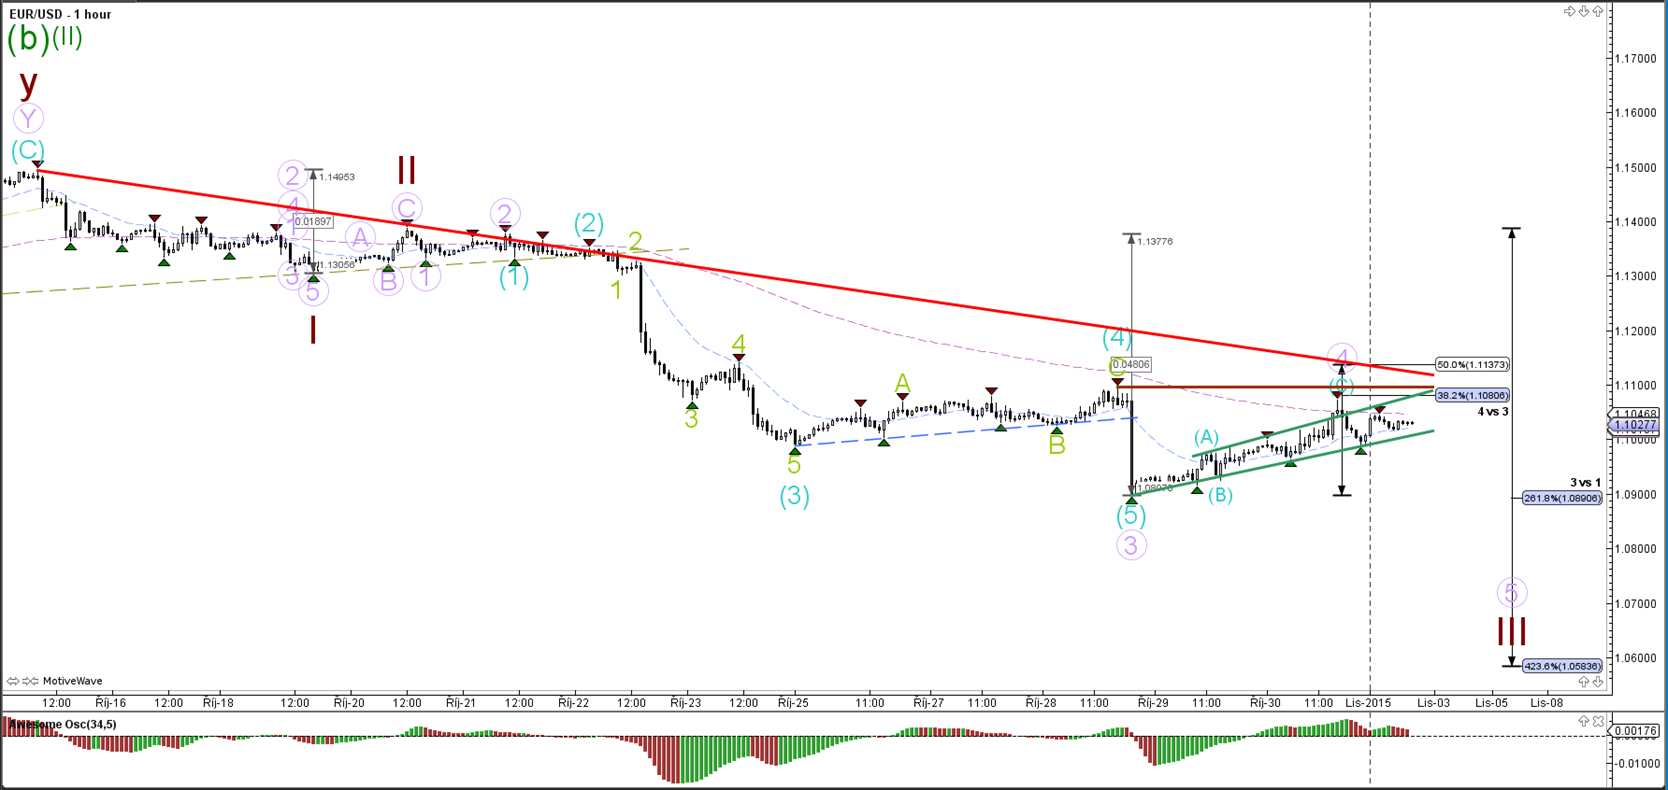
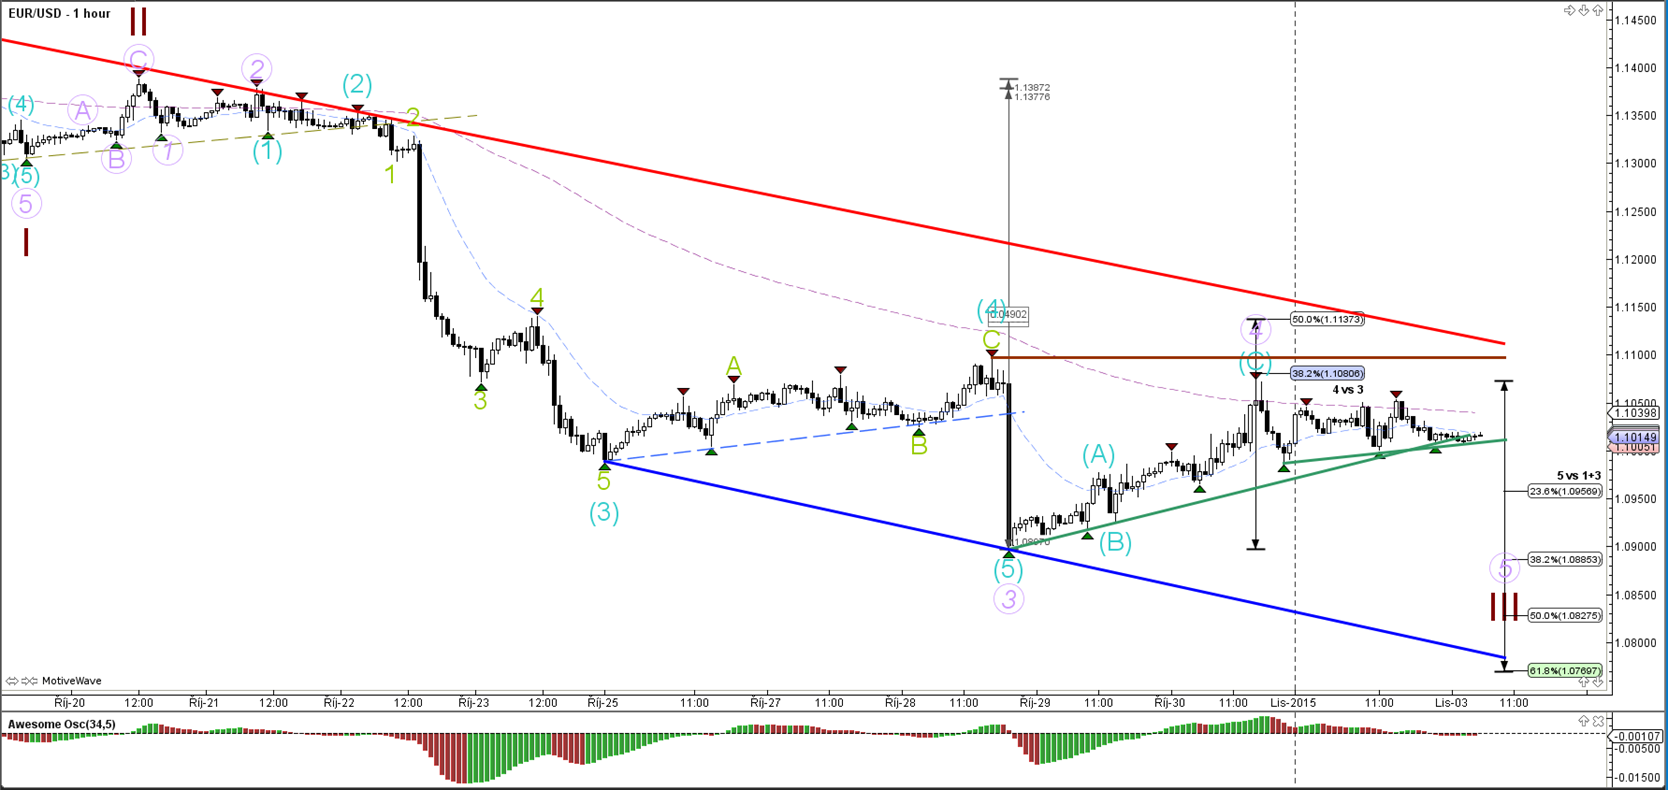
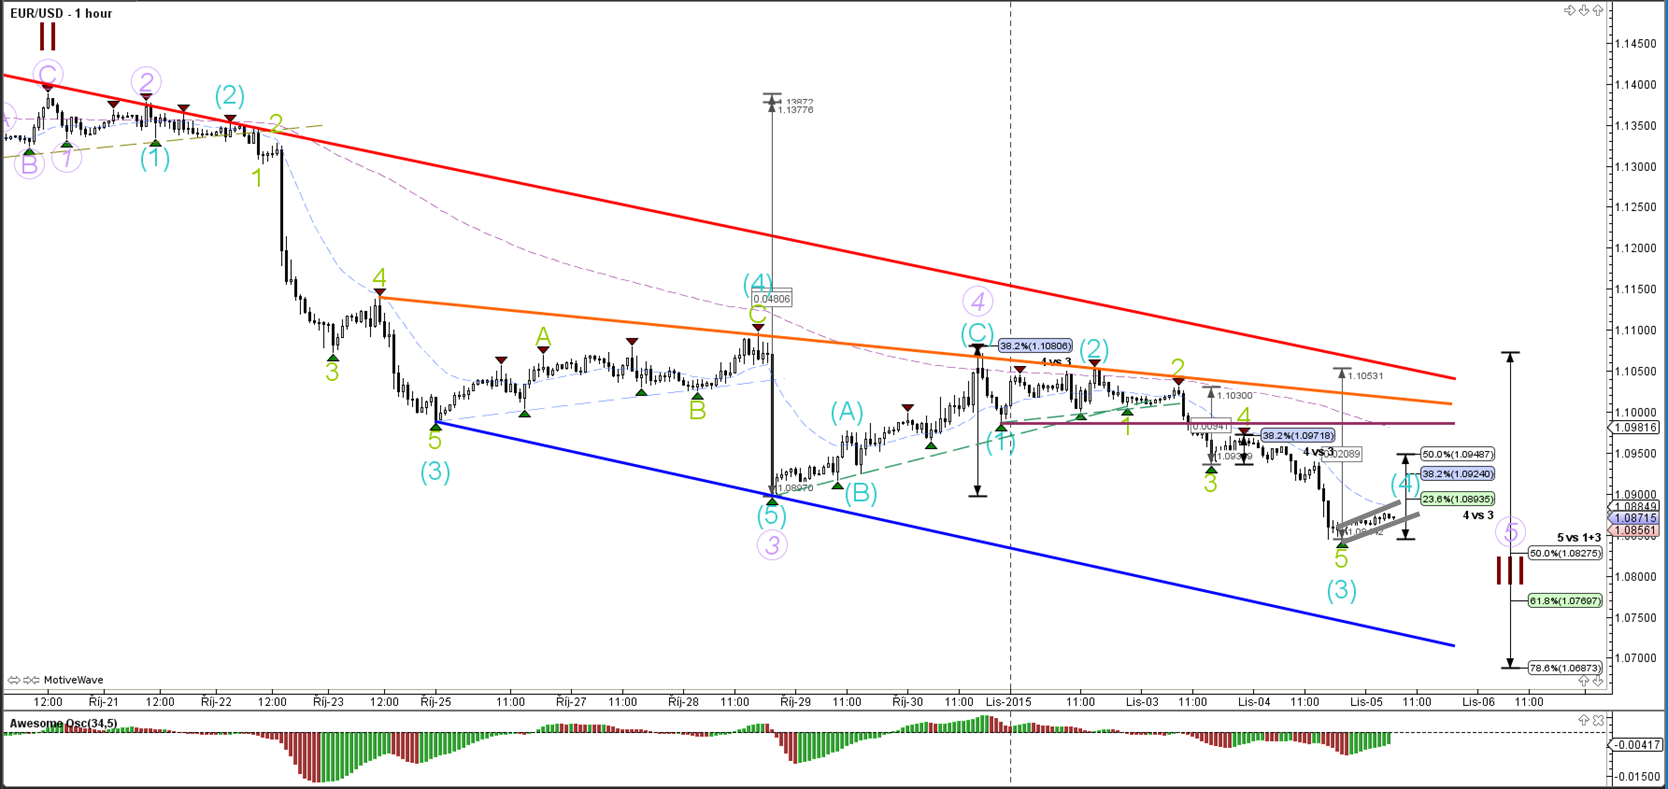
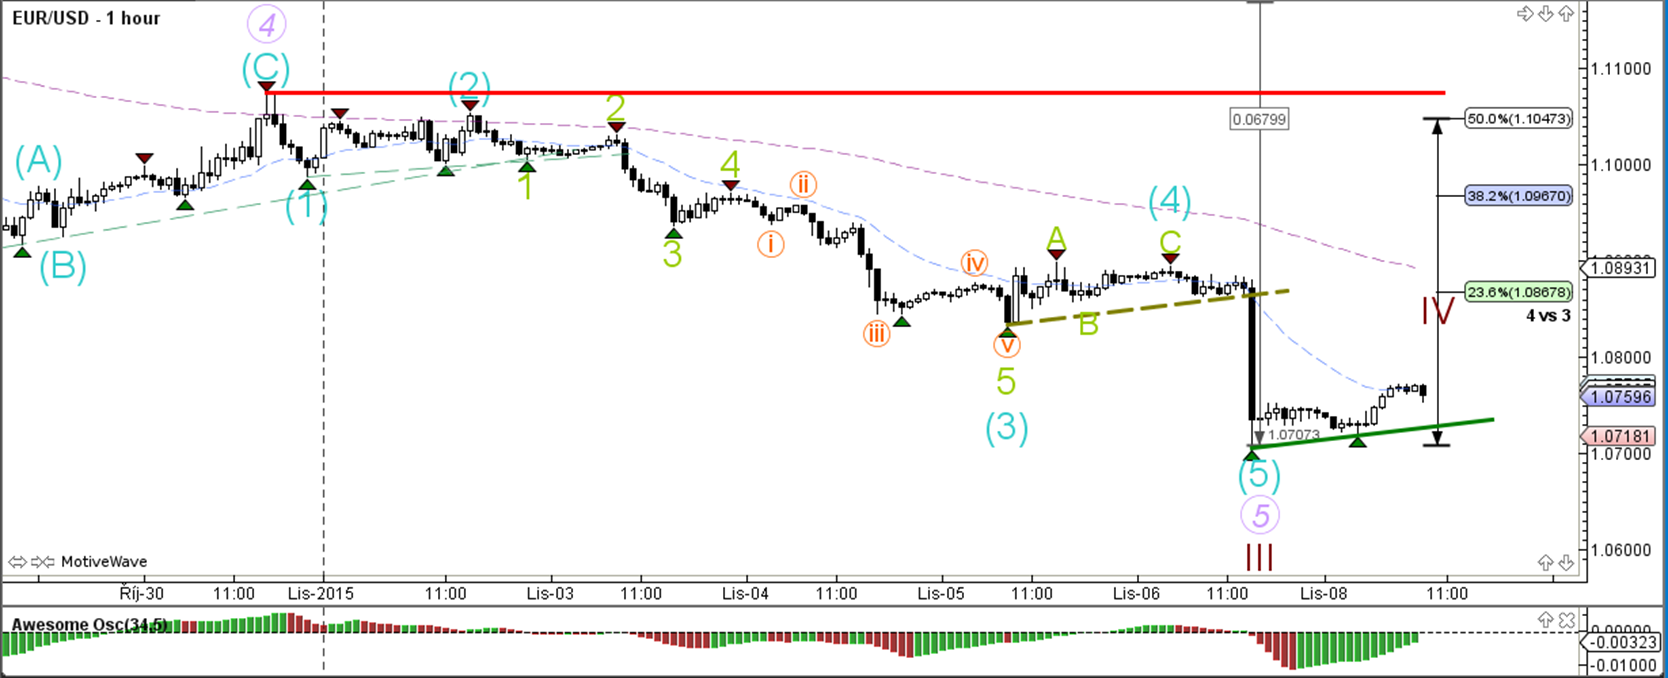
1 hour
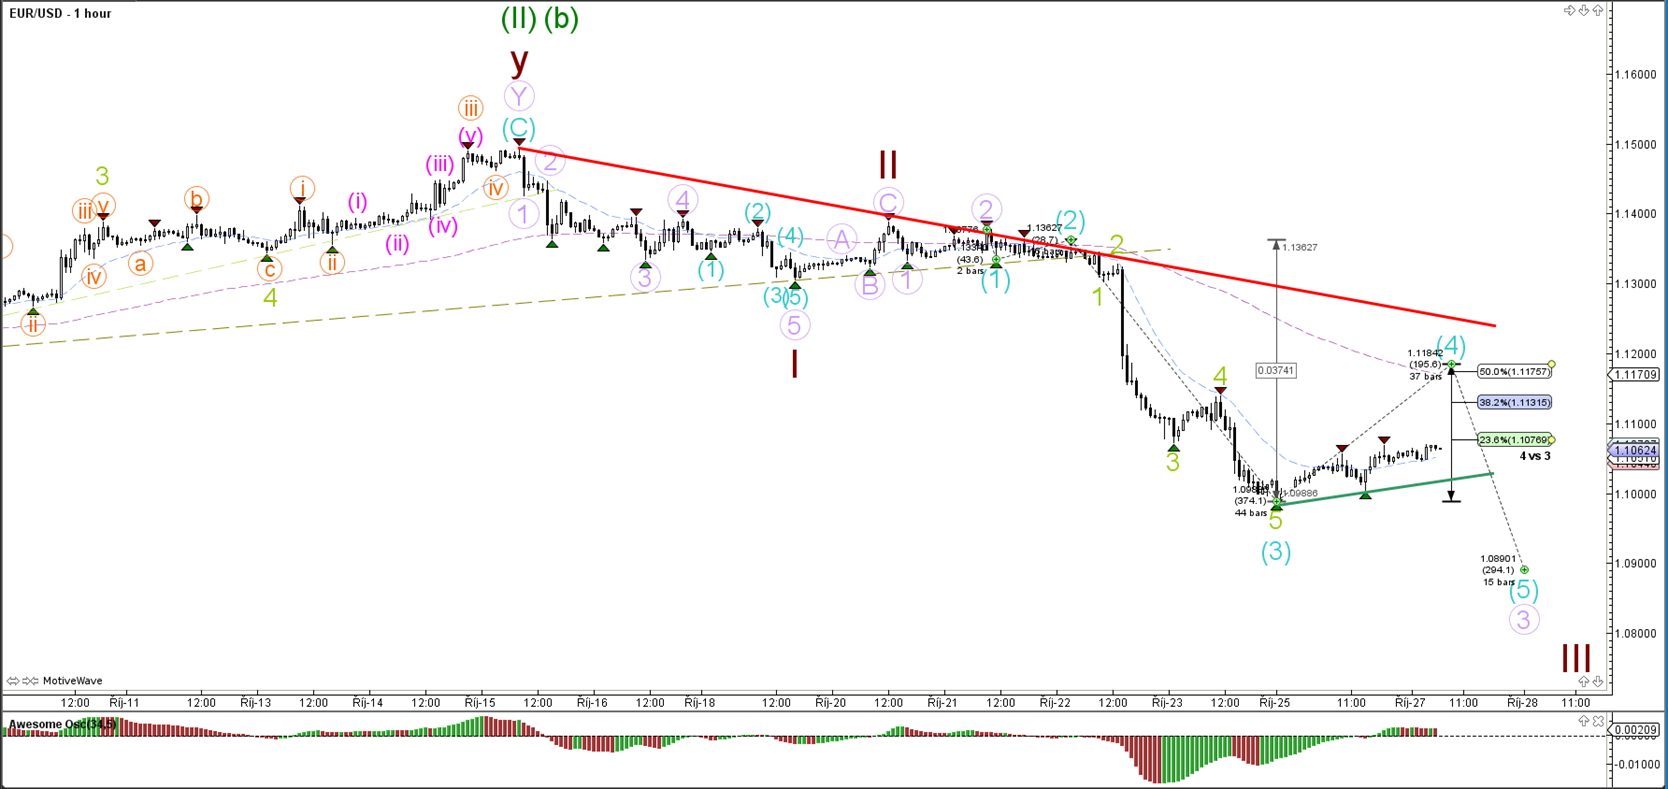
The EUR/USD is probably in a wave 4 bear flag formation (bottom is geen line) and could head lower at the wave 4 Fibonacci levels. A break above the 50% Fibonacci retracement level and the resistance trend line (red) would invalidate the wave structure. A break below the trend line (green) could confirm the start of wave 5 (blue).
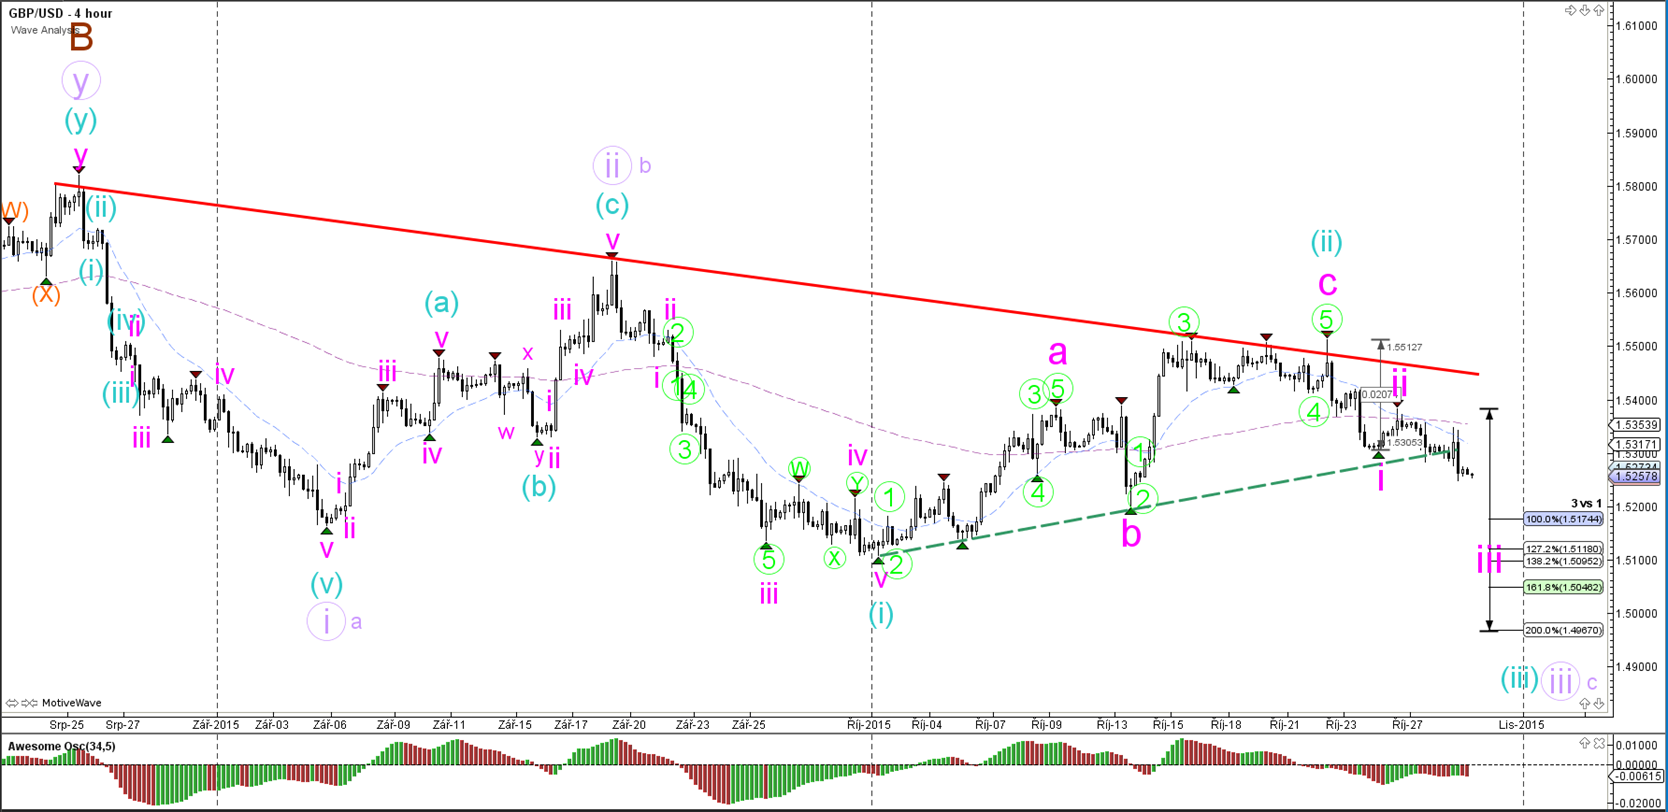
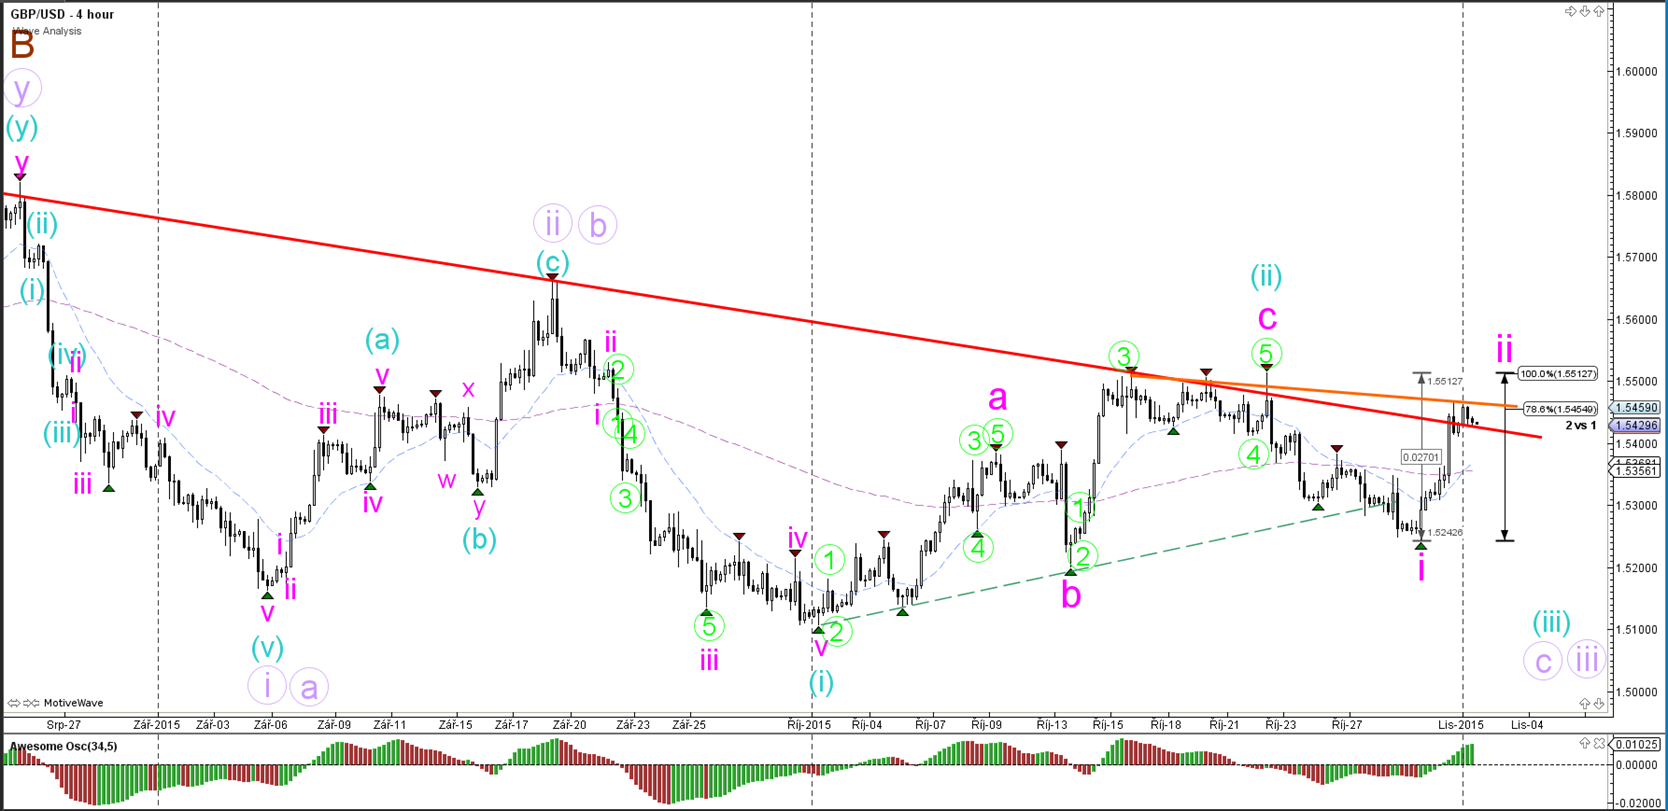
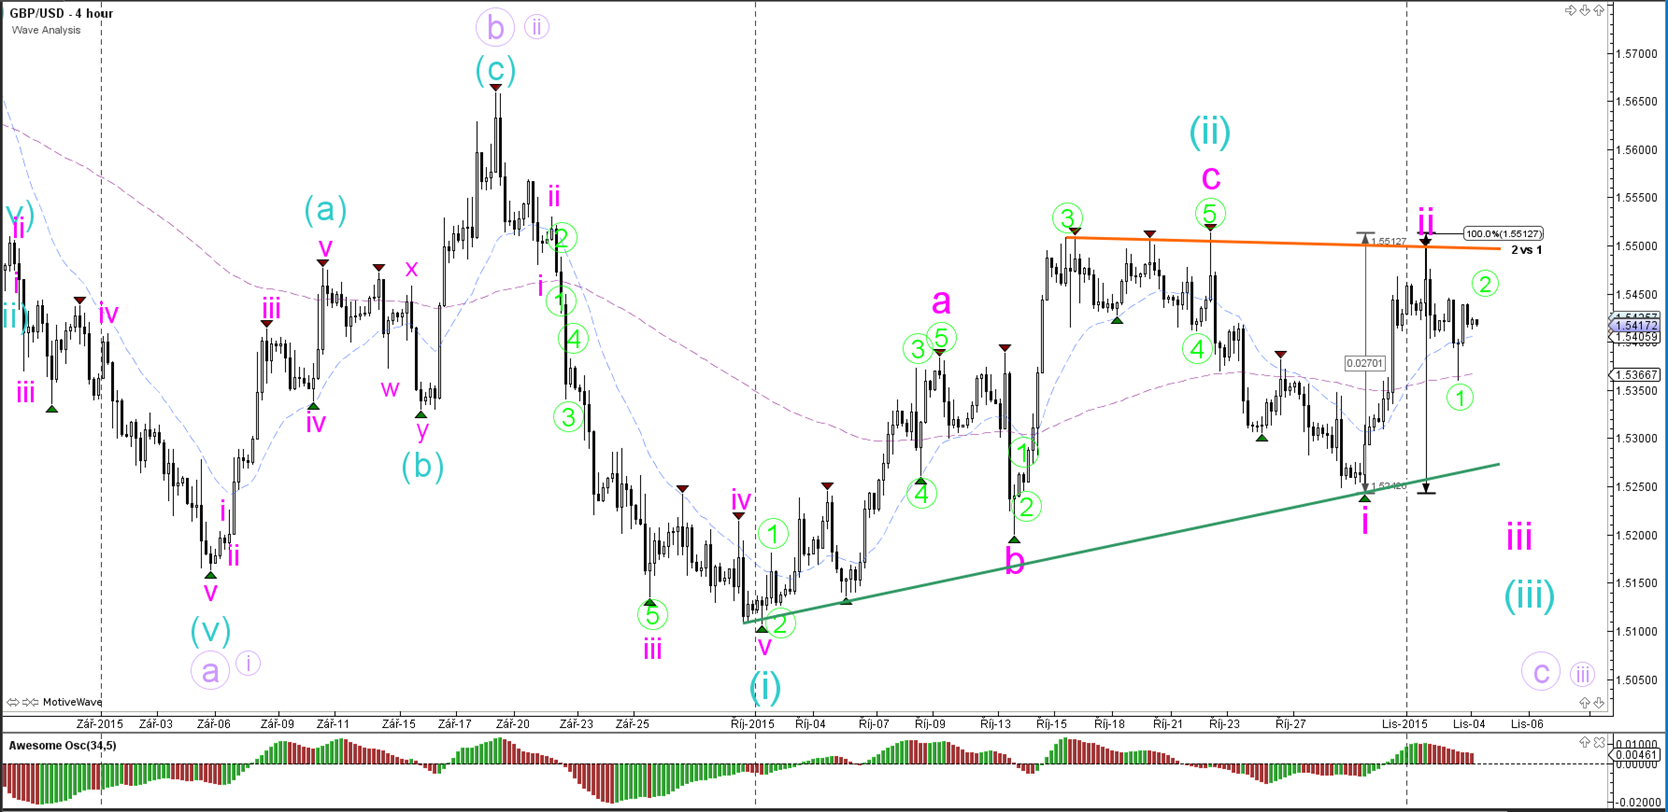
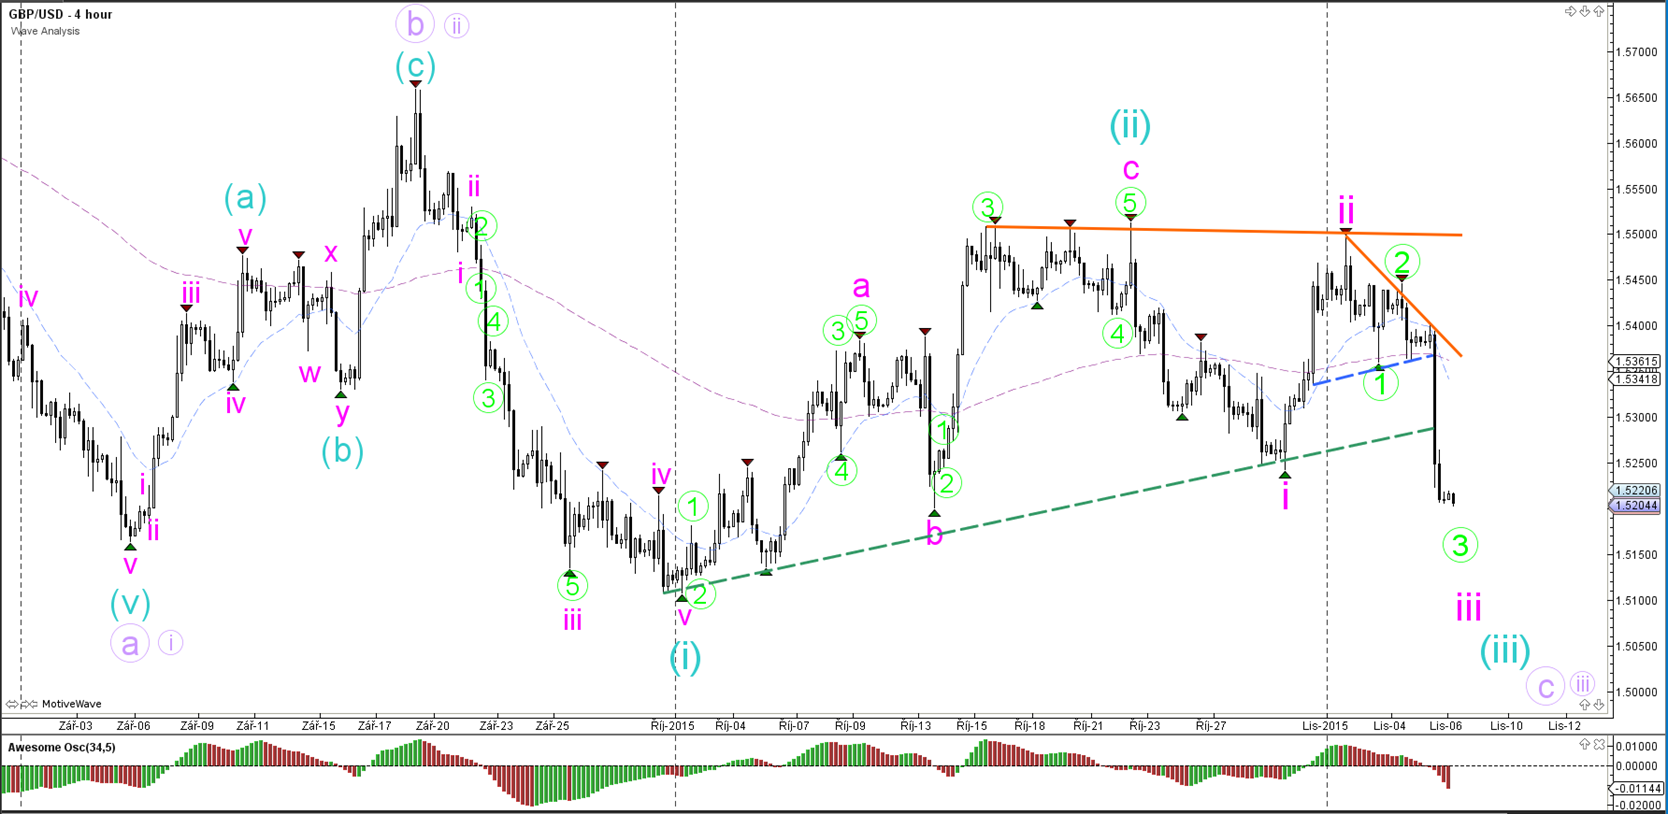
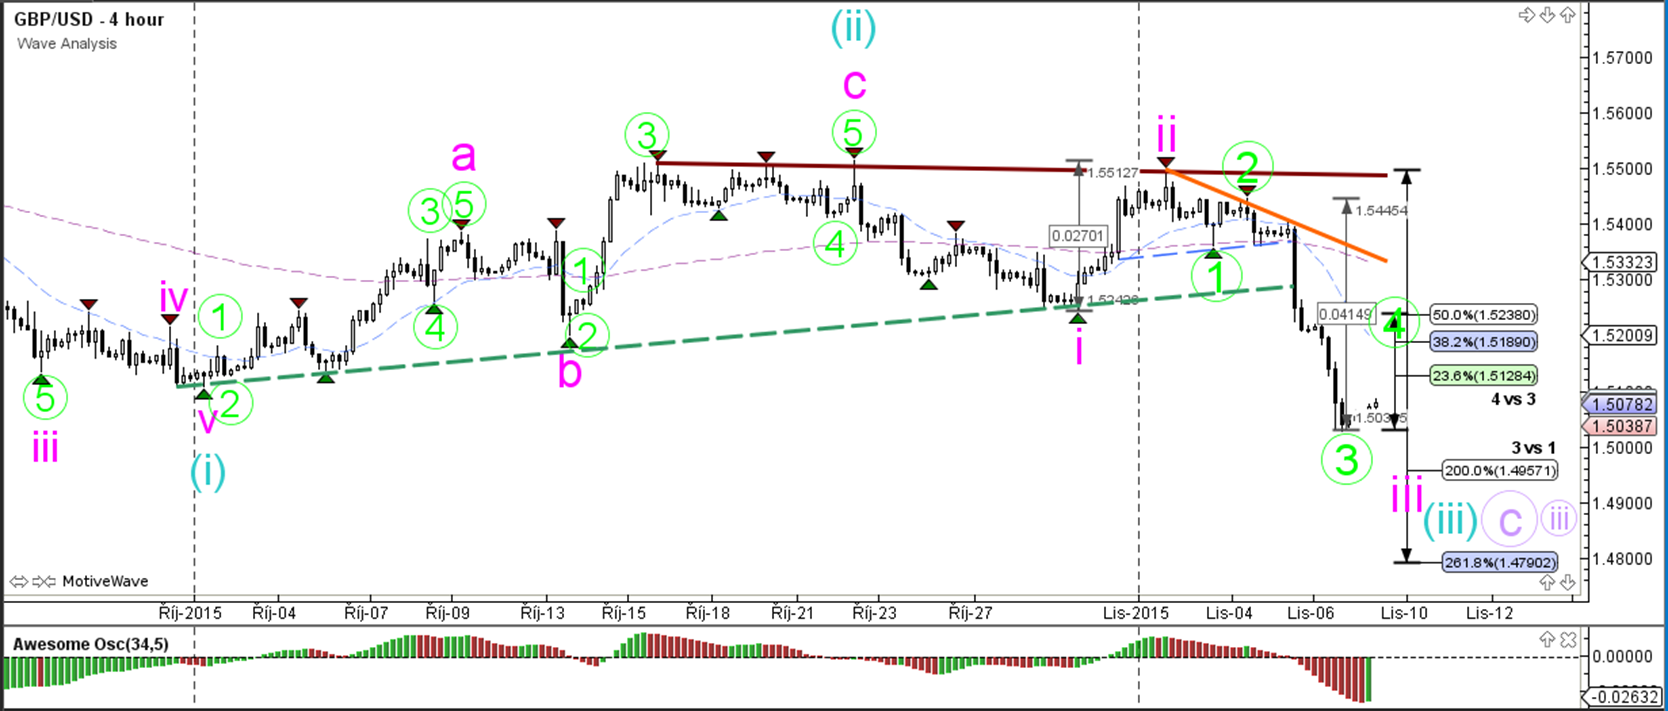
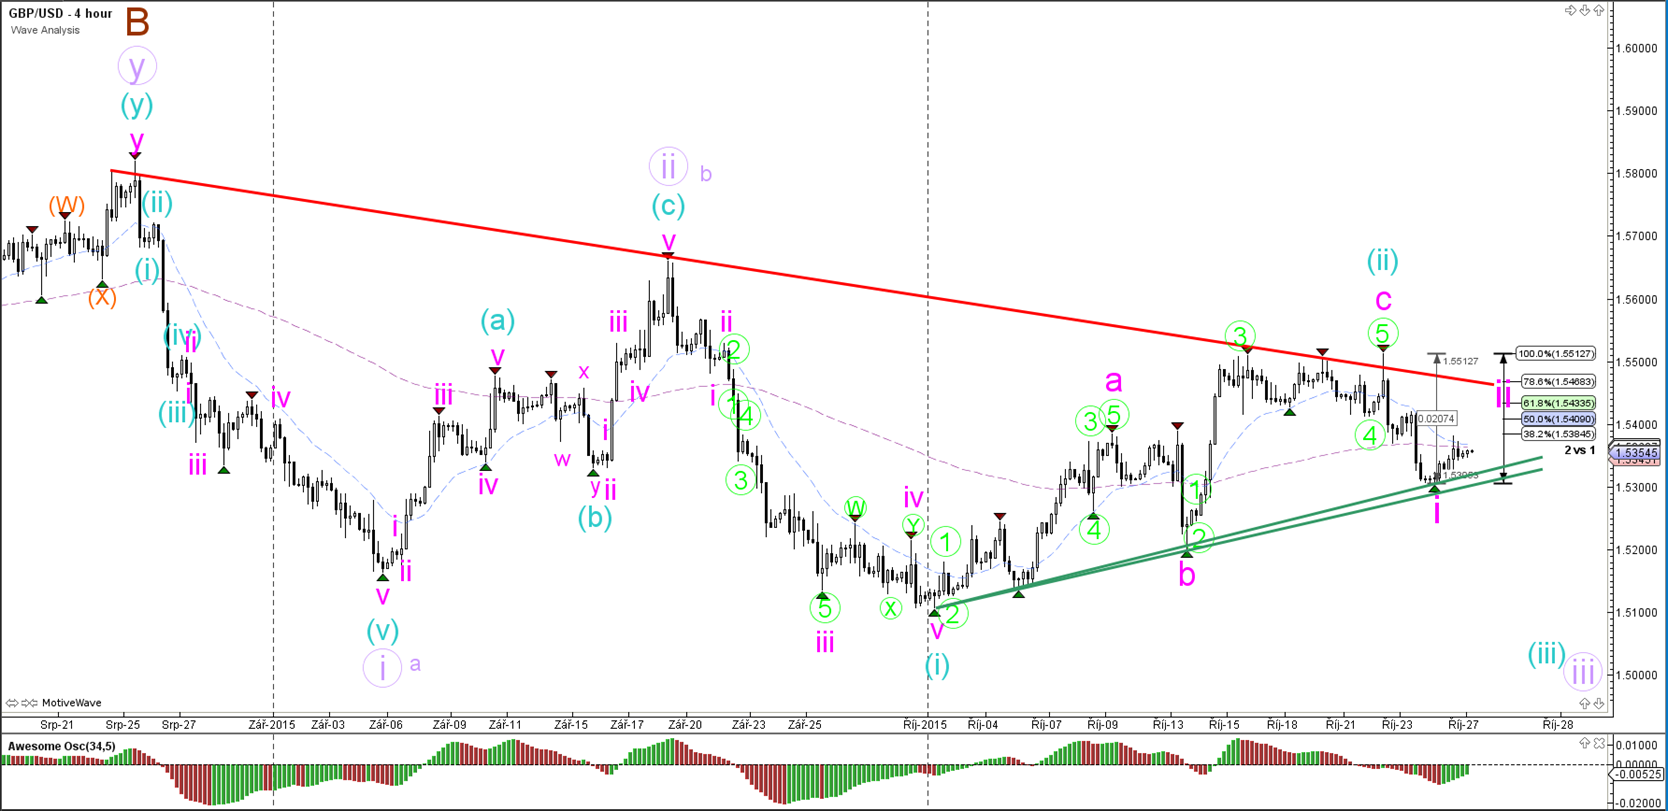
GBP/USD
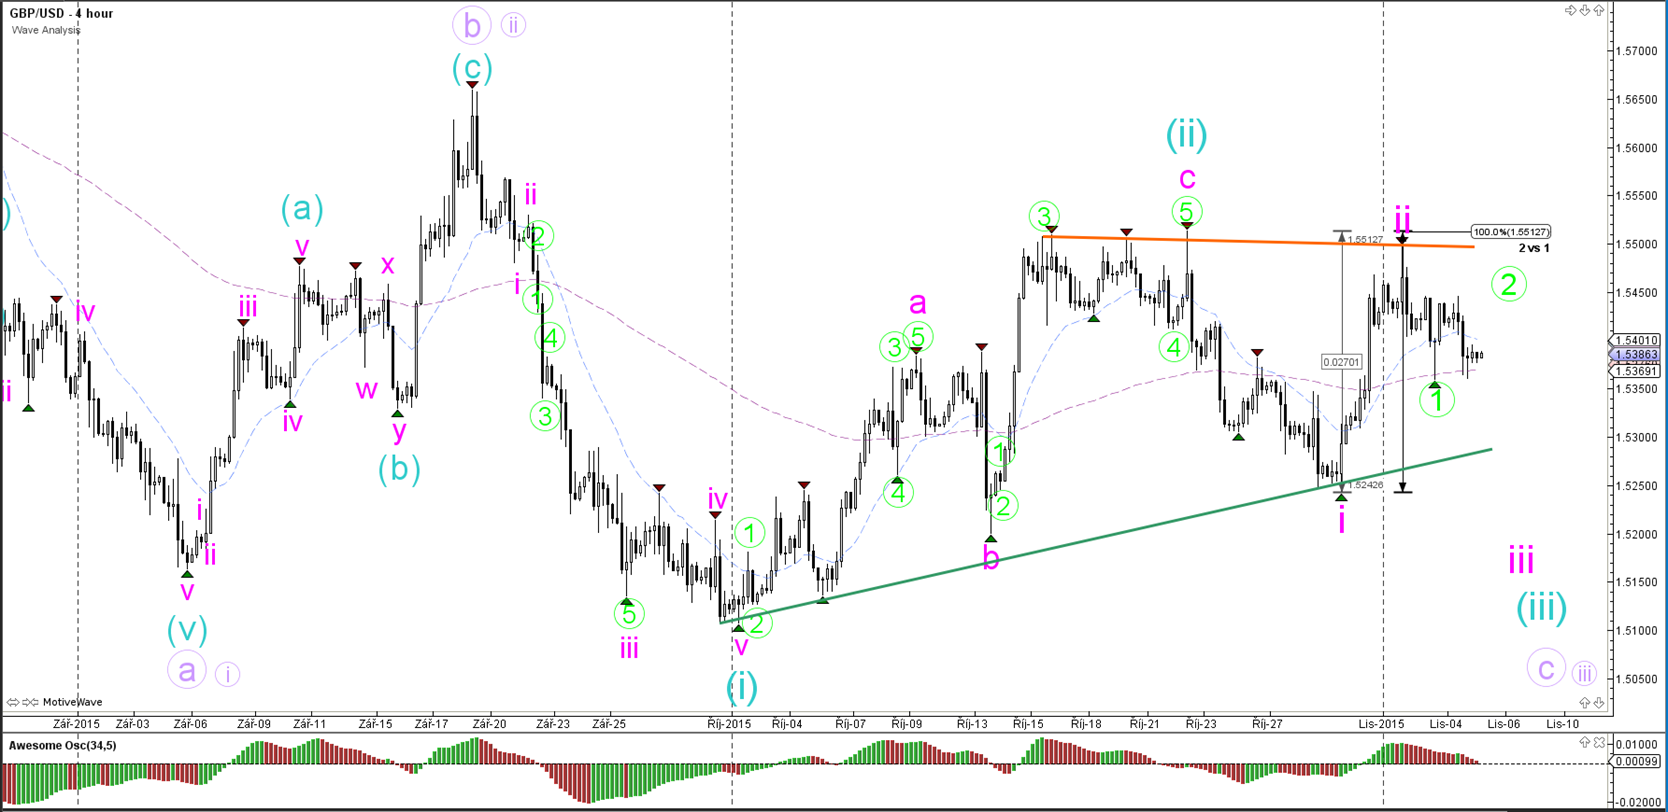
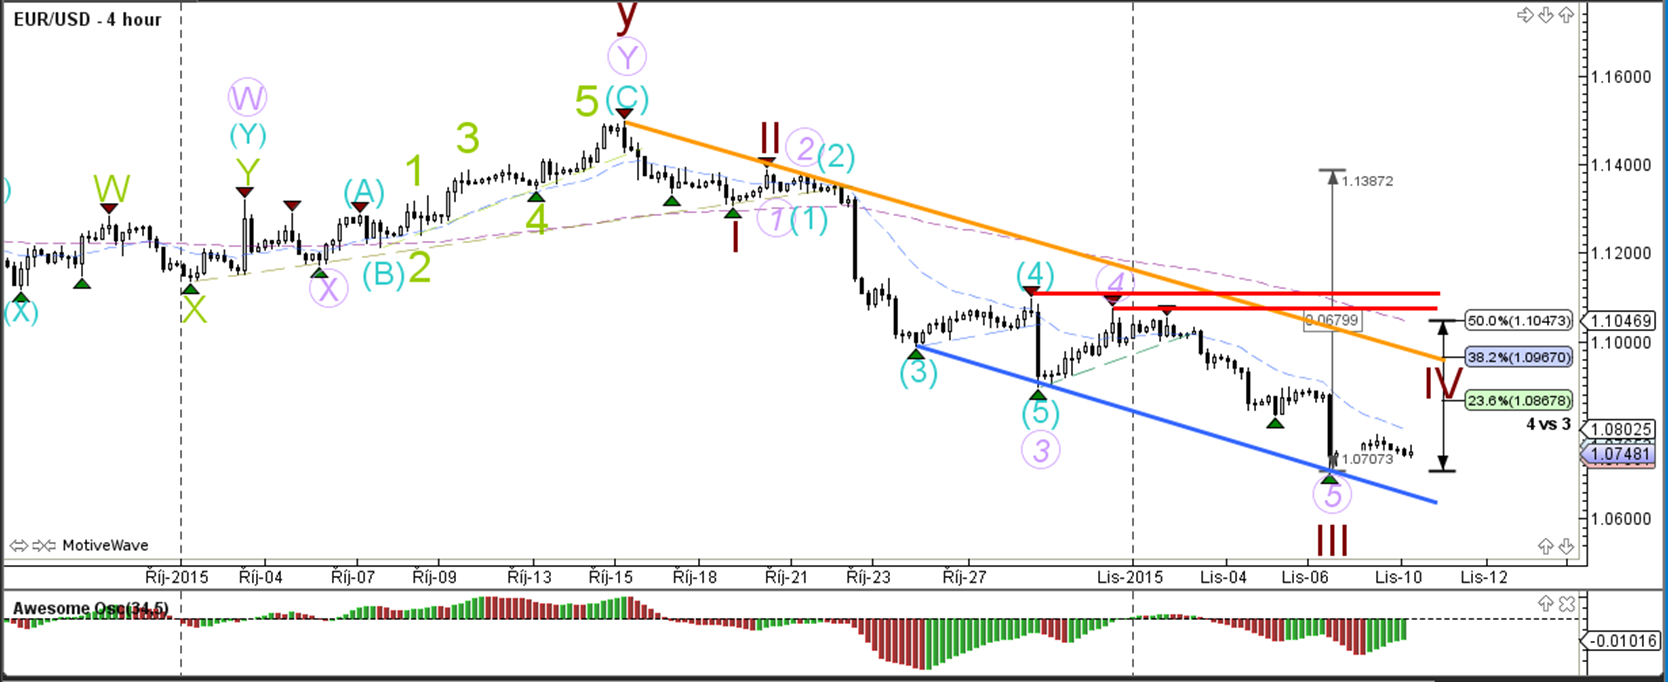
4 hour

The GBP/USD will be heavily impacted by the FOMC rate decision and statement later today. The GBP/USD price action is attempting to break the support (green) trend line of the contracting triangle chart pattern, which increases the chance of a wave 3 (orange/green) starting (unless price breaks back above resistance).
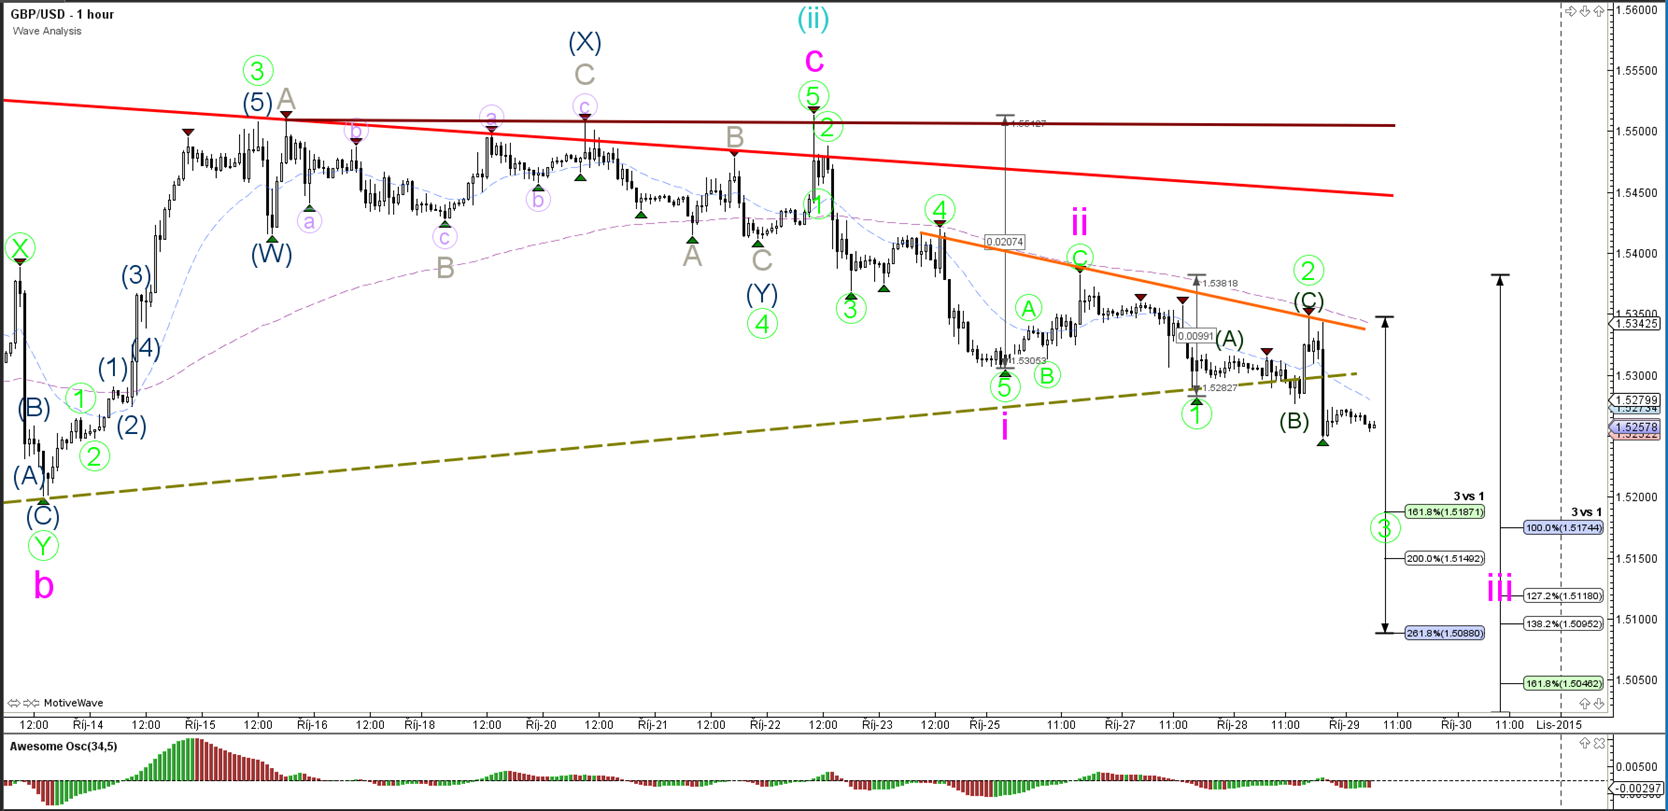
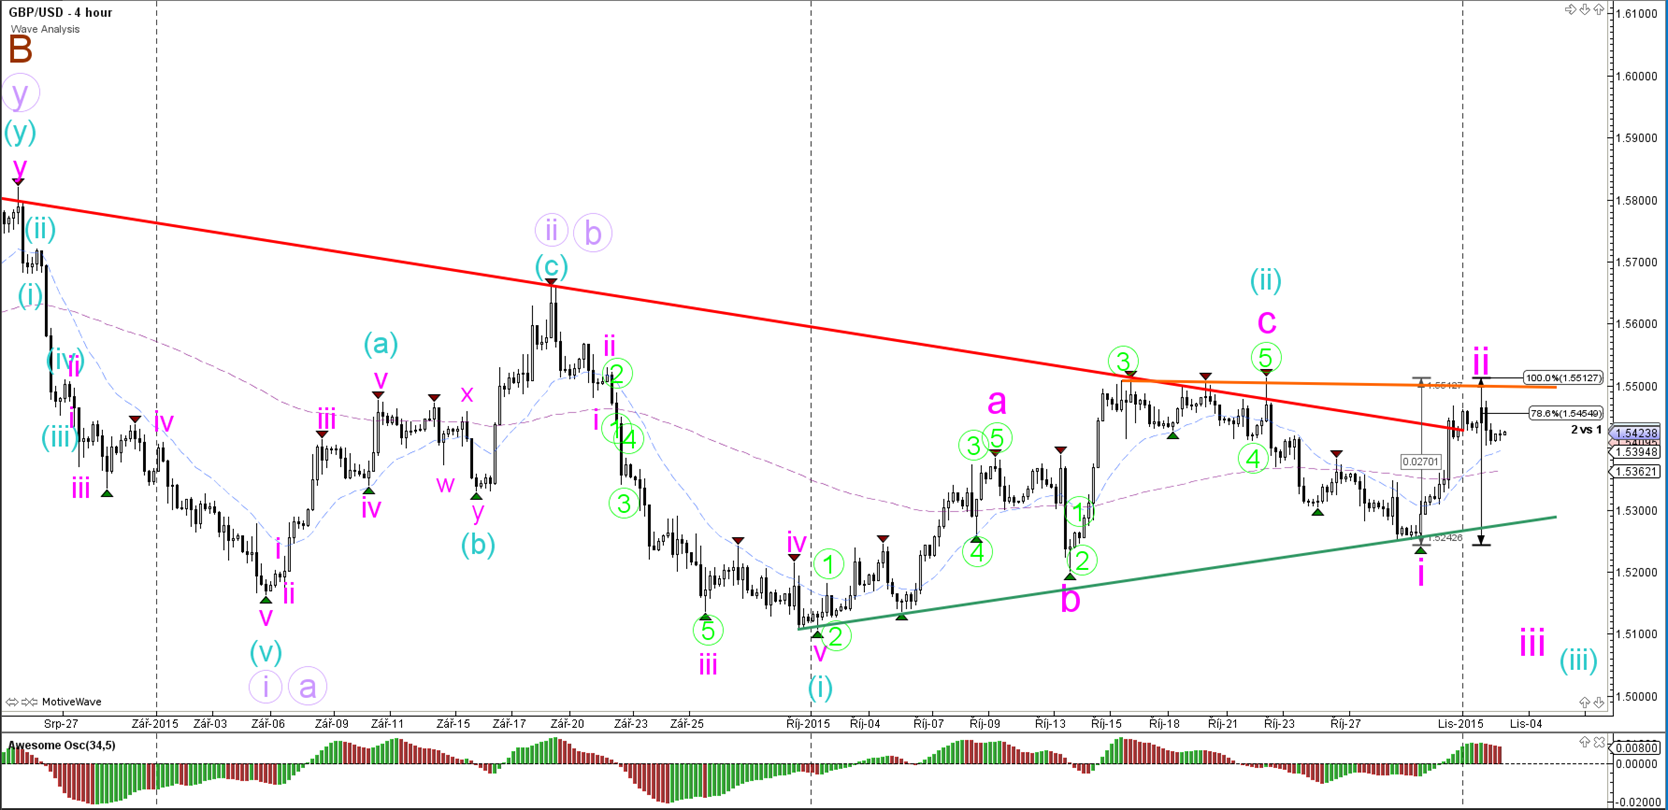
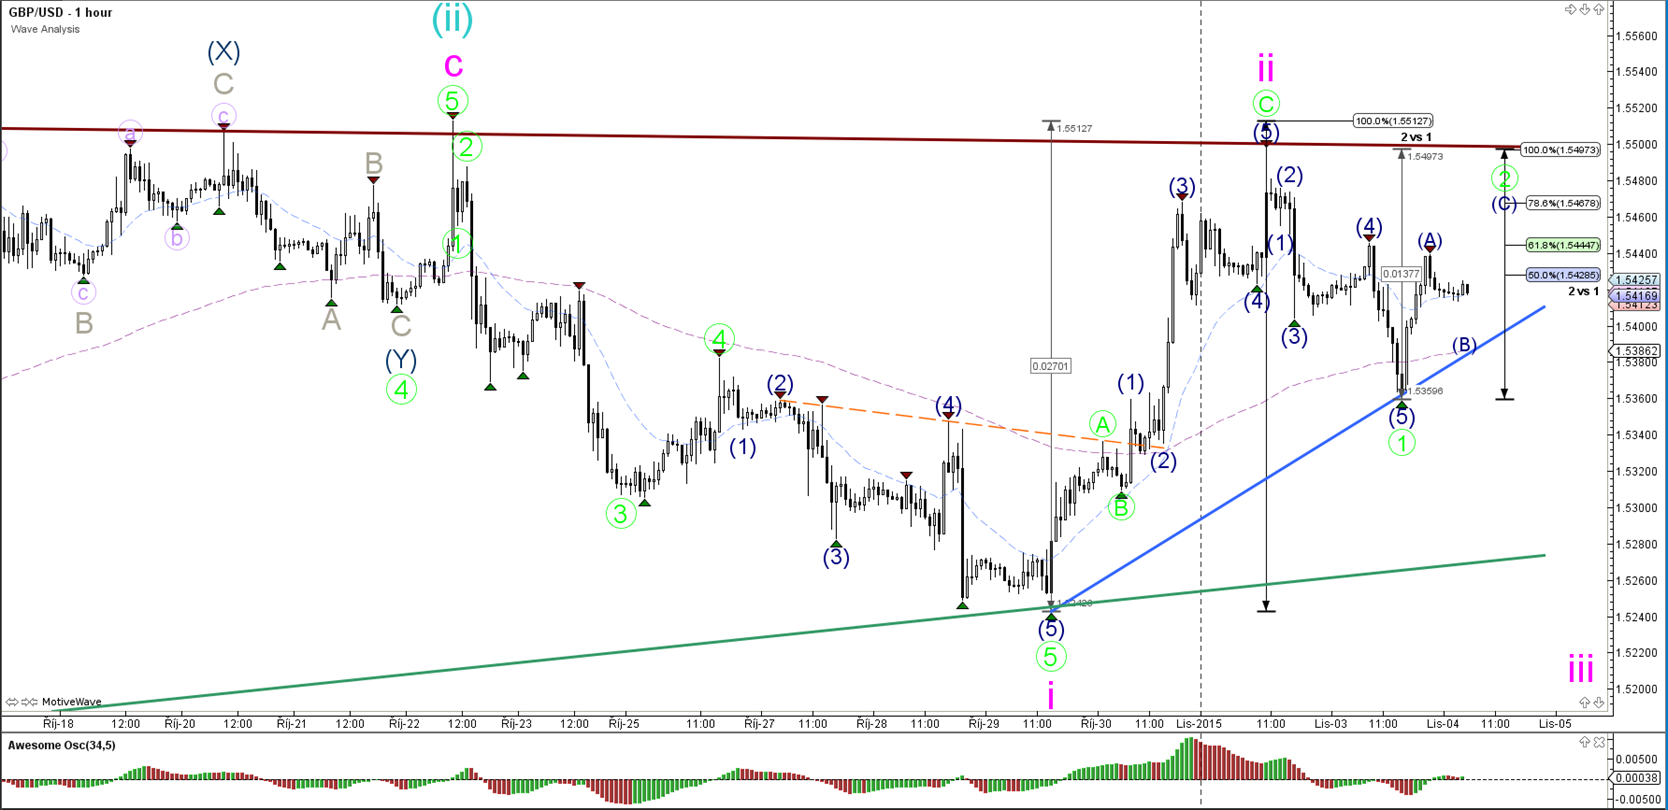
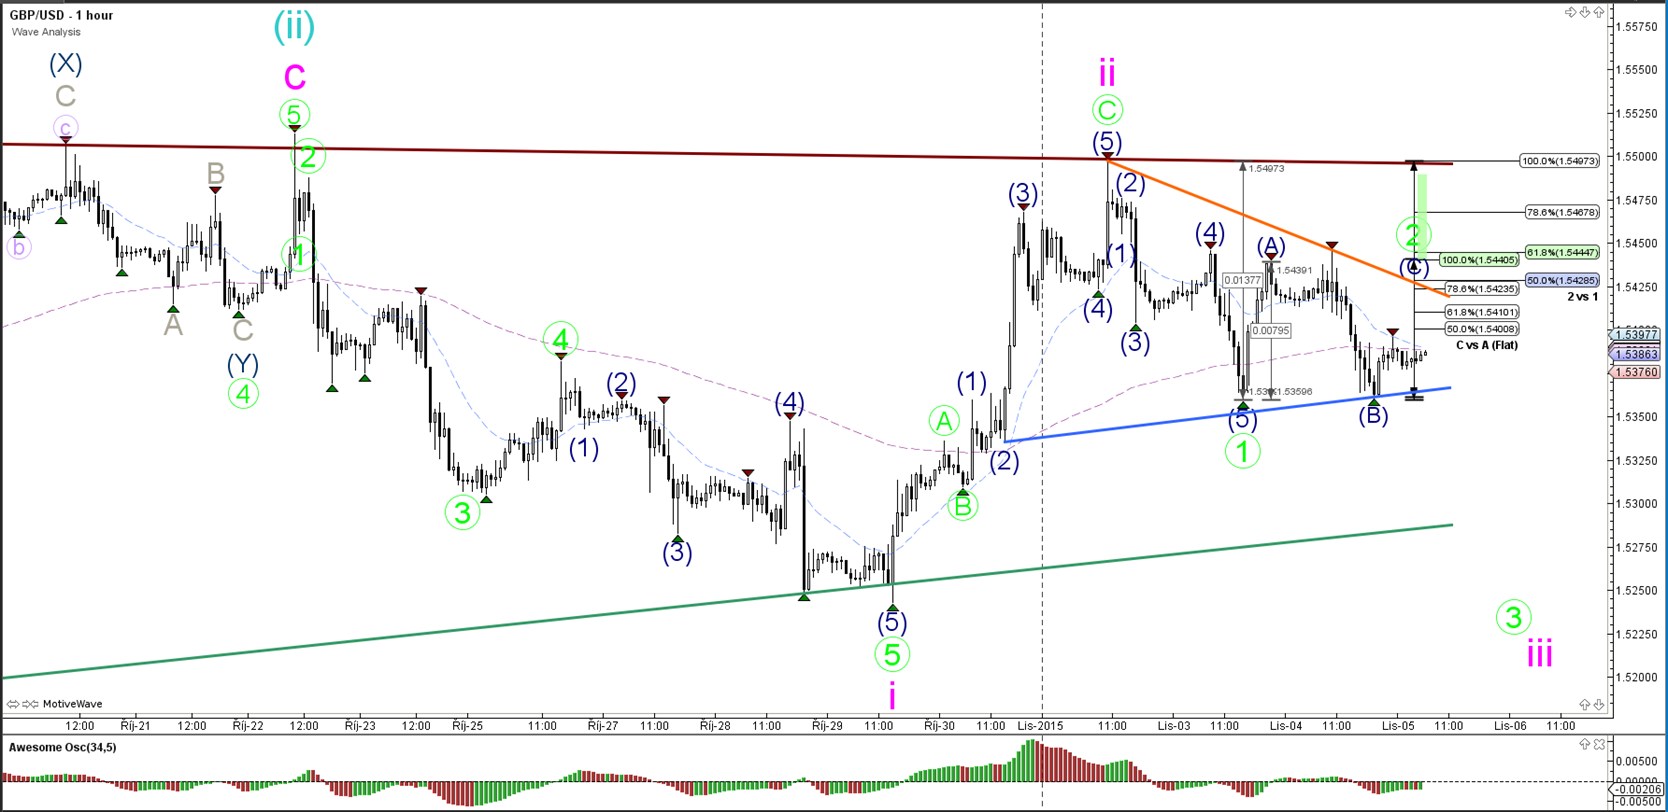
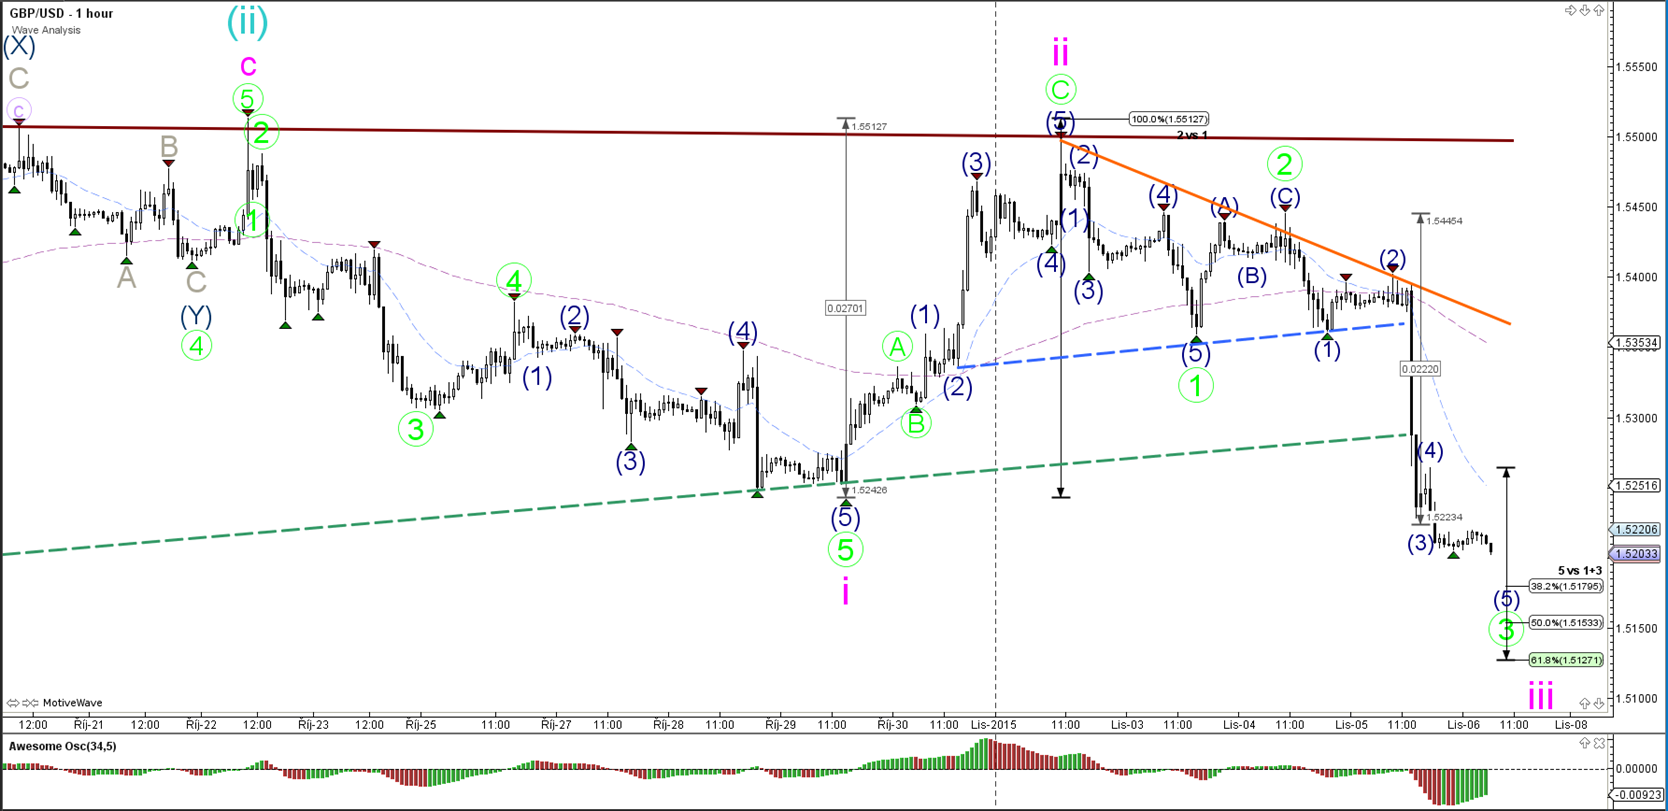
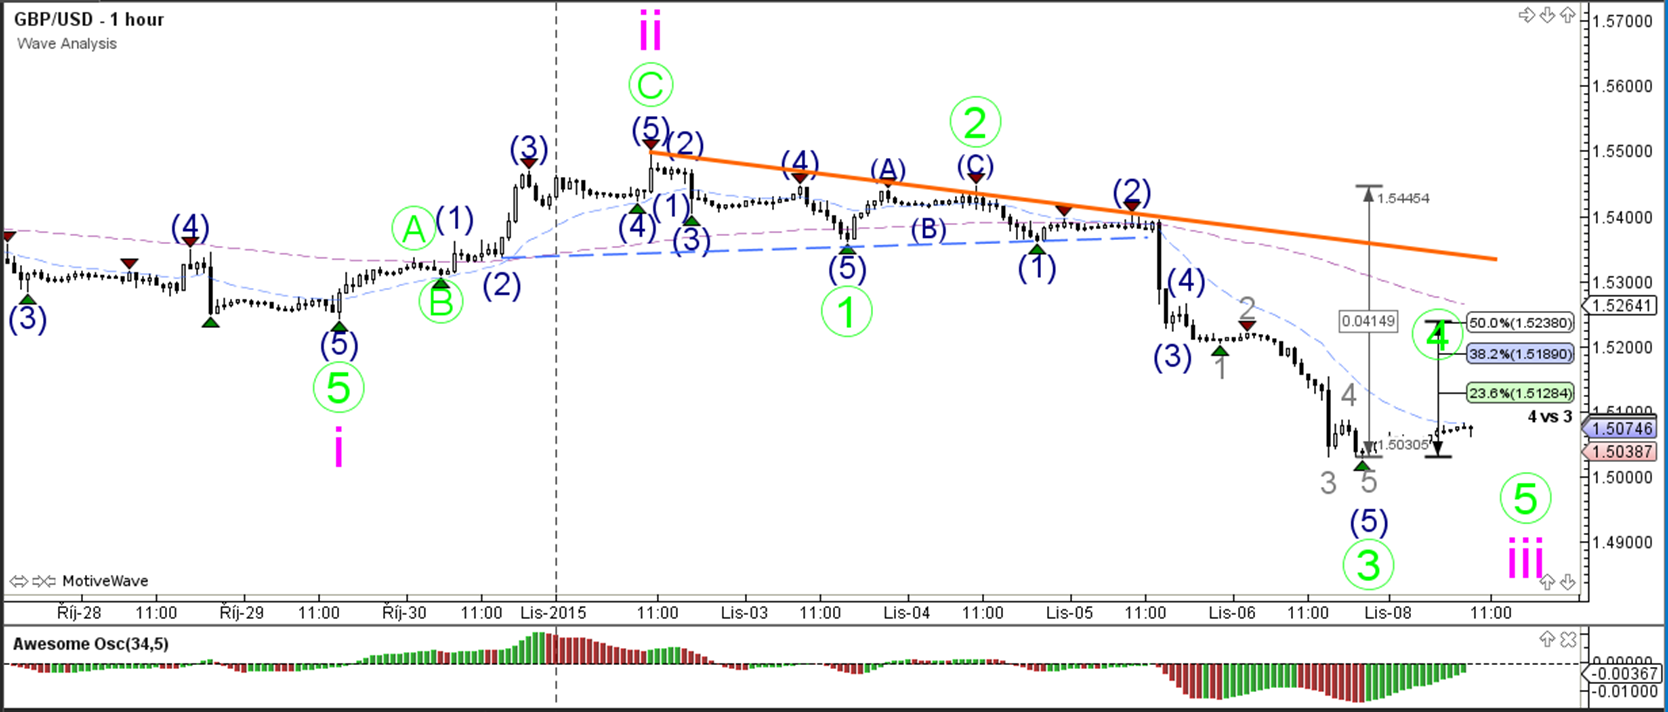
1 hour
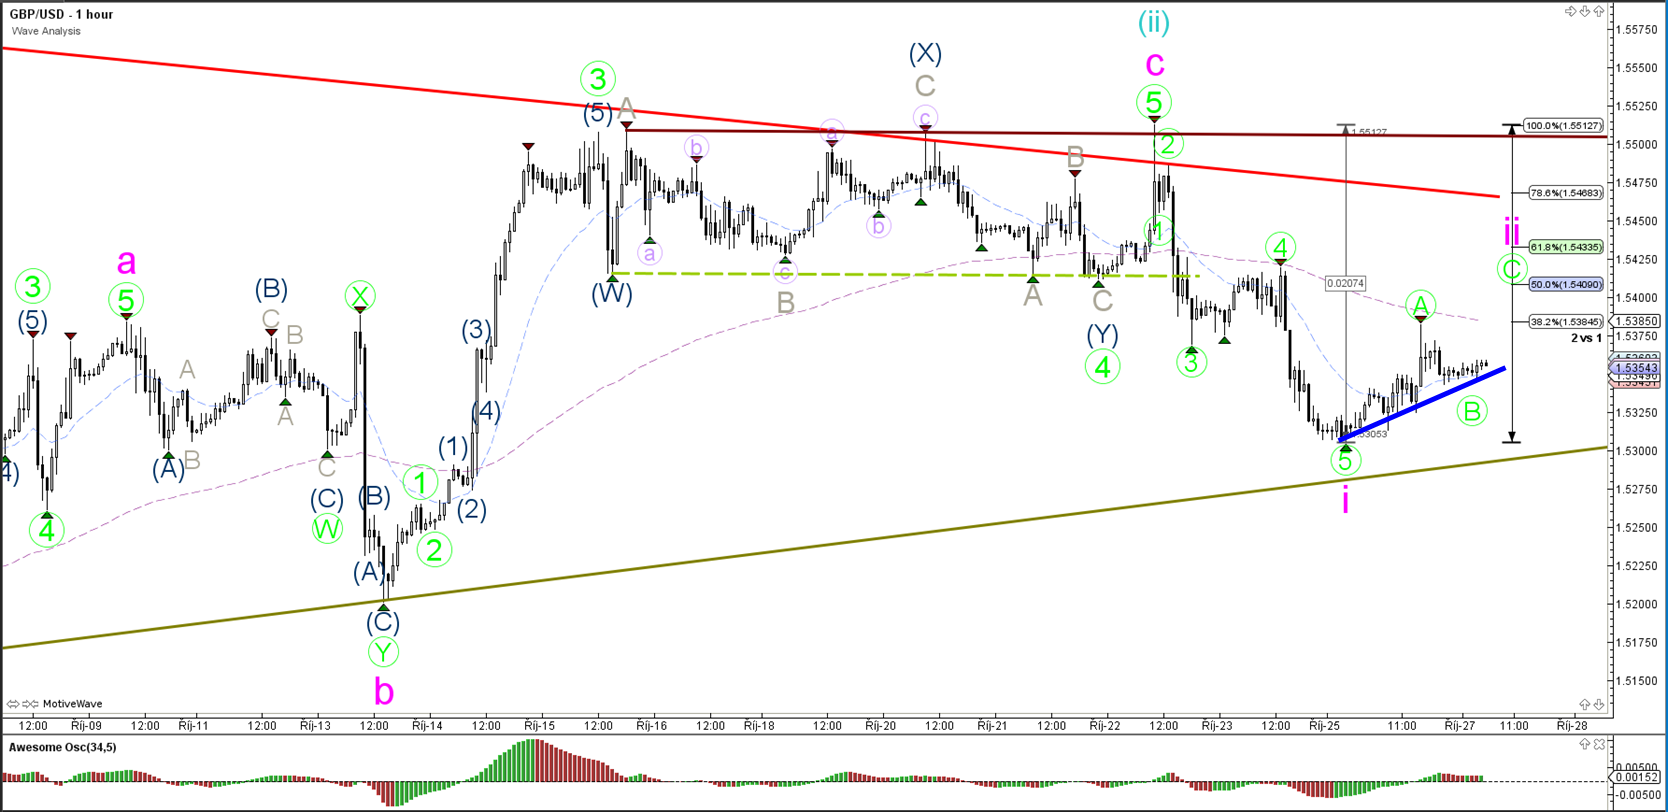
The GBP/USD could be building a wave 3 (green) if price manages to break below the support (green) rend line. One of the alternatives is that price makes an ABC rally back to resistance (red).
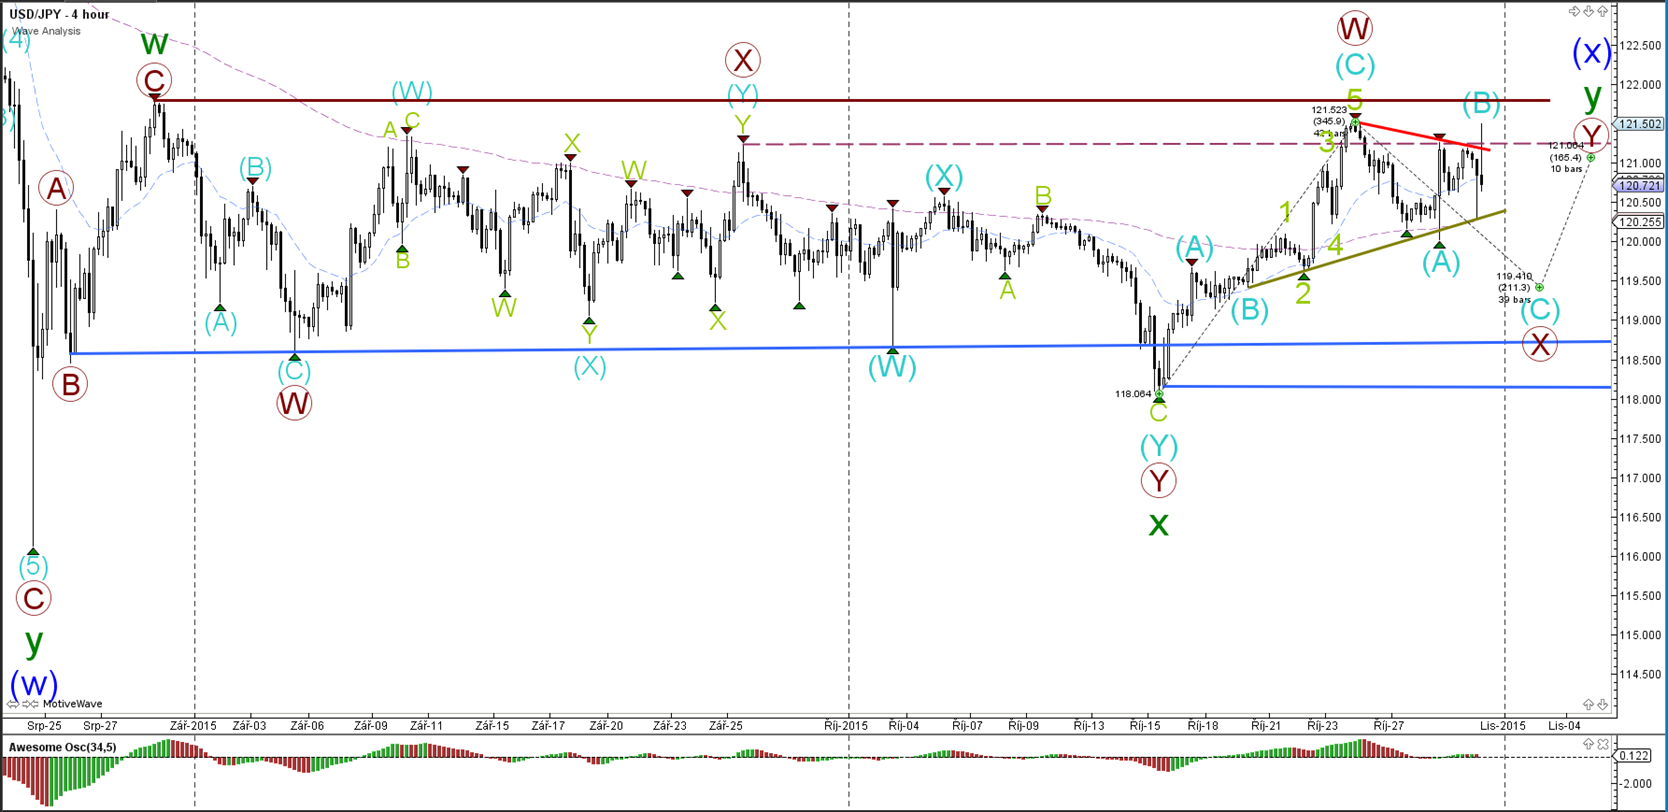
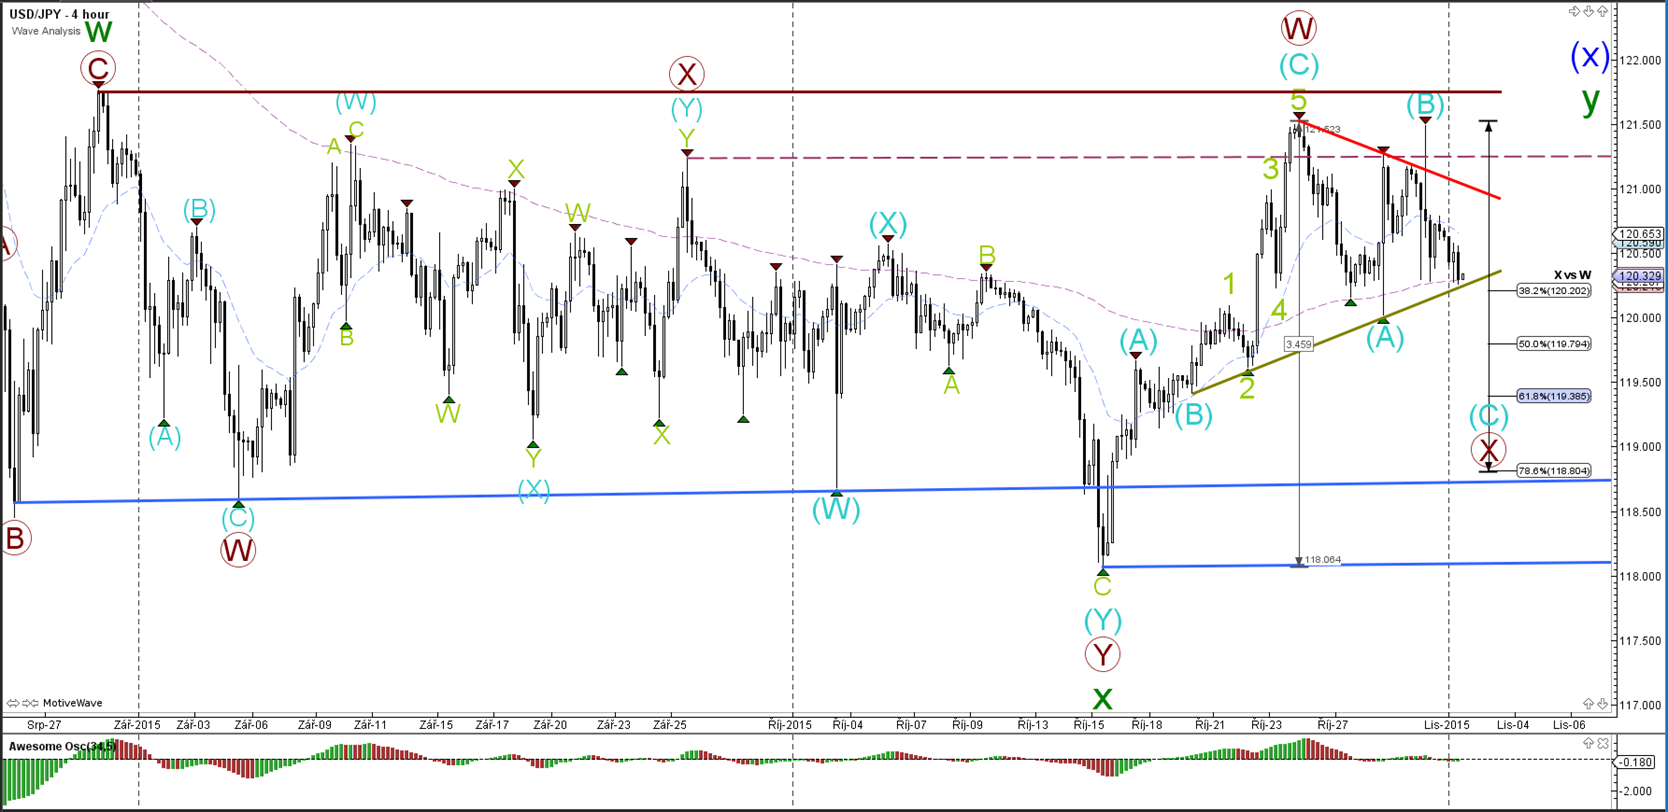
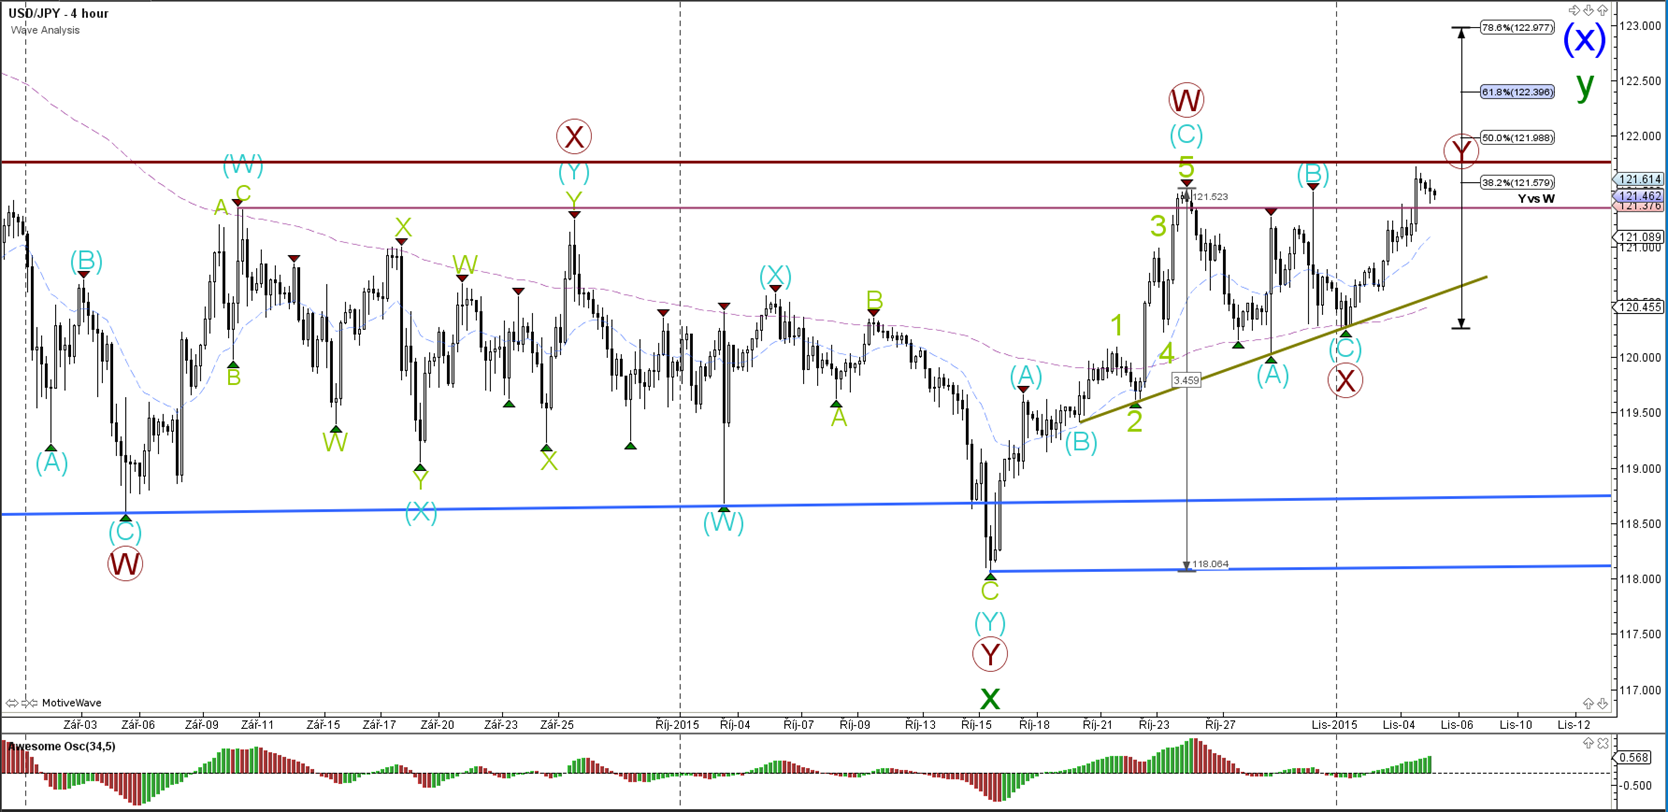
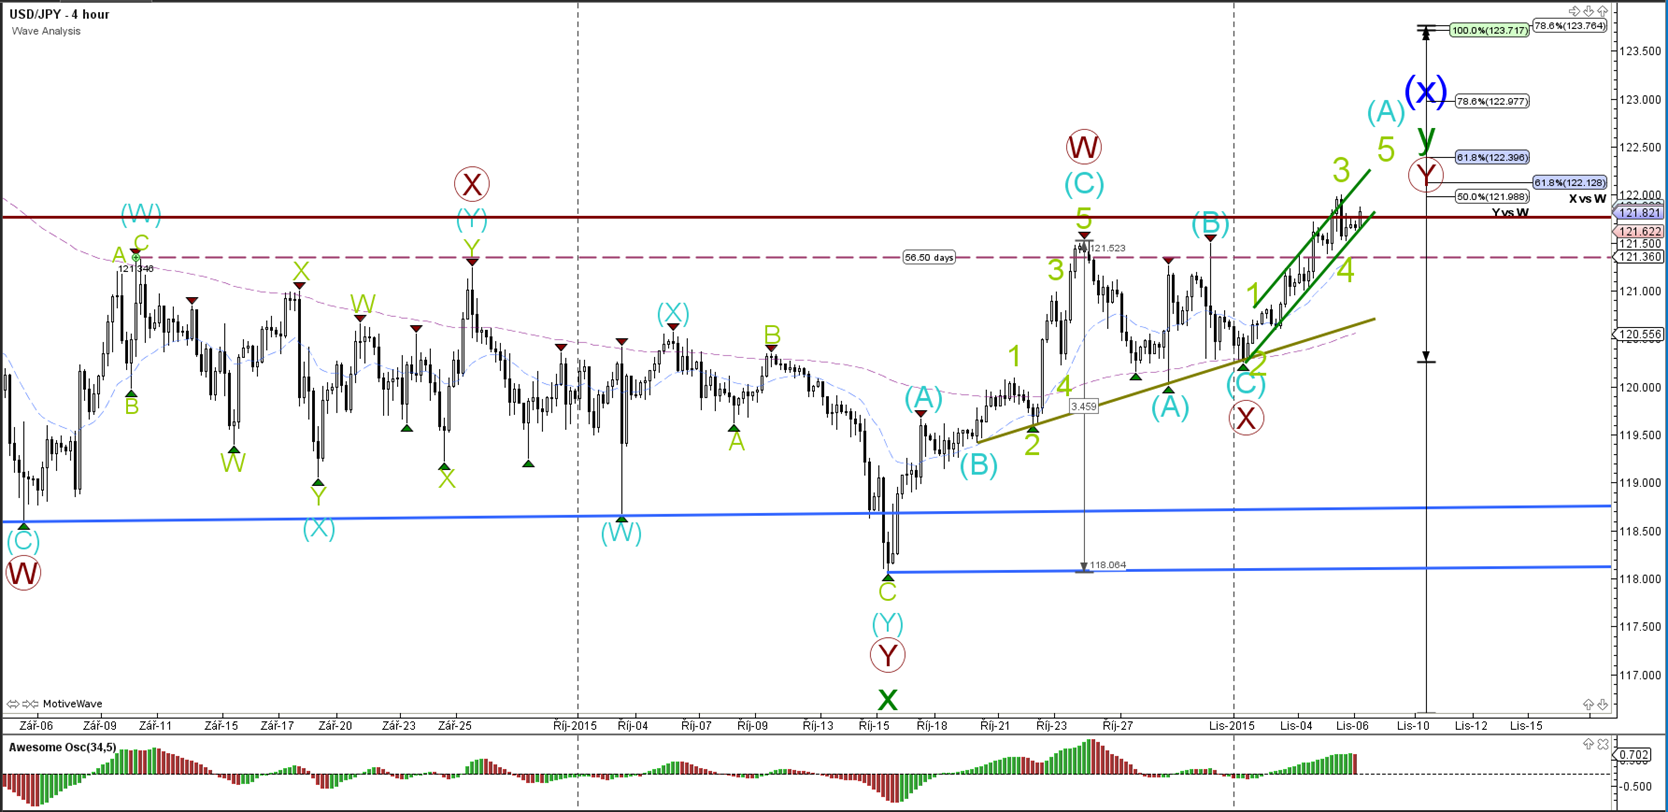
USD/JPY
4 hour
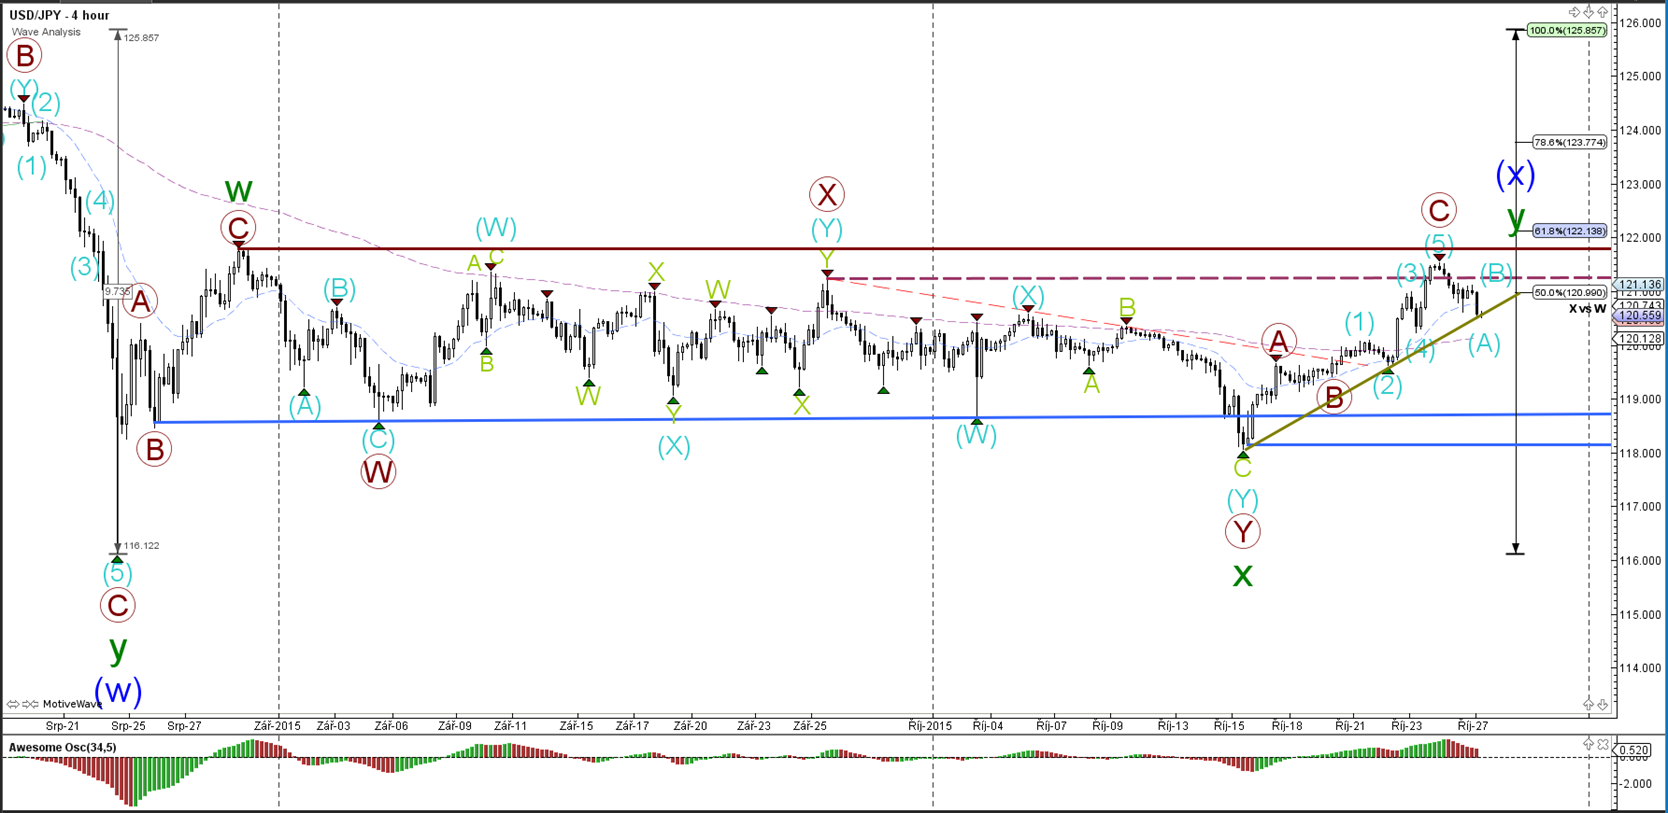
The USD/JPY will be heavily impacted by the FOMC rate decision and statement later today. A break above or below the consolidation zone could indicate the intermediate direction of this currency pair.
“Original analysis is provided by Admiral Markets”
EUR/USD
4 hour
The EUR/USD will be heavily impacted by the FOMC rate decision and statement later today. A EUR/USD break above resistance (red) invalidates the current wave structure, whereas a break below support (green) could see price continue with its downtrend.
1 hour

The EUR/USD is probably in a wave 4 bear flag formation (bottom is geen line) and could head lower at the wave 4 Fibonacci levels. A break above the 50% Fibonacci retracement level and the resistance trend line (red) would invalidate the wave structure. A break below the trend line (green) could confirm the start of wave 5 (blue).
GBP/USD
4 hour
The GBP/USD will be heavily impacted by the FOMC rate decision and statement later today. The GBP/USD price action is attempting to break the support (green) trend line of the contracting triangle chart pattern, which increases the chance of a wave 3 (orange/green) starting (unless price breaks back above resistance).
1 hour

The GBP/USD could be building a wave 3 (green) if price manages to break below the support (green) rend line. One of the alternatives is that price makes an ABC rally back to resistance (red).
USD/JPY
4 hour

The USD/JPY will be heavily impacted by the FOMC rate decision and statement later today. A break above or below the consolidation zone could indicate the intermediate direction of this currency pair.
“Original analysis is provided by Admiral Markets”