Sive Morten
Special Consultant to the FPA
- Messages
- 18,673
Fundamentals
So, it should be tough week, guys as we will get two or even three rate announcing by major central banks - Fed, BoE and RBNZ.
As last week data of Industrial production in US and consumer sentiment were rather positive, now most traders have no doubts that rate should be increased. So, we could say that this rate change is fully priced-in and will not be a surprise. Take a look at Fed watch tool that shows of probability of this event:

It means that most important thing will be press conference after rate decision and this will be major driving factor that could make an impact on EUR/USD rate. Now next rate change is expected in June meeting and currently stands for ~74% prob. to happen.
Many traders right now have a concern on wage inflation issue. In recent 2-3 NFP reports wage growth was flat and didn't correspond to expectations. That's why effect of NFP mostly was mixed. Here is, guys, good article that explains this phenomenon on example of Phillips curve. Mostly it tells about tariffs impact on US economy and global trade, but also explains why in modern economy relation between inflation and unemployment is muted and shows not as solid dynamic as before 1990's.
Shortly speaking, flatter wage changes now are not the sign of insufficient inflation and not a sigh of weakness. This is just result of globalization of economical relations. It means that so-called "weakness in wage growth" doesn't reflect insufficient inflation and should not become a headwind for Fed hawkish policy.
What's really rise a concern is political instability in US. As Reuters reports, "U.S. President Donald Trump has decided to replace his national security adviser, H.R. McMaster, the Washington Post reported on Thursday. At the same time, the New York Times reported U.S. Special Counsel Robert Mueller had issued a subpoena for documents related to Trump’s businesses, including some concerning Russia.
Earlier this week, the U.S. currency took a hit after Trump dismissed Secretary of State Rex Tillerson as investors grew increasingly nervous about the direction U.S. policy might take following a series of departures by key staff members."
At the same time, some turmoil stands in EU as well - uncertainty over the outcome of the Italian elections and the coalition talks in Germany took its toll on confidence. These factors make impact invisibly on FX rate. Although Germany and EU economy now looks really strong and stands on a good pace - Sentiment indicators point on some concern due political issues.

Although we do not have ECB meeting on coming week, but last time there was an issue that was missed by most investors. Although Draghi has said "not to expect a paring back of monetary stimulus any time soon". This was treated as bearish sign for EUR as many other Central Banks, have started to change their rhetoric into more hawkish, following the Fed.
At the same time the ECB recently dropped the so-called ‘easing bias’ from its monetary policy statement. It did so by removing a line detailing its explicit commitment to increase the size and/or duration of asset purchases if conditions deteriorated.
It means that ECB view on EU economy perspective is also changing and stands in a right direction, but, may be not as obvious as other central banks.
Finally, let's see what to expect from BoE. Odds stand not in favor of rate change as UK could meet a recession this year by Fathom consulting opinion. They appeal to weakness of construction market in GB that has dropped for 3.4% in January, which has become strongest drop in 5 years. Although construction takes just ~ 6% of GBP in England, it could reflex deeper ongoing process in economy as construction involves a lot of other industries in process. Other recent data confirm a slowdown in consumers’ expenditure, with the Visa measure of high street spending falling by 1.1% in the twelve months to February, after adjusting for the effects of inflation.
Market expectations supports this view as investors also wait for flat decision. As in the case with Fed, it will be interesting to watch for voting results and overall economy assessment by BoE.
COT Report
CFTC data shows that recent retracement on EUR was used to increase long positions. EUR speculative net long position stands highly saturated, but it was increased last week. As open interest as net position have reached higher levels.

At the same time high saturation makes possible to reach previous top around 1.26 area but significantly reduce chances on real breakout of monthly resistance. But this is just what odds tell. Within last 1-2 years EUR has increased it's record net long position value approx. for 40% and almost doubled it compares to 2009-2010 levels. Thus, we should be cautious on this issue, but whether it will have limited impact on EUR - we will see.
Technicals
Monthly
No big changes on monthly chart has happened. It stands in "Buy" mode, price is pulling back out from strong resistance of K-resistance 1.2516-1.26, accompanied by YPR1 @ 1.2617 area. There is not overbought on monthly chart.
Resistance area is rather strong and current retracement still looks too small to be treated as proportional respect to it. At the same time, market also could easily fluctuate inside the range till the previous top of ~1.26 and challenge them. So, monthly picture doesn't provide us something new. The one thing that we could add here is either price action should show deeper retracement or tight consolidation just under strong level will suggest upside breakout.
And, finally, as we've said above - saturated net long EUR position hardly will let price to break this area any time soon. Thus, our conclusion here is - "yes" to fluctuations below YPR1, while "no" to upside breakout and moving to next 1.3860 area.

Weekly
Last week we've talked about grabber and its most probable upside target, which is 1.2615 - Yearly Pivot Resistance 1. Major level here is, of course, grabber's low at 1.2150. While it will hold, from weekly point of view we do not need to search other entry points to fade weekly sell against monthly buy. Thus, monthly/weekly basis stands untouched.
Meantime on weekly/daily situation it is not as clear as it could be. In recent time we've got two side-by-side similar weeks, almost twins. Both indicates market's attempt to move higher and drop back by the end of the week. Weekly trend stands bearish.
By pivot framework shows bearish setup as well, at least it could be a sign of downside continuation. Upside action was held by MPR1 two weeks ago. Now price has dropped and closed below MPP. So market indeed could show a bit deeper action before situation will change. By pivot analysis market could drop to MPS1.
Using Fib extension tells that nearest COP target stands at 1.22, while OP stands indeed around MPS1 at 1.2045. To keep clarity of bullish setup, it is preferable to hold inside the flag, i.e. around COP target. As net long position is growing, it seems as achievable issue. This also will let market potentially to create a butterfly pattern later.

Daily
Daily trend also stands bearish. As market was not able to show "V" shape retracement to 1.2270 and continue move up, but has turned to compounded 2-leg AB=CD retracement, we need to wait for achieving of logical profit objective (LPO). First is COP of our daily/weekly AB-CD pattern at 1.22. This is potential reversal point as market could form "222" Buy here. Downside breakout will lead price to OP and "222" will shift to Butterfly "Buy".
As we do not have any other patterns here, every time, we will need to drop to hourly chart and watch for signs of reversal around daily levels. And 1.22 level will be the first one.

Intraday
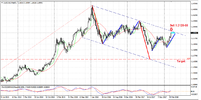
4-hour chart shows that we also have inner OP target around 1.2240:

On hourly chart, although I'm not sure that we could call it as Butterfly, but 1.27 extension of "BC" leg stands approximately at the same area - 1.2234, as well as WPS1.

Conclusion:
Short-term analysis tells that short-term bullish scenario will be valid until market stands above 1.2150 lows. But on coming week market should test strong support area of 1.22-1.2240. This could become first chance for EUR to turn up again. Breaking of 1.22 will shift advantage in favor of bears, because significantly diminish chances on standing above 1.2150 as well... So, in wider understanding, 1.22 is treated as last outpost even more than 1.2150.
The technical portion of Sive's analysis owes a great deal to Joe DiNapoli's methods, and uses a number of Joe's proprietary indicators. Please note that Sive's analysis is his own view of the market and is not endorsed by Joe DiNapoli or any related companies.
So, it should be tough week, guys as we will get two or even three rate announcing by major central banks - Fed, BoE and RBNZ.
As last week data of Industrial production in US and consumer sentiment were rather positive, now most traders have no doubts that rate should be increased. So, we could say that this rate change is fully priced-in and will not be a surprise. Take a look at Fed watch tool that shows of probability of this event:
It means that most important thing will be press conference after rate decision and this will be major driving factor that could make an impact on EUR/USD rate. Now next rate change is expected in June meeting and currently stands for ~74% prob. to happen.
Many traders right now have a concern on wage inflation issue. In recent 2-3 NFP reports wage growth was flat and didn't correspond to expectations. That's why effect of NFP mostly was mixed. Here is, guys, good article that explains this phenomenon on example of Phillips curve. Mostly it tells about tariffs impact on US economy and global trade, but also explains why in modern economy relation between inflation and unemployment is muted and shows not as solid dynamic as before 1990's.
Shortly speaking, flatter wage changes now are not the sign of insufficient inflation and not a sigh of weakness. This is just result of globalization of economical relations. It means that so-called "weakness in wage growth" doesn't reflect insufficient inflation and should not become a headwind for Fed hawkish policy.
What's really rise a concern is political instability in US. As Reuters reports, "U.S. President Donald Trump has decided to replace his national security adviser, H.R. McMaster, the Washington Post reported on Thursday. At the same time, the New York Times reported U.S. Special Counsel Robert Mueller had issued a subpoena for documents related to Trump’s businesses, including some concerning Russia.
Earlier this week, the U.S. currency took a hit after Trump dismissed Secretary of State Rex Tillerson as investors grew increasingly nervous about the direction U.S. policy might take following a series of departures by key staff members."
At the same time, some turmoil stands in EU as well - uncertainty over the outcome of the Italian elections and the coalition talks in Germany took its toll on confidence. These factors make impact invisibly on FX rate. Although Germany and EU economy now looks really strong and stands on a good pace - Sentiment indicators point on some concern due political issues.
Although we do not have ECB meeting on coming week, but last time there was an issue that was missed by most investors. Although Draghi has said "not to expect a paring back of monetary stimulus any time soon". This was treated as bearish sign for EUR as many other Central Banks, have started to change their rhetoric into more hawkish, following the Fed.
At the same time the ECB recently dropped the so-called ‘easing bias’ from its monetary policy statement. It did so by removing a line detailing its explicit commitment to increase the size and/or duration of asset purchases if conditions deteriorated.
It means that ECB view on EU economy perspective is also changing and stands in a right direction, but, may be not as obvious as other central banks.
Finally, let's see what to expect from BoE. Odds stand not in favor of rate change as UK could meet a recession this year by Fathom consulting opinion. They appeal to weakness of construction market in GB that has dropped for 3.4% in January, which has become strongest drop in 5 years. Although construction takes just ~ 6% of GBP in England, it could reflex deeper ongoing process in economy as construction involves a lot of other industries in process. Other recent data confirm a slowdown in consumers’ expenditure, with the Visa measure of high street spending falling by 1.1% in the twelve months to February, after adjusting for the effects of inflation.
Market expectations supports this view as investors also wait for flat decision. As in the case with Fed, it will be interesting to watch for voting results and overall economy assessment by BoE.
COT Report
CFTC data shows that recent retracement on EUR was used to increase long positions. EUR speculative net long position stands highly saturated, but it was increased last week. As open interest as net position have reached higher levels.
At the same time high saturation makes possible to reach previous top around 1.26 area but significantly reduce chances on real breakout of monthly resistance. But this is just what odds tell. Within last 1-2 years EUR has increased it's record net long position value approx. for 40% and almost doubled it compares to 2009-2010 levels. Thus, we should be cautious on this issue, but whether it will have limited impact on EUR - we will see.
Technicals
Monthly
No big changes on monthly chart has happened. It stands in "Buy" mode, price is pulling back out from strong resistance of K-resistance 1.2516-1.26, accompanied by YPR1 @ 1.2617 area. There is not overbought on monthly chart.
Resistance area is rather strong and current retracement still looks too small to be treated as proportional respect to it. At the same time, market also could easily fluctuate inside the range till the previous top of ~1.26 and challenge them. So, monthly picture doesn't provide us something new. The one thing that we could add here is either price action should show deeper retracement or tight consolidation just under strong level will suggest upside breakout.
And, finally, as we've said above - saturated net long EUR position hardly will let price to break this area any time soon. Thus, our conclusion here is - "yes" to fluctuations below YPR1, while "no" to upside breakout and moving to next 1.3860 area.
Weekly
Last week we've talked about grabber and its most probable upside target, which is 1.2615 - Yearly Pivot Resistance 1. Major level here is, of course, grabber's low at 1.2150. While it will hold, from weekly point of view we do not need to search other entry points to fade weekly sell against monthly buy. Thus, monthly/weekly basis stands untouched.
Meantime on weekly/daily situation it is not as clear as it could be. In recent time we've got two side-by-side similar weeks, almost twins. Both indicates market's attempt to move higher and drop back by the end of the week. Weekly trend stands bearish.
By pivot framework shows bearish setup as well, at least it could be a sign of downside continuation. Upside action was held by MPR1 two weeks ago. Now price has dropped and closed below MPP. So market indeed could show a bit deeper action before situation will change. By pivot analysis market could drop to MPS1.
Using Fib extension tells that nearest COP target stands at 1.22, while OP stands indeed around MPS1 at 1.2045. To keep clarity of bullish setup, it is preferable to hold inside the flag, i.e. around COP target. As net long position is growing, it seems as achievable issue. This also will let market potentially to create a butterfly pattern later.
Daily
Daily trend also stands bearish. As market was not able to show "V" shape retracement to 1.2270 and continue move up, but has turned to compounded 2-leg AB=CD retracement, we need to wait for achieving of logical profit objective (LPO). First is COP of our daily/weekly AB-CD pattern at 1.22. This is potential reversal point as market could form "222" Buy here. Downside breakout will lead price to OP and "222" will shift to Butterfly "Buy".
As we do not have any other patterns here, every time, we will need to drop to hourly chart and watch for signs of reversal around daily levels. And 1.22 level will be the first one.
Intraday
4-hour chart shows that we also have inner OP target around 1.2240:
On hourly chart, although I'm not sure that we could call it as Butterfly, but 1.27 extension of "BC" leg stands approximately at the same area - 1.2234, as well as WPS1.
Conclusion:
Short-term analysis tells that short-term bullish scenario will be valid until market stands above 1.2150 lows. But on coming week market should test strong support area of 1.22-1.2240. This could become first chance for EUR to turn up again. Breaking of 1.22 will shift advantage in favor of bears, because significantly diminish chances on standing above 1.2150 as well... So, in wider understanding, 1.22 is treated as last outpost even more than 1.2150.
The technical portion of Sive's analysis owes a great deal to Joe DiNapoli's methods, and uses a number of Joe's proprietary indicators. Please note that Sive's analysis is his own view of the market and is not endorsed by Joe DiNapoli or any related companies.
")