Good morning,
So, right now we could see some deviation in price behavior of different assets. For example, gold market 100% has completed our yesterday setup for position taking, while EUR wasn't able to create acceptable background for this.
On daily chart, we still have got bearish grabber, so another headache for bulls. Besides, price is stubbornly coiling around MPP, which indicates indecision and keeps door open for both directions with approx. equal probability:
4-hour chart brings nothing positive to bulls as well, because EUR has failed upside breakout as longer-term trend line as minor megaphone pattern that we've talked about. This also makes impact on daily chart - just recall diamond shape that we've discussed in video.
On hourly chart EUR also has not completed setups that we would like to get - some AB-CD downside action which could point on precise level where position could be taken. Second - no clear bullish reversal pattern around support.
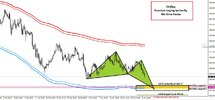
First issue has lost its meaning right now, because EUR already stands at last major 5/8 Fib level. Besides, if you will take a look at 15-min chart and lower, you'll see that upside bounce out from it is looking a bit chaotic, which indicates retracement.
Besides, here we have "222" Sell pattern. All these stuff makes not very attractive attempt to go long, at least right now...
May be this will not crack overall bullish potential, but still, another leg down is possible, may be to daily COP. This also will let EUR to complete daily grabber that has been formed yesterday.
As a reminder, I show you the updated scenario, just to make my view clear. The only change is that the fall from 1.2412 was an ending diagonal.