Sive Morten
Special Consultant to the FPA
- Messages
- 18,679
Morning guys,
Our hourly H&S pattern has been completed by spike up on NFP data release. But, as you will see below, it gives no advantage to bulls and looks like isolated tactical episode in a whole picture. Because total picture that we see right now on BTC doesn't look very encouraging. Here I'll try to share with my warnings.

First is, take a look at weekly chart. Here we see that market is challening ~6000$ level for a long time. Every time BTC shows 5/8 retracement, but this retracement becomes smaller and smaller. It means that although level holds - less and less buyers step - in when market drops to it next time. As a result we have big triangle pattern with signs of bearish dynamic pressure at the nose. Although we have bullish grabber but 8 weeks have passed since then. IMO picture is more bearish rather than bullish.

On daily chart once regular 5/8 retracement was completed, BTC fails to proceed to new high inside channel consolidation. It seems that sellers have stepped in. Besides, overall action doesn't look thrusty, its too choppy and flat, which hints on retracement nature of the process.

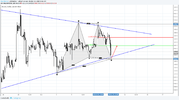
As a result we have triangle on 4H chart and few bearish grabbers have been formed recently. As we've mentioned above any bullish patterns usually stop at minimal targets, as our H&S on Friday. It makes me think that sentiment stands bearish here and it is better to not take any long positions, at least until breaking of previous tops and long-term triangle border. Oppositely, every time, when market comes close to it - it is a chance for short entry, especially if we have some bearish continuation pattern, as "222" Sell, for instance.

Our hourly H&S pattern has been completed by spike up on NFP data release. But, as you will see below, it gives no advantage to bulls and looks like isolated tactical episode in a whole picture. Because total picture that we see right now on BTC doesn't look very encouraging. Here I'll try to share with my warnings.
First is, take a look at weekly chart. Here we see that market is challening ~6000$ level for a long time. Every time BTC shows 5/8 retracement, but this retracement becomes smaller and smaller. It means that although level holds - less and less buyers step - in when market drops to it next time. As a result we have big triangle pattern with signs of bearish dynamic pressure at the nose. Although we have bullish grabber but 8 weeks have passed since then. IMO picture is more bearish rather than bullish.
On daily chart once regular 5/8 retracement was completed, BTC fails to proceed to new high inside channel consolidation. It seems that sellers have stepped in. Besides, overall action doesn't look thrusty, its too choppy and flat, which hints on retracement nature of the process.
As a result we have triangle on 4H chart and few bearish grabbers have been formed recently. As we've mentioned above any bullish patterns usually stop at minimal targets, as our H&S on Friday. It makes me think that sentiment stands bearish here and it is better to not take any long positions, at least until breaking of previous tops and long-term triangle border. Oppositely, every time, when market comes close to it - it is a chance for short entry, especially if we have some bearish continuation pattern, as "222" Sell, for instance.