Sive Morten
Special Consultant to the FPA
- Messages
- 18,760
Fundamentals
Gold fell on Friday, notching its first weekly drop in six due to strong U.S. economic growth, concerns over the U.S. Federal Reserve's withdrawal of monetary stimulus and a slump in Chinese demand. Bullion had gained for most of January until this week, underpinned by weakness in global equities on concerns over emerging economies. But upbeat U.S. growth data reassured investors worried about capital outflows from emerging markets and also validated the Fed's decision this week to reduce its monthly bond purchases to $65 billion from $75 billion, as expected. "You have strength of the dollar against emerging markets currencies, and that's negative for gold," Quantitative Commodity Research owner Peter Fertig said. "Fears that it may lead to widespread crisis are currently sending shivers through the stock markets," Fertig added. The metal posted a 2 percent loss for the week, after five straight weeks of gains. But January's early strength was enough to push gold to its first monthly rise in five, up more than 3 percent so far. "The uptrend since late 2013 is on thin ice, and we think if we don’t see a quick snapback, more testing could be in store," said Mark Arbeter, chief technical strategist at S&P Capital IQ in New York.
CHINA HOLIDAY WEIGHS
Gold was also missing the support of physical demand as the world's number one buyer China has gone into a one-week break.
Among other precious metals, platinum posted a 4 percent drop this week for a second straight weekly fall despite strikes at South African mines that have hit about 40 percent of global output. It was down 0.4 percent at $1,372.75 on the day.
Silver was down 3.5 percent for the week for its biggest weekly drop since late November. It was up 0.2 percent on the day at $19.16 an ounce. Palladium fell 0.4 percent to $701.72 an ounce.
Monthly
Just on previous week we’ve discussed how it could become important to get clear bullish engulfing pattern here. But right at the last week of January upward candle has diminished twice in size. Market has erased almost 50% of upward January action. As result we’ve got much shyer engulfing pattern that in fact, stands at the edge to be called as “englfing”. Still, as we’ve said that our invalidation point is previous lows – let’s see. Chances on upward action still exist here.
Trend holds bearish. Appearing of 1361 Yearly PP could get special meaning from possible retracement point of view. It could become possible nearest upside target. Yearly PR1 is also very significant. We know that gold likes to re-test previously broken lows and consolidations. 1540 area is monthly overbought, YPR1 and low border of broken long-term rectangle. As market was strongly oversold, why it can’t reach overbought? This is very typical action for any market.
As another application of significantly oversold we’ve suggested retracement up. Thus, we’ve made an assumption of possible deeper upward retracement that could take a shape of AB=CD, and invalidation for this setup is previous lows around 1170s. In fact current move up could be the last chance for possible upward bounce, if, say, market will show something like double bottom. Currently price action is very suitable for that – W&R of first bottom. This action in general is very typical for double bottoms and fake breakout could be the first sign of possible retracement up. Bearish market has no other reasons to stop right here, since there is no support right now – it has passed through 3/8 support, it’s not at oversold. Currently we should keep a close eye on move up.
At the same time fundamental data, seasonal trend, physical demand do not quite support upward action, at least right now. May be a bit later situation will change, but market will enter seasonal bearish trend in February and it will be even more difficult to continue move higher.
Weekly
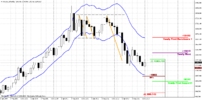
Trend has shifted bullish here. As S&P analysts correctly said – “upward action stands on a thin ice”. Previously we also have mentioned that upward action looks not very impressive and now we’ve got bearish engulfing as addition to this. This is not very good to see such pattern right at January MPR1 and after anemic upward action, but still, this pattern does not break yet chances on upward continuation and could become a part of larger bullish reversal pattern that now is forming on daily chart. We discuss this pattern all 4 or 5 weeks long. But since pattern has been completed we can try to trade it as well on lower time frames. Other part of our analysis stands the same.
Initially we’ve thought that this could become butterfly “buy” pattern, but it also could be “222” Buy, since if we’ve suggested that AB=CD has been completed and W&R really has happened, this could be double bottom. Also take a look, we have solid bullish divergence with MACD. By treating valleys as AB=CD pattern we’ll see that minor extension stands almost right at Yearly Pivot Point, and 1.618 extension stands slightly higher than Yearly PR1. This is really interesting agreement.
Daily
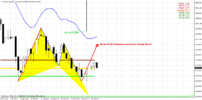
So, guys, the major event has happened here on Thursday, when price has erased bullish stop grabber and we’ve discussed this moment already. As price action has returned in a row with H&S pattern we will continue to keep an eye on it. Because right now is absolutely unclear – whether reversal still will happen or not. And I suspect this will be resolved only in last moment, when price will form the valley of right shoulder. Meantime, as we have bearish pattern on weekly chart and bearish trend here – we can try to take short-term bearish position with target around 1215-1220 where the bottom of right shoulder should appear. Friday action as you can see, mostly indicates indecision or pause after solid plunge. But retracement up that we’ve expected to get has happened already. Also current move up on weekly is a reversal swing after solid bearish action and we know that deep retracement usually happens right after reversal swings. Gold market has a habit to show 5/8 retracements, but also we can’t exclude action even to MPS1 at 1207, although I prefer to see the bottom around 1215-1220 to keep shape of pattern as perfect as possible.
B]4-hour[/B]
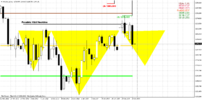
So, finally we’ve reached the time frame that probably will be major one for trading, at least in the beginning of the week. Partially we have discussed situation here, when talked on trading plan for Friday. Thus, Friday setup has been accomplished for 100% - we’ve expected 1250 retracement and we’ve got it. Simultaneously price has formed bearish stop grabber that suggests downward continuation. The same suggestion we’ve made based on AB=CD development. CD leg is much faster than AB and in most cases this assumes downward continuation to next target that stands 1220 area – 1.618 extension and Fib support. Current move up was also absolutely logical, since this is a reaction on AB=CD target and Agreement with Fib support. So, here situation is perfect even from theoretical point of view.
As we’ve estimated the target, now let’s find out where to enter. The major moment for us here is that main retracement has happened already, and current move down is a downward continuation to next target. That’s why we can’t count on the retracement of same depth. Even more – if such retracement will take place this will be worring sign for futher bearish development. Hence, our working swing for this position is the most recent swing down, i.e. bearish stop grabber candle.
1-hour
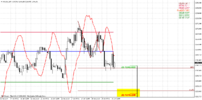
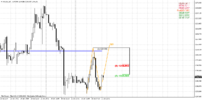
Here we still think that market should stay inside grabber’s swing and retracement should not out of it, but for some case I’ve drawn here possible AB-CD, since we have here some factor that makes overall situation a bit more complicated. This is WPP that stands right at invalidation point of stop grabber. Knowing the cunning of gold market, it is really possible that market could show light flirting around WPP and turn down again. But how it could be useful for us? Well, for stop loss placement. It should be placed slightly higher than AB-CD target, because most probably that we will search possibility for taking short position form 1248 Fib resistance.
Conclusion:
Upward action in big picture looks shy and not impressive. Weekly chart shows bearish engulfing pattern that probably will impact on market on coming week. But despite on all these moments market has not totally erased possibility of reversal yet. This will happen only if current lows around 1180 will be taking out.
In short term perspective we will stick with weekly pattern, especially because daily chart and intraday charts form patterns that confirm possible downward continuation. Thus, we will be short till 1210-1220 area in the beginning of the week and then we will start to search reversal patterns.
The technical portion of Sive's analysis owes a great deal to Joe DiNapoli's methods, and uses a number of Joe's proprietary indicators. Please note that Sive's analysis is his own view of the market and is not endorsed by Joe DiNapoli or any related companies.
Gold fell on Friday, notching its first weekly drop in six due to strong U.S. economic growth, concerns over the U.S. Federal Reserve's withdrawal of monetary stimulus and a slump in Chinese demand. Bullion had gained for most of January until this week, underpinned by weakness in global equities on concerns over emerging economies. But upbeat U.S. growth data reassured investors worried about capital outflows from emerging markets and also validated the Fed's decision this week to reduce its monthly bond purchases to $65 billion from $75 billion, as expected. "You have strength of the dollar against emerging markets currencies, and that's negative for gold," Quantitative Commodity Research owner Peter Fertig said. "Fears that it may lead to widespread crisis are currently sending shivers through the stock markets," Fertig added. The metal posted a 2 percent loss for the week, after five straight weeks of gains. But January's early strength was enough to push gold to its first monthly rise in five, up more than 3 percent so far. "The uptrend since late 2013 is on thin ice, and we think if we don’t see a quick snapback, more testing could be in store," said Mark Arbeter, chief technical strategist at S&P Capital IQ in New York.
CHINA HOLIDAY WEIGHS
Gold was also missing the support of physical demand as the world's number one buyer China has gone into a one-week break.
Among other precious metals, platinum posted a 4 percent drop this week for a second straight weekly fall despite strikes at South African mines that have hit about 40 percent of global output. It was down 0.4 percent at $1,372.75 on the day.
Silver was down 3.5 percent for the week for its biggest weekly drop since late November. It was up 0.2 percent on the day at $19.16 an ounce. Palladium fell 0.4 percent to $701.72 an ounce.
Monthly
Just on previous week we’ve discussed how it could become important to get clear bullish engulfing pattern here. But right at the last week of January upward candle has diminished twice in size. Market has erased almost 50% of upward January action. As result we’ve got much shyer engulfing pattern that in fact, stands at the edge to be called as “englfing”. Still, as we’ve said that our invalidation point is previous lows – let’s see. Chances on upward action still exist here.
Trend holds bearish. Appearing of 1361 Yearly PP could get special meaning from possible retracement point of view. It could become possible nearest upside target. Yearly PR1 is also very significant. We know that gold likes to re-test previously broken lows and consolidations. 1540 area is monthly overbought, YPR1 and low border of broken long-term rectangle. As market was strongly oversold, why it can’t reach overbought? This is very typical action for any market.
As another application of significantly oversold we’ve suggested retracement up. Thus, we’ve made an assumption of possible deeper upward retracement that could take a shape of AB=CD, and invalidation for this setup is previous lows around 1170s. In fact current move up could be the last chance for possible upward bounce, if, say, market will show something like double bottom. Currently price action is very suitable for that – W&R of first bottom. This action in general is very typical for double bottoms and fake breakout could be the first sign of possible retracement up. Bearish market has no other reasons to stop right here, since there is no support right now – it has passed through 3/8 support, it’s not at oversold. Currently we should keep a close eye on move up.
At the same time fundamental data, seasonal trend, physical demand do not quite support upward action, at least right now. May be a bit later situation will change, but market will enter seasonal bearish trend in February and it will be even more difficult to continue move higher.

Weekly
Trend has shifted bullish here. As S&P analysts correctly said – “upward action stands on a thin ice”. Previously we also have mentioned that upward action looks not very impressive and now we’ve got bearish engulfing as addition to this. This is not very good to see such pattern right at January MPR1 and after anemic upward action, but still, this pattern does not break yet chances on upward continuation and could become a part of larger bullish reversal pattern that now is forming on daily chart. We discuss this pattern all 4 or 5 weeks long. But since pattern has been completed we can try to trade it as well on lower time frames. Other part of our analysis stands the same.
Initially we’ve thought that this could become butterfly “buy” pattern, but it also could be “222” Buy, since if we’ve suggested that AB=CD has been completed and W&R really has happened, this could be double bottom. Also take a look, we have solid bullish divergence with MACD. By treating valleys as AB=CD pattern we’ll see that minor extension stands almost right at Yearly Pivot Point, and 1.618 extension stands slightly higher than Yearly PR1. This is really interesting agreement.

Daily
So, guys, the major event has happened here on Thursday, when price has erased bullish stop grabber and we’ve discussed this moment already. As price action has returned in a row with H&S pattern we will continue to keep an eye on it. Because right now is absolutely unclear – whether reversal still will happen or not. And I suspect this will be resolved only in last moment, when price will form the valley of right shoulder. Meantime, as we have bearish pattern on weekly chart and bearish trend here – we can try to take short-term bearish position with target around 1215-1220 where the bottom of right shoulder should appear. Friday action as you can see, mostly indicates indecision or pause after solid plunge. But retracement up that we’ve expected to get has happened already. Also current move up on weekly is a reversal swing after solid bearish action and we know that deep retracement usually happens right after reversal swings. Gold market has a habit to show 5/8 retracements, but also we can’t exclude action even to MPS1 at 1207, although I prefer to see the bottom around 1215-1220 to keep shape of pattern as perfect as possible.

B]4-hour[/B]
So, finally we’ve reached the time frame that probably will be major one for trading, at least in the beginning of the week. Partially we have discussed situation here, when talked on trading plan for Friday. Thus, Friday setup has been accomplished for 100% - we’ve expected 1250 retracement and we’ve got it. Simultaneously price has formed bearish stop grabber that suggests downward continuation. The same suggestion we’ve made based on AB=CD development. CD leg is much faster than AB and in most cases this assumes downward continuation to next target that stands 1220 area – 1.618 extension and Fib support. Current move up was also absolutely logical, since this is a reaction on AB=CD target and Agreement with Fib support. So, here situation is perfect even from theoretical point of view.
As we’ve estimated the target, now let’s find out where to enter. The major moment for us here is that main retracement has happened already, and current move down is a downward continuation to next target. That’s why we can’t count on the retracement of same depth. Even more – if such retracement will take place this will be worring sign for futher bearish development. Hence, our working swing for this position is the most recent swing down, i.e. bearish stop grabber candle.

1-hour
Here we still think that market should stay inside grabber’s swing and retracement should not out of it, but for some case I’ve drawn here possible AB-CD, since we have here some factor that makes overall situation a bit more complicated. This is WPP that stands right at invalidation point of stop grabber. Knowing the cunning of gold market, it is really possible that market could show light flirting around WPP and turn down again. But how it could be useful for us? Well, for stop loss placement. It should be placed slightly higher than AB-CD target, because most probably that we will search possibility for taking short position form 1248 Fib resistance.

Conclusion:
Upward action in big picture looks shy and not impressive. Weekly chart shows bearish engulfing pattern that probably will impact on market on coming week. But despite on all these moments market has not totally erased possibility of reversal yet. This will happen only if current lows around 1180 will be taking out.
In short term perspective we will stick with weekly pattern, especially because daily chart and intraday charts form patterns that confirm possible downward continuation. Thus, we will be short till 1210-1220 area in the beginning of the week and then we will start to search reversal patterns.
The technical portion of Sive's analysis owes a great deal to Joe DiNapoli's methods, and uses a number of Joe's proprietary indicators. Please note that Sive's analysis is his own view of the market and is not endorsed by Joe DiNapoli or any related companies.
Last edited:


