Admiral Markets
AdmiralMarkets.com Representative
- Messages
- 95
Impact of FED’s Rate Hike on Forex Market
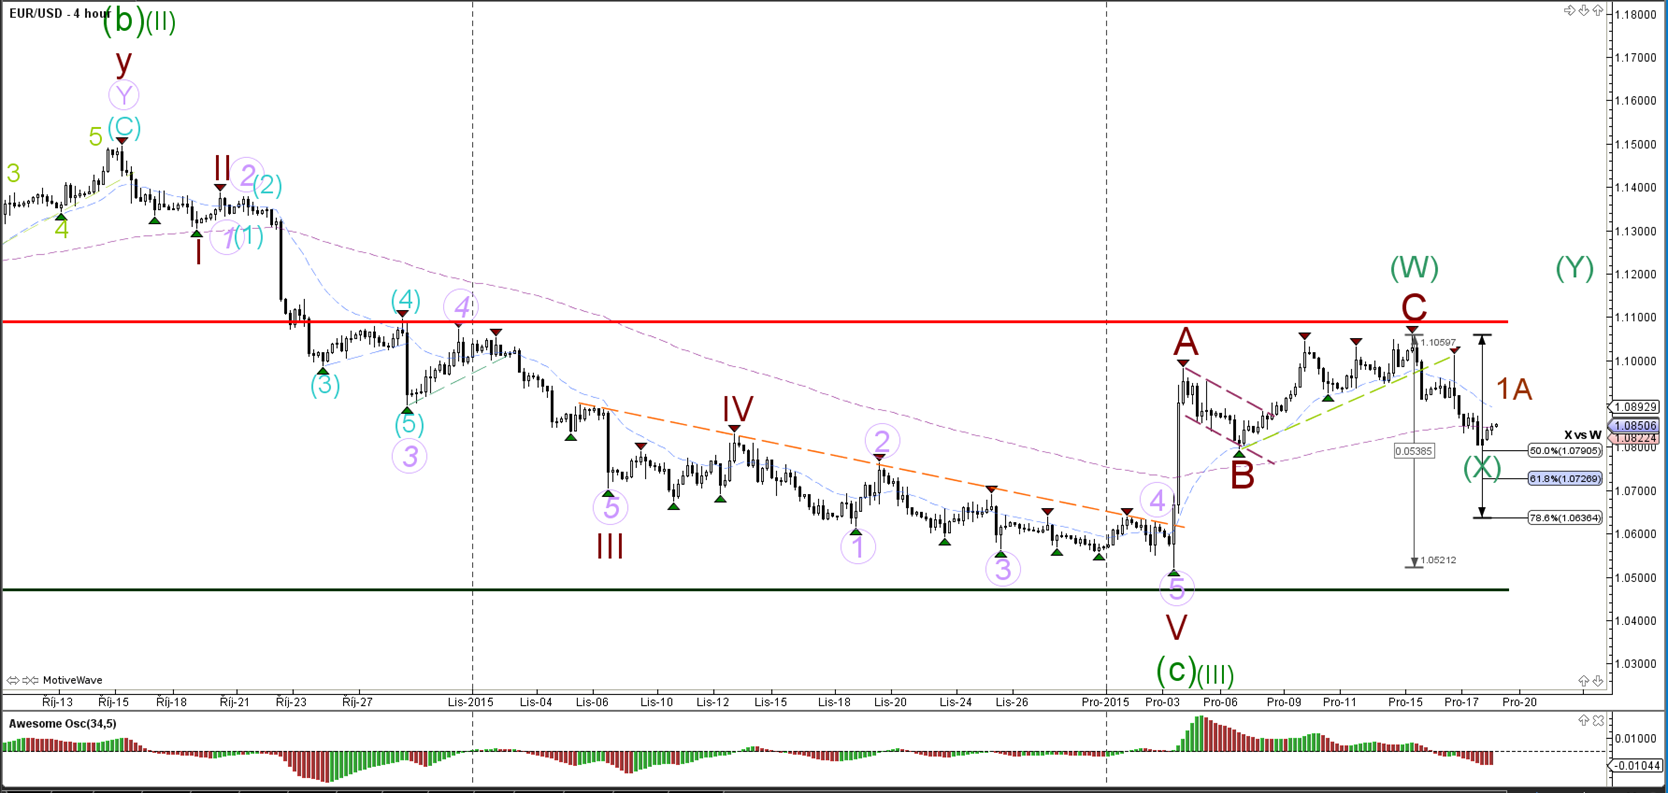
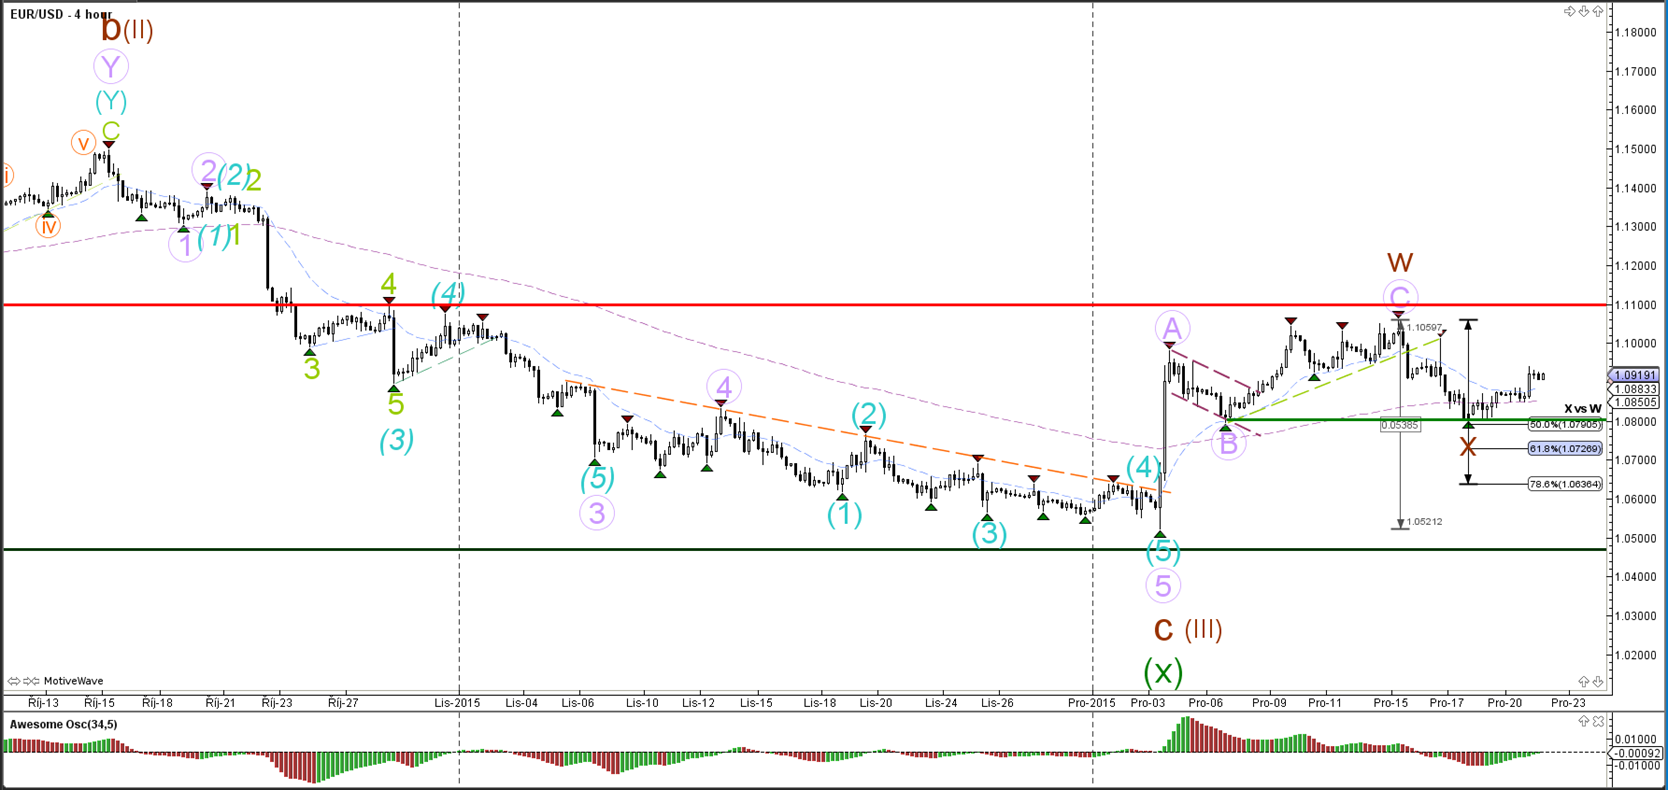
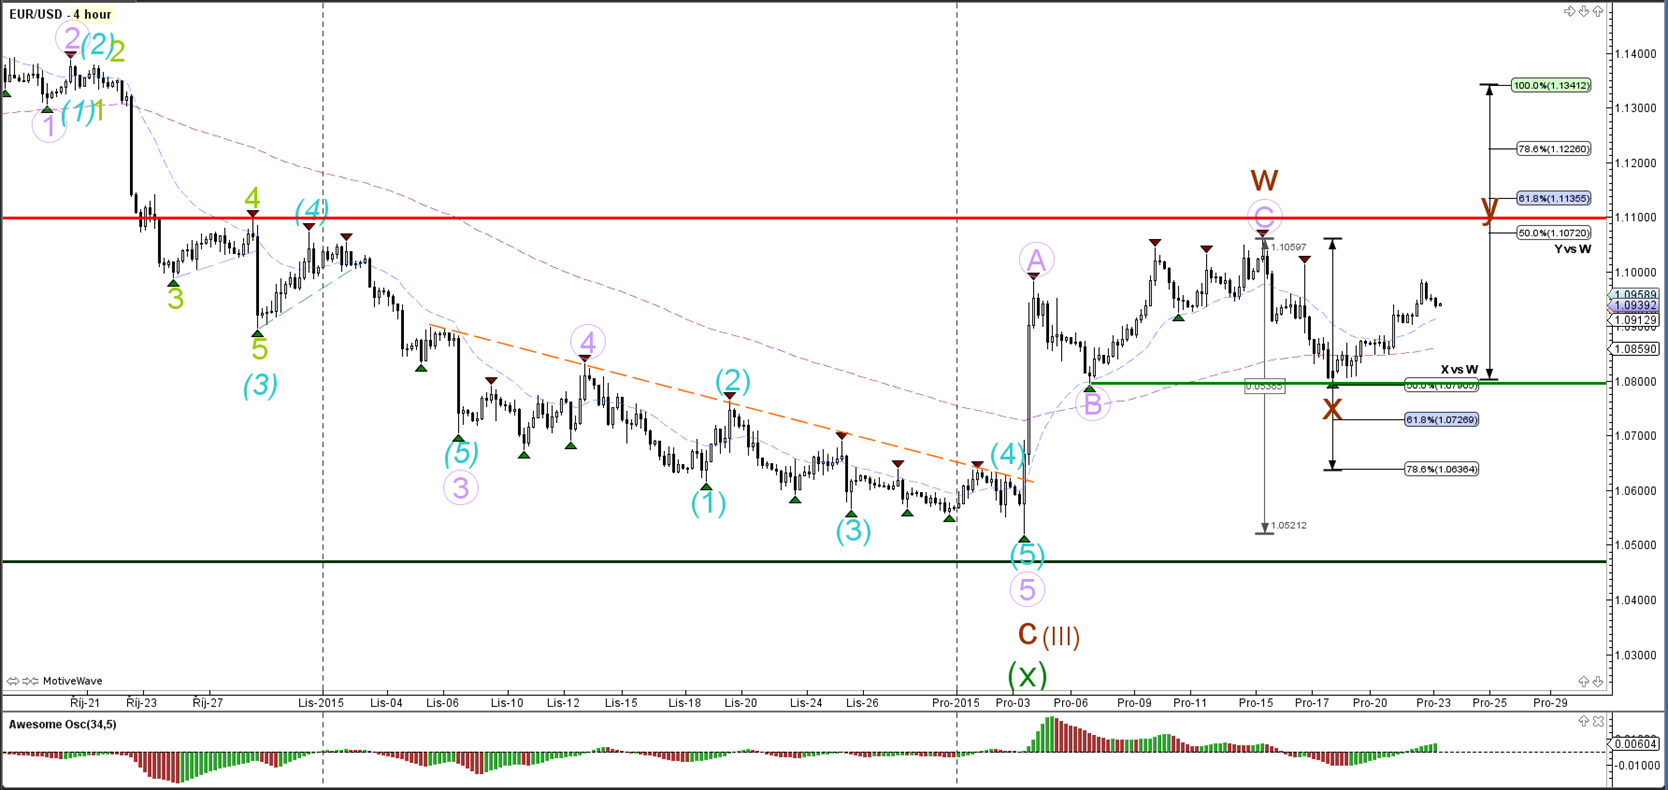
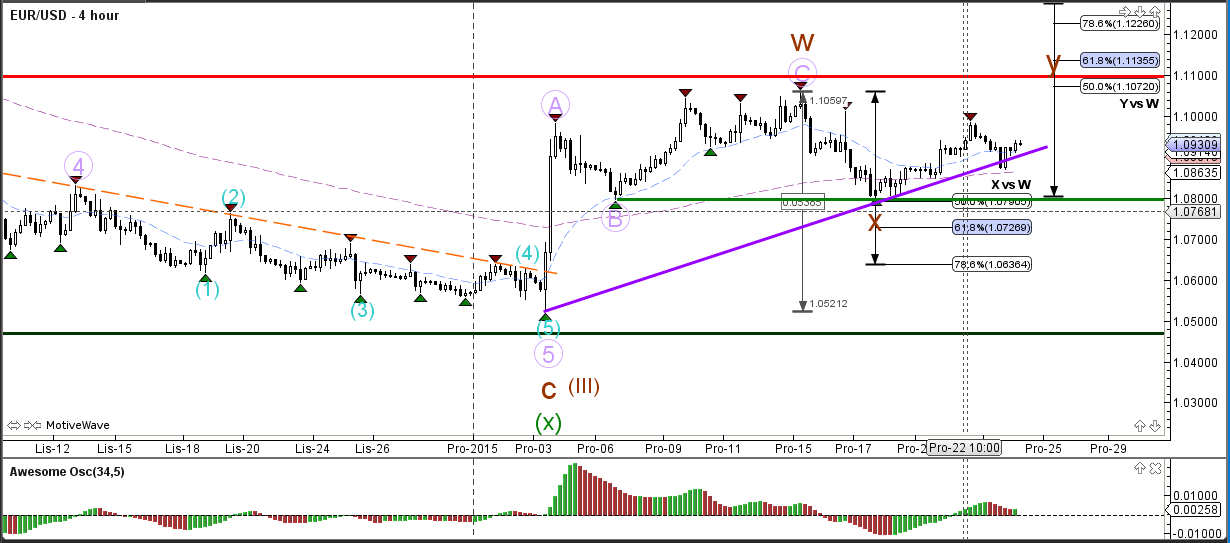
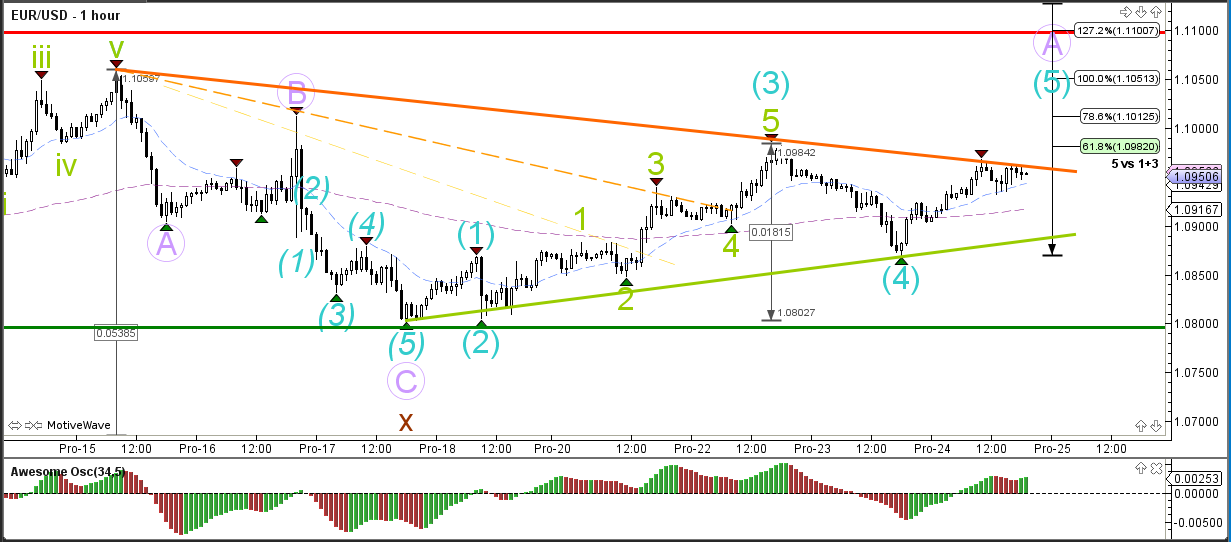
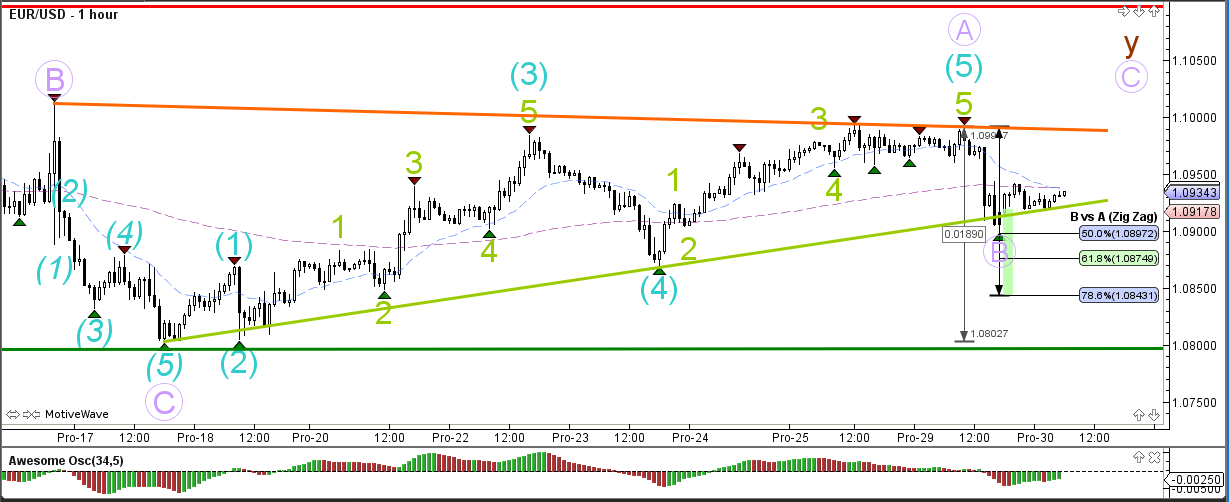
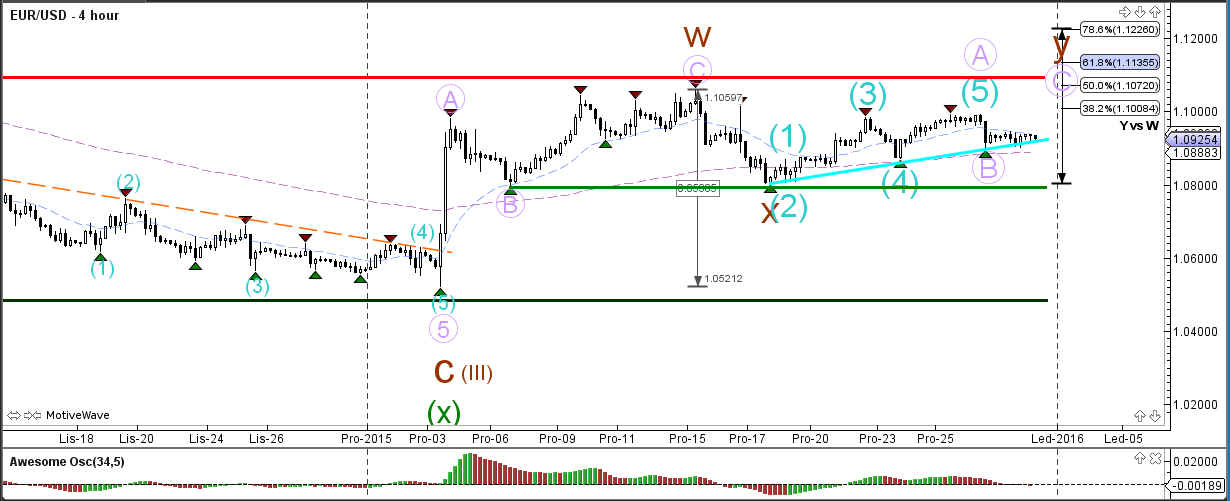
EUR/USD
4 hour

The FED's decision to increase interest rates in the US caused lots of volatility in the market. The EUR/USD moved lower eventually during the news but price is still far away from the current year low. For the moment I am not expecting price to break below this year's low (green line) and hence the wave count is now showing a wave X retracement (green).
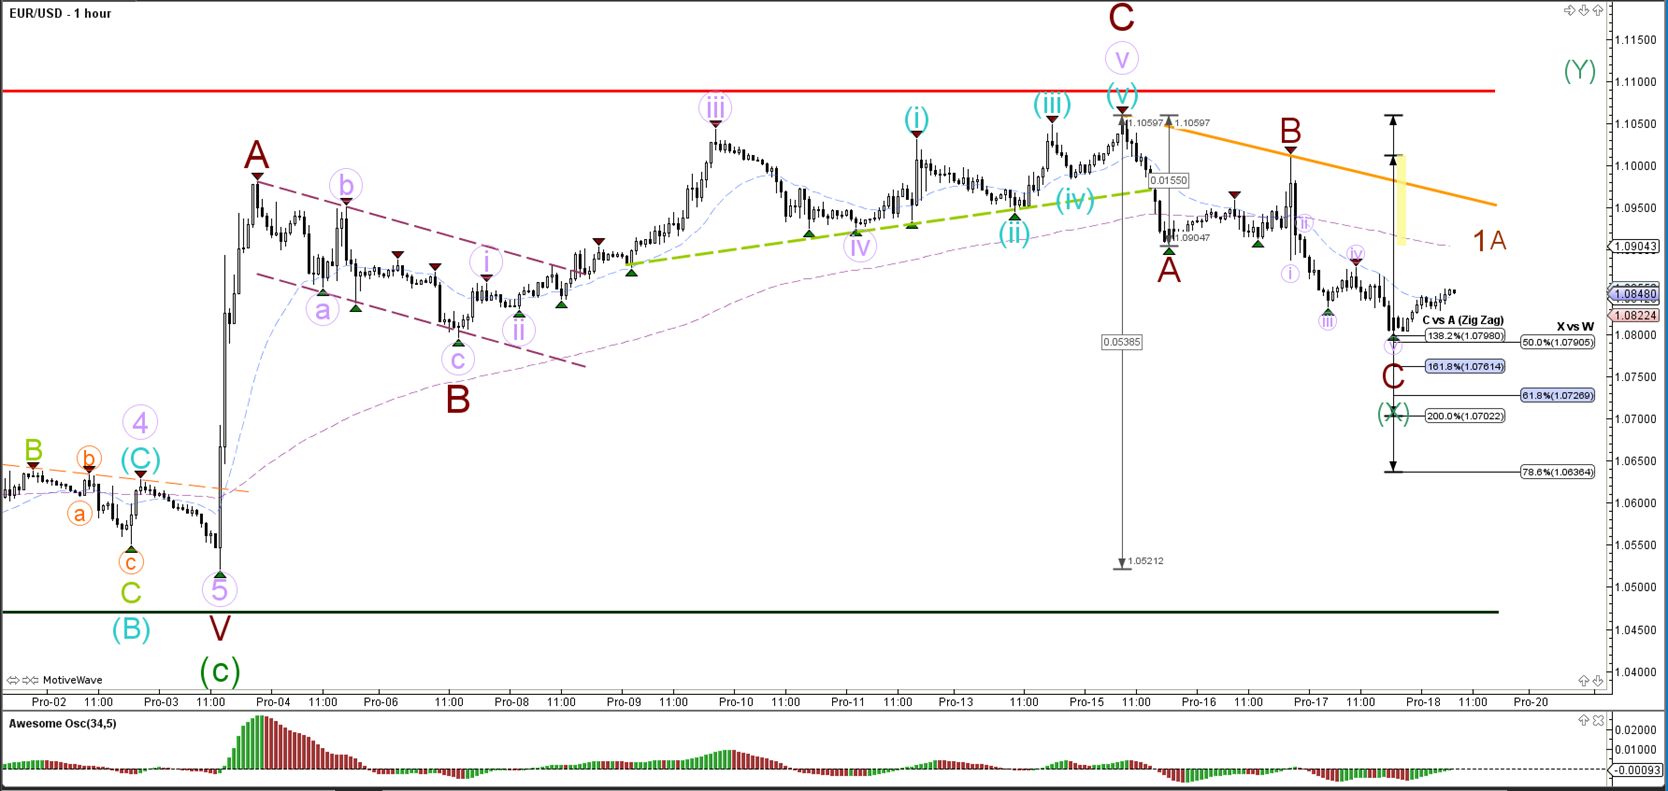
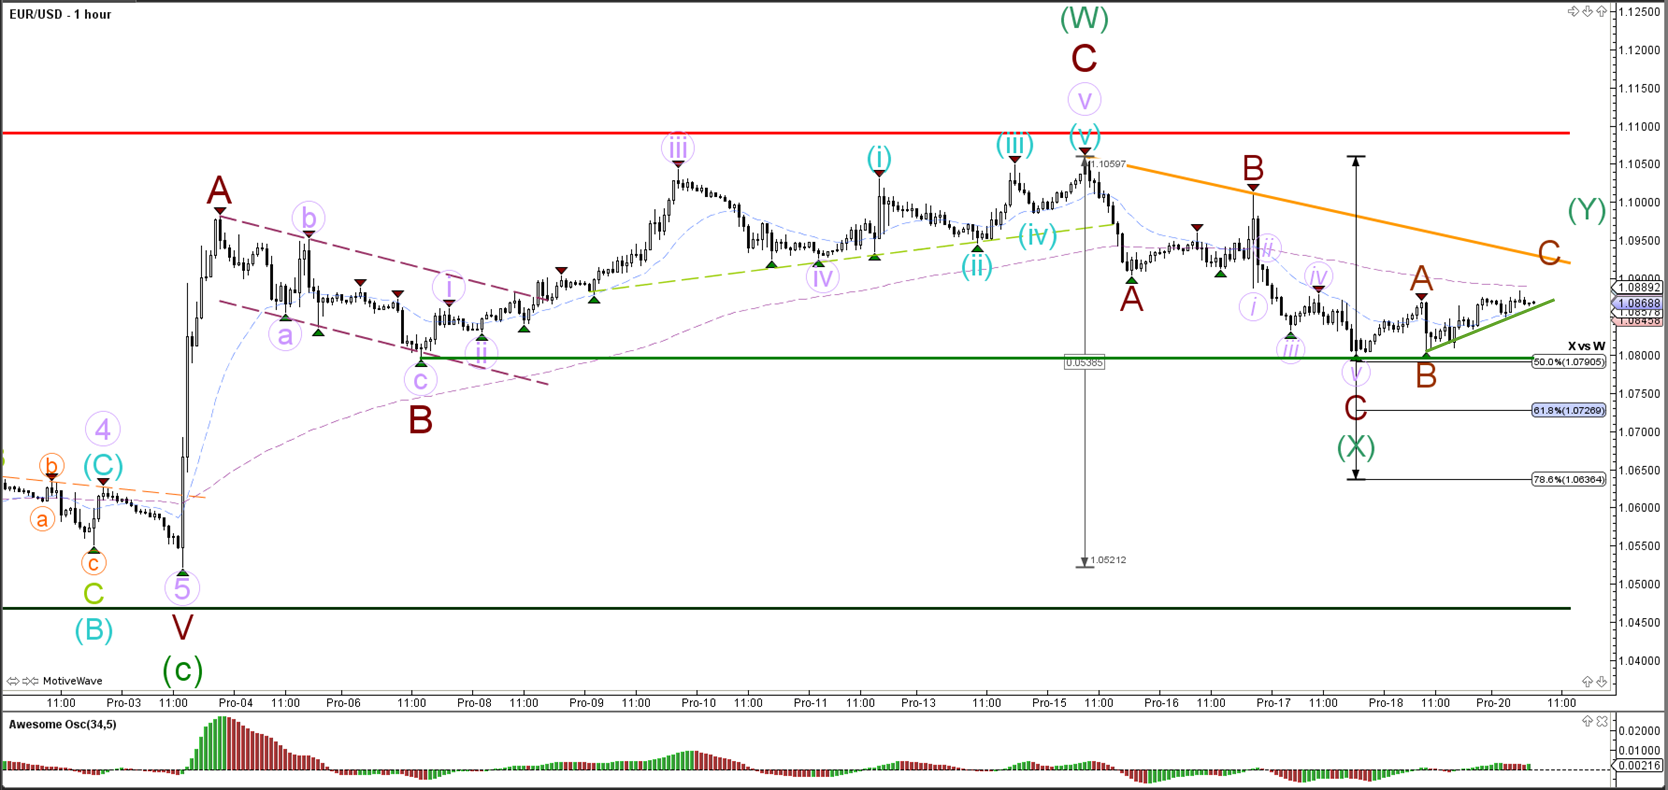
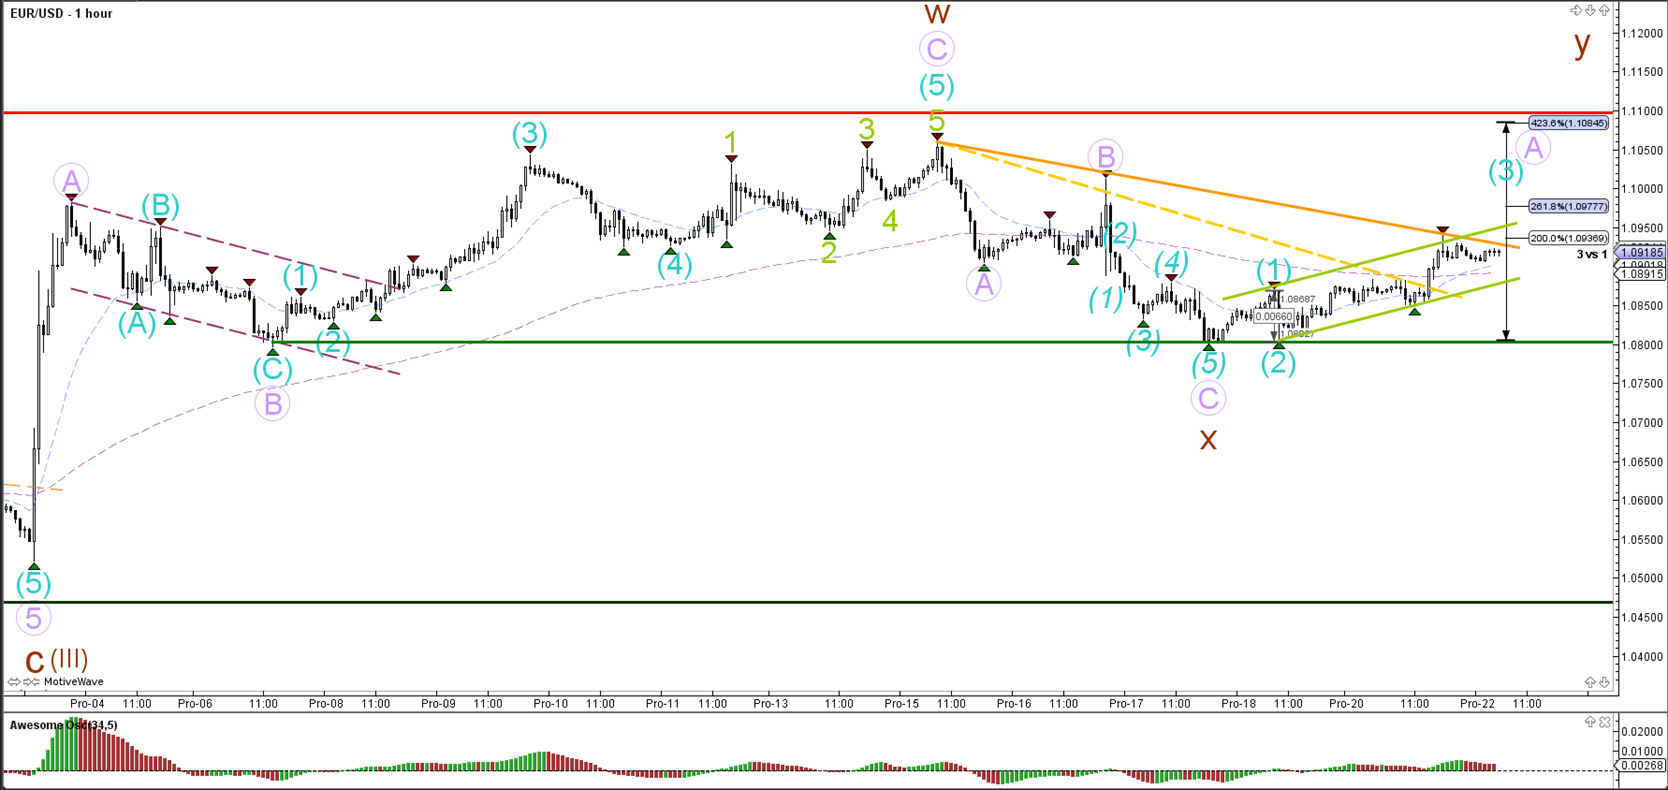
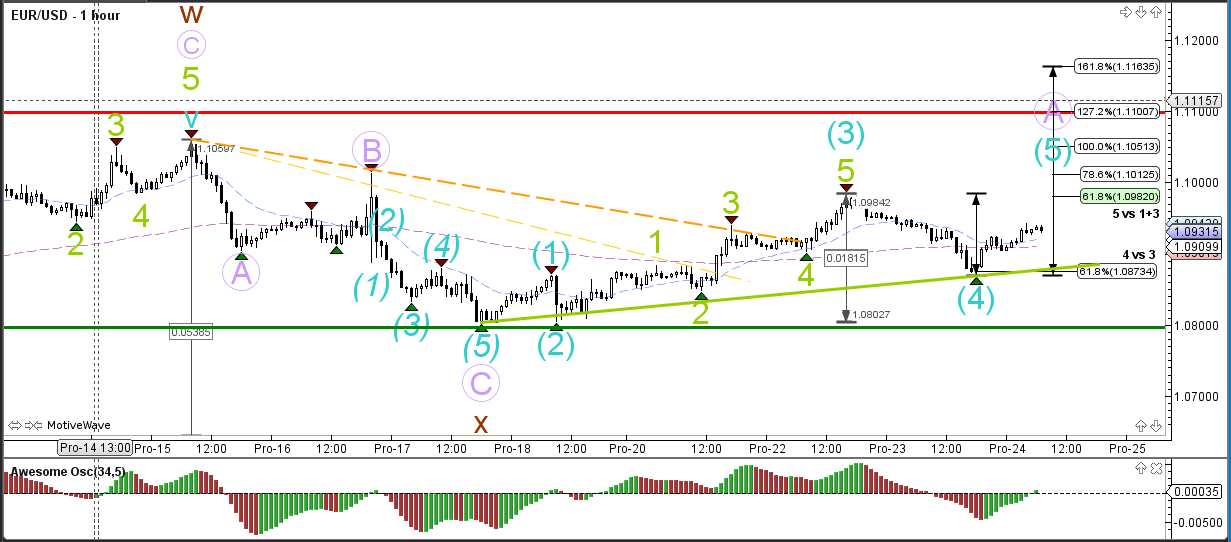
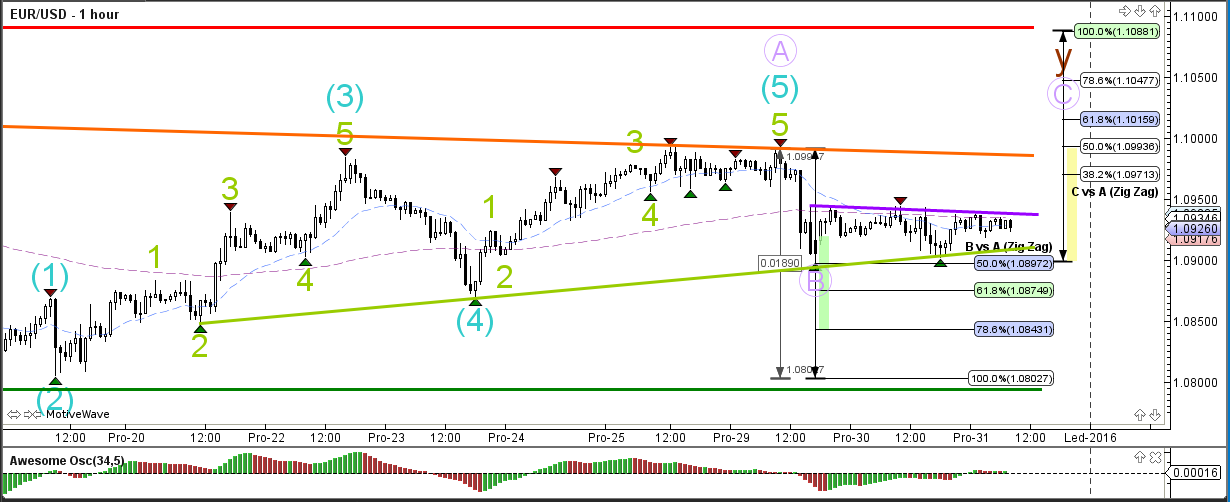
1 hour
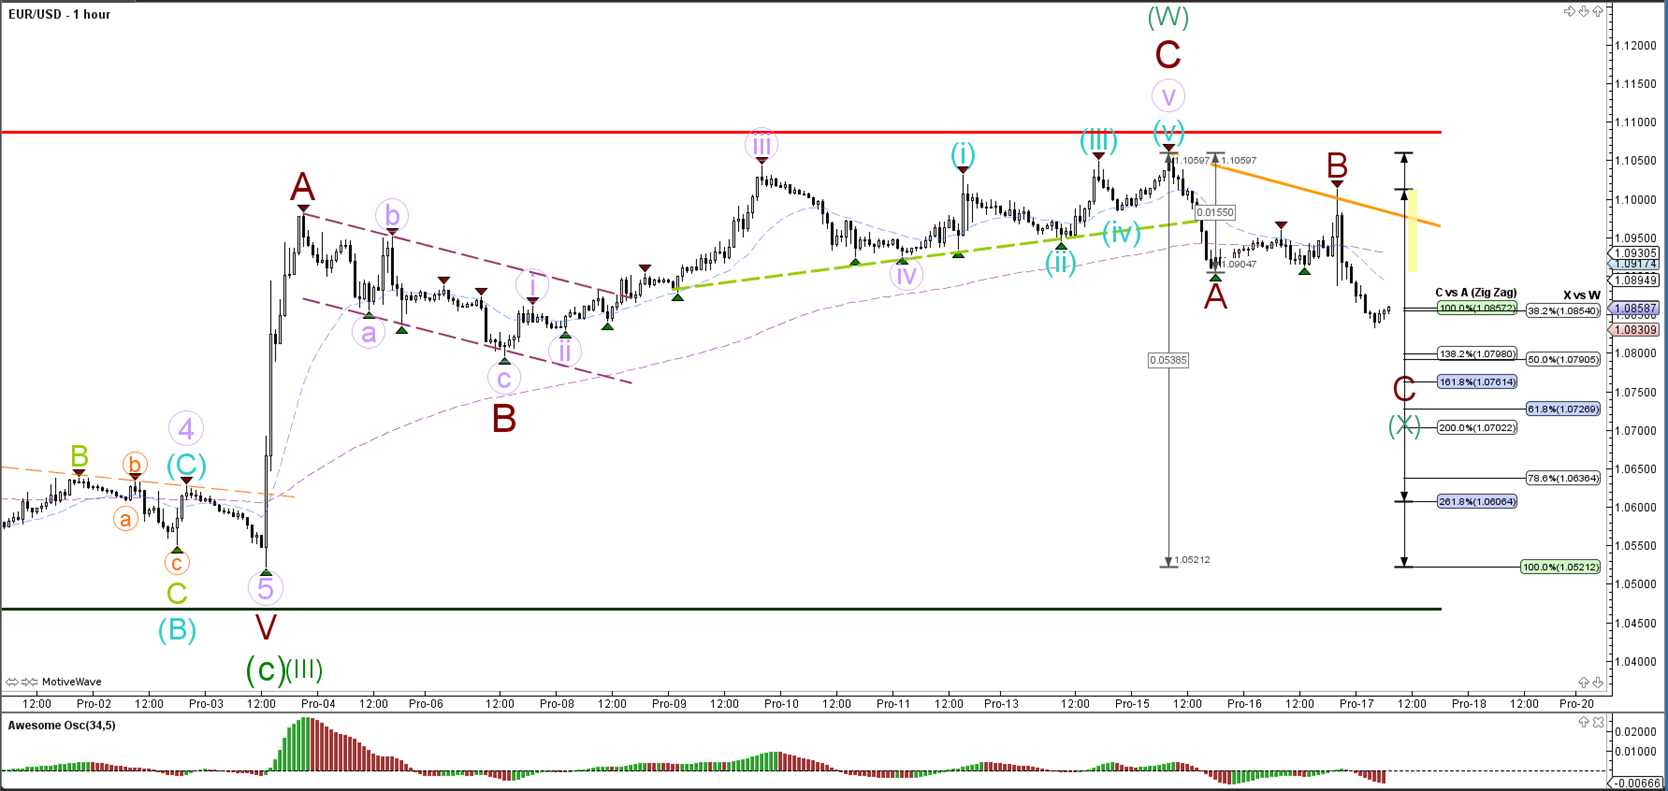
The EUR/USD bearish price action has been slow and therefore the wave count is showing an ABC zigzag rather than a 123 (brown).
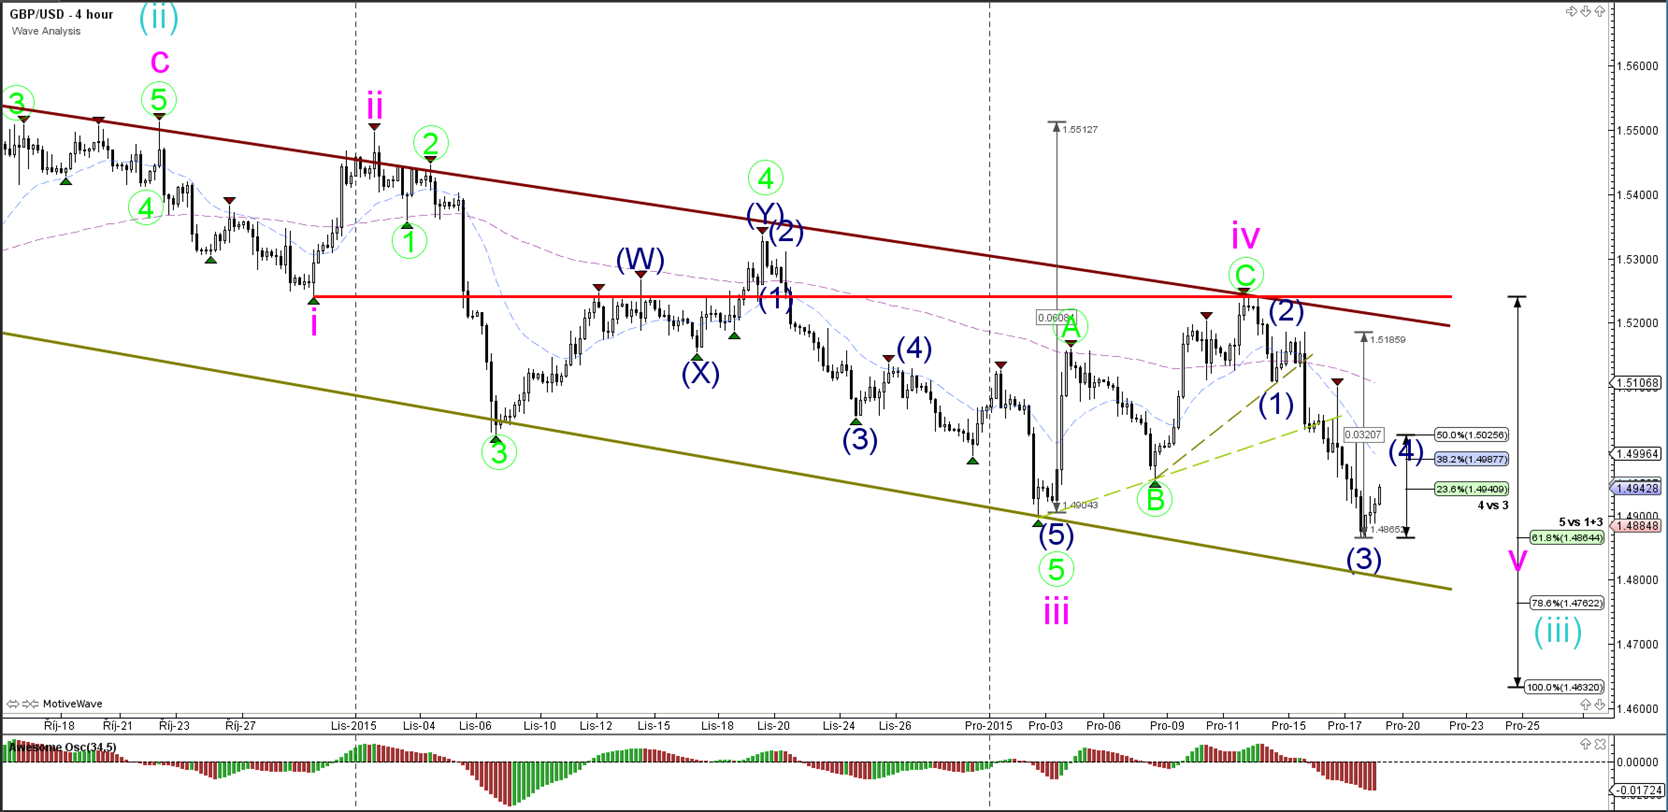
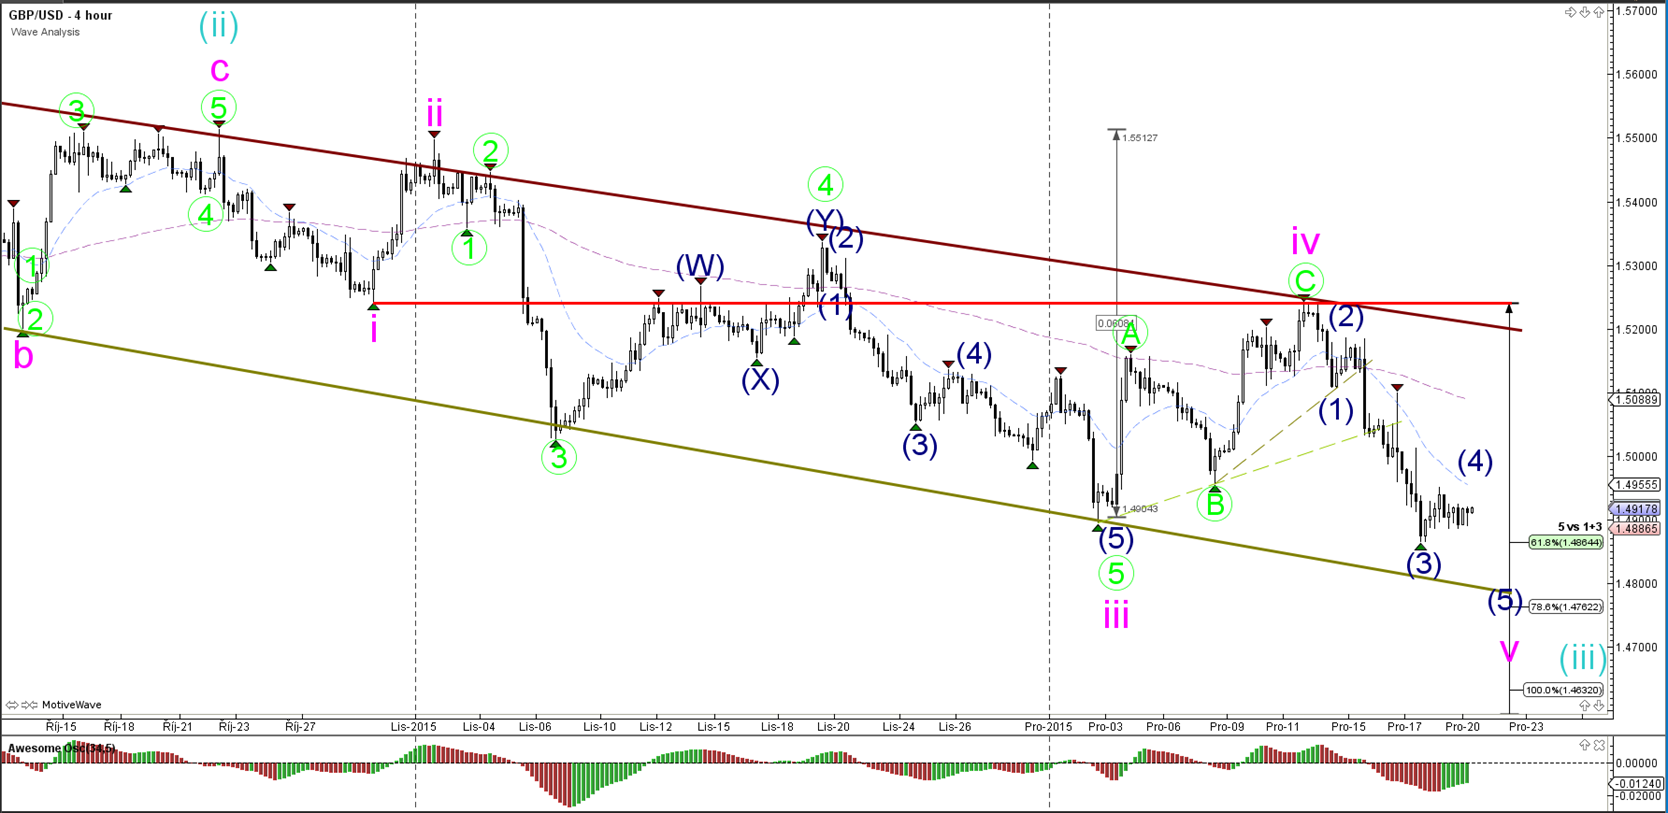
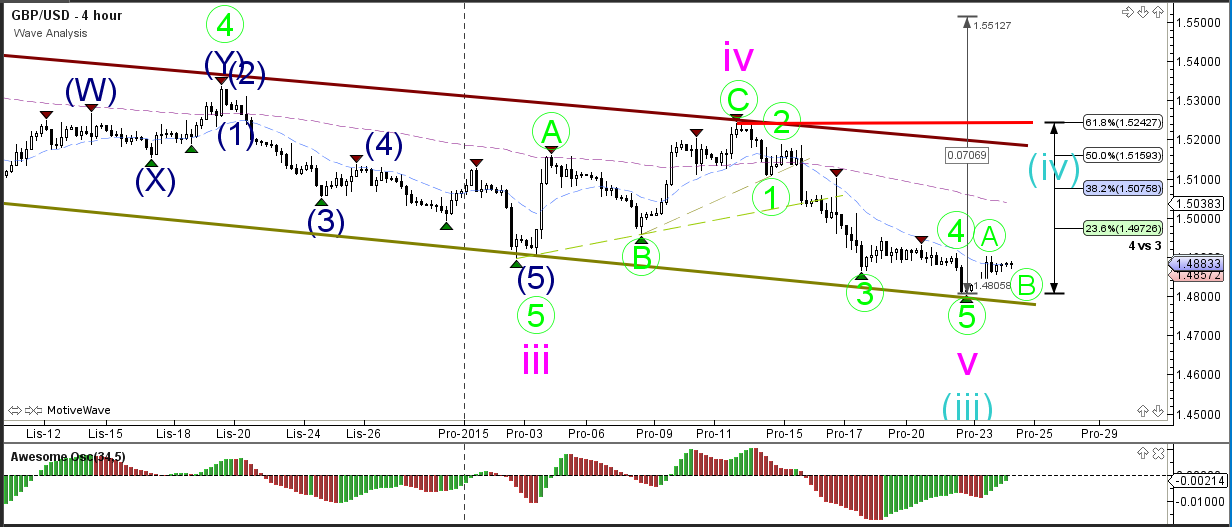
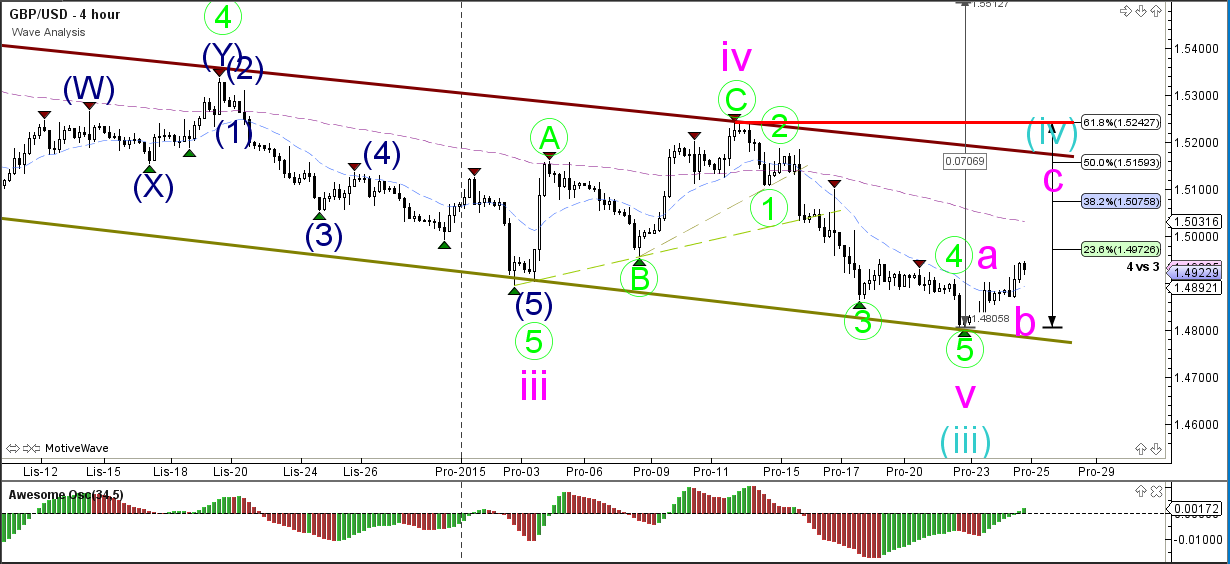
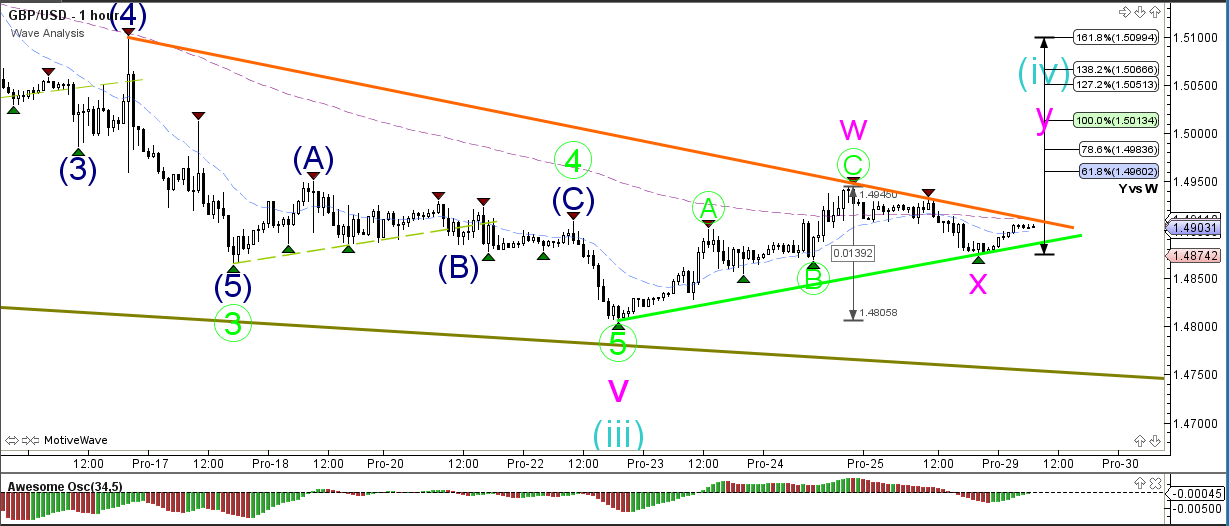
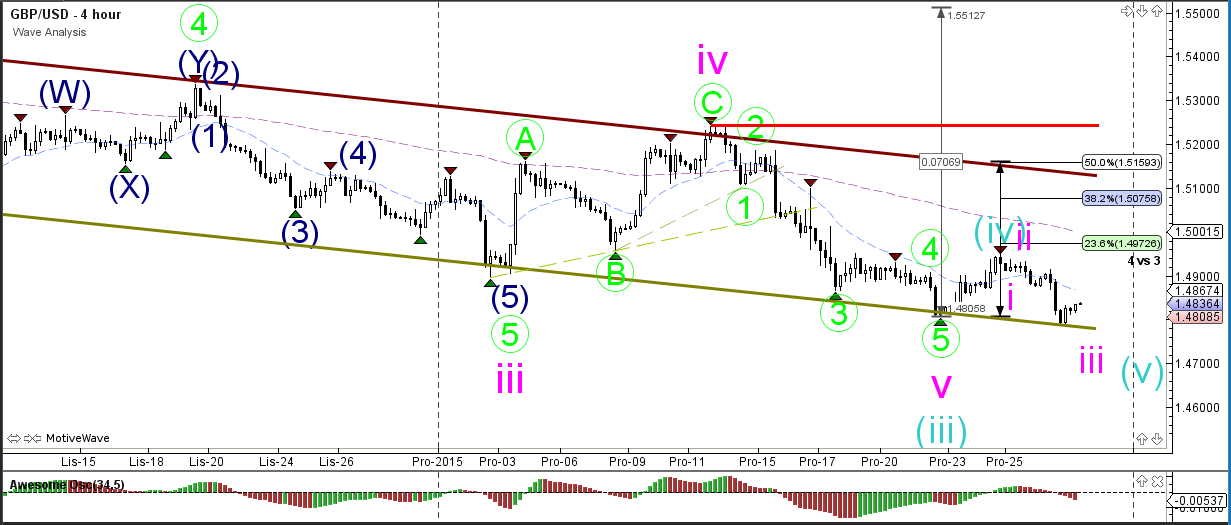
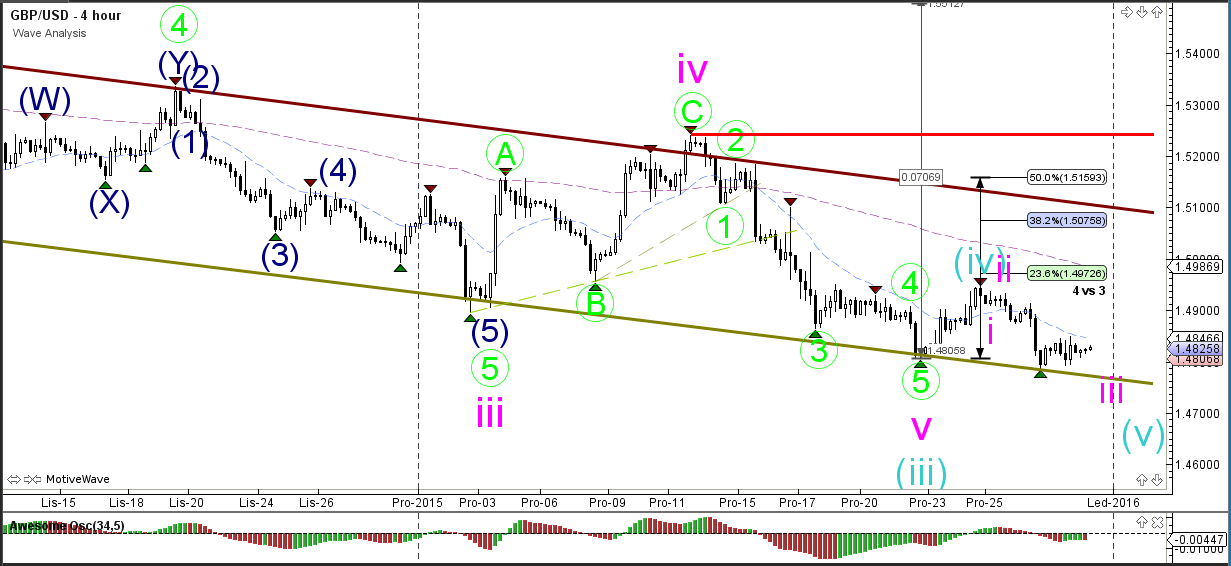
GBP/USD
4 hour

The FED's decision to increase interest rates in the US caused lots of volatility in the market but the GBP/USD has managed to make a bearish turn at the top of the channel and is now breaking below support within the downtrend channel.
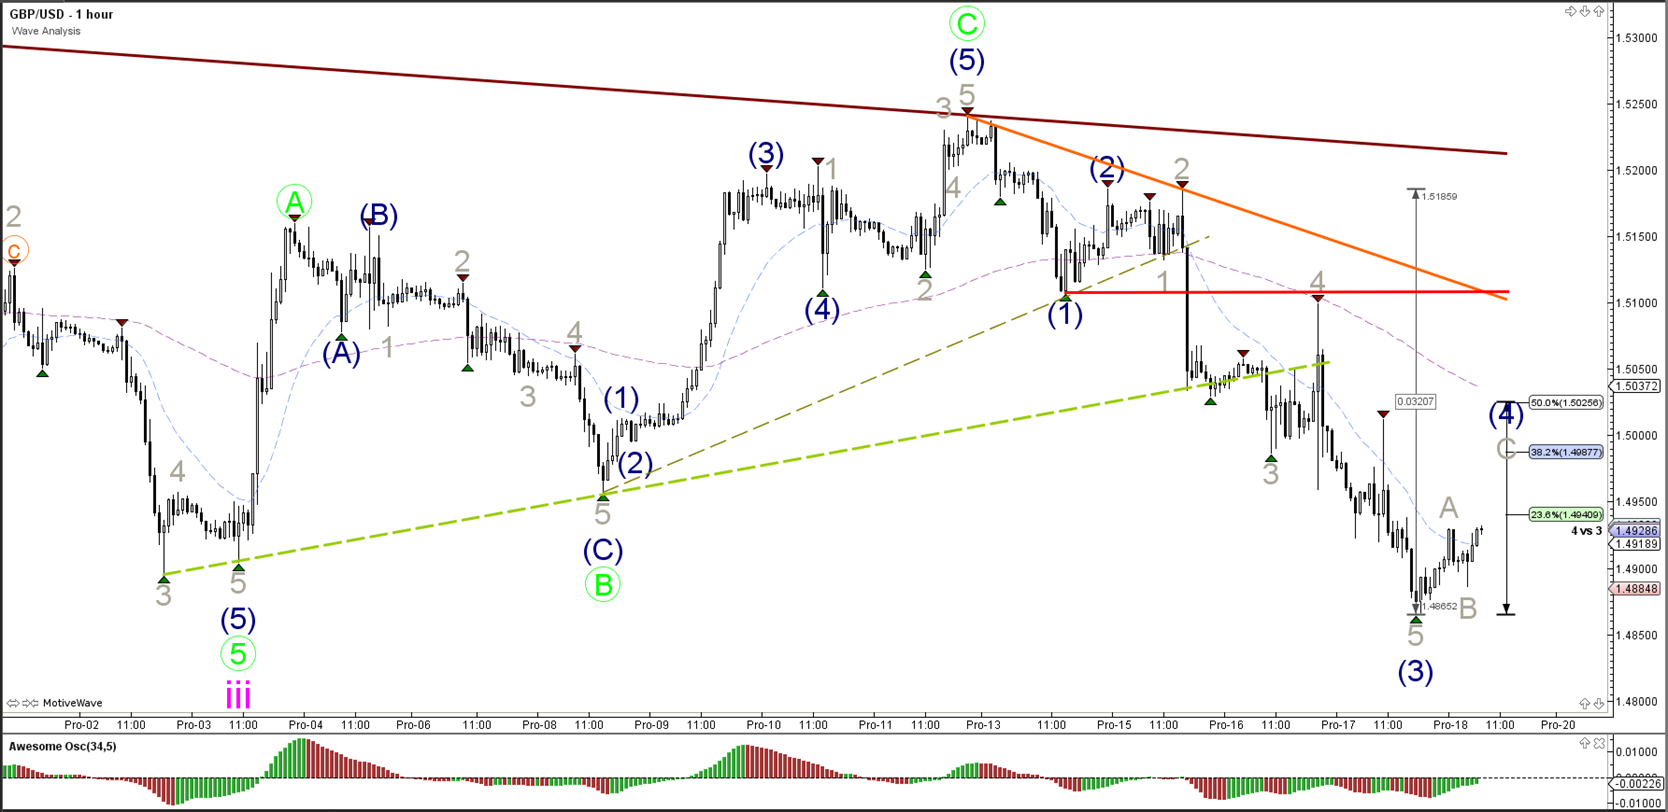
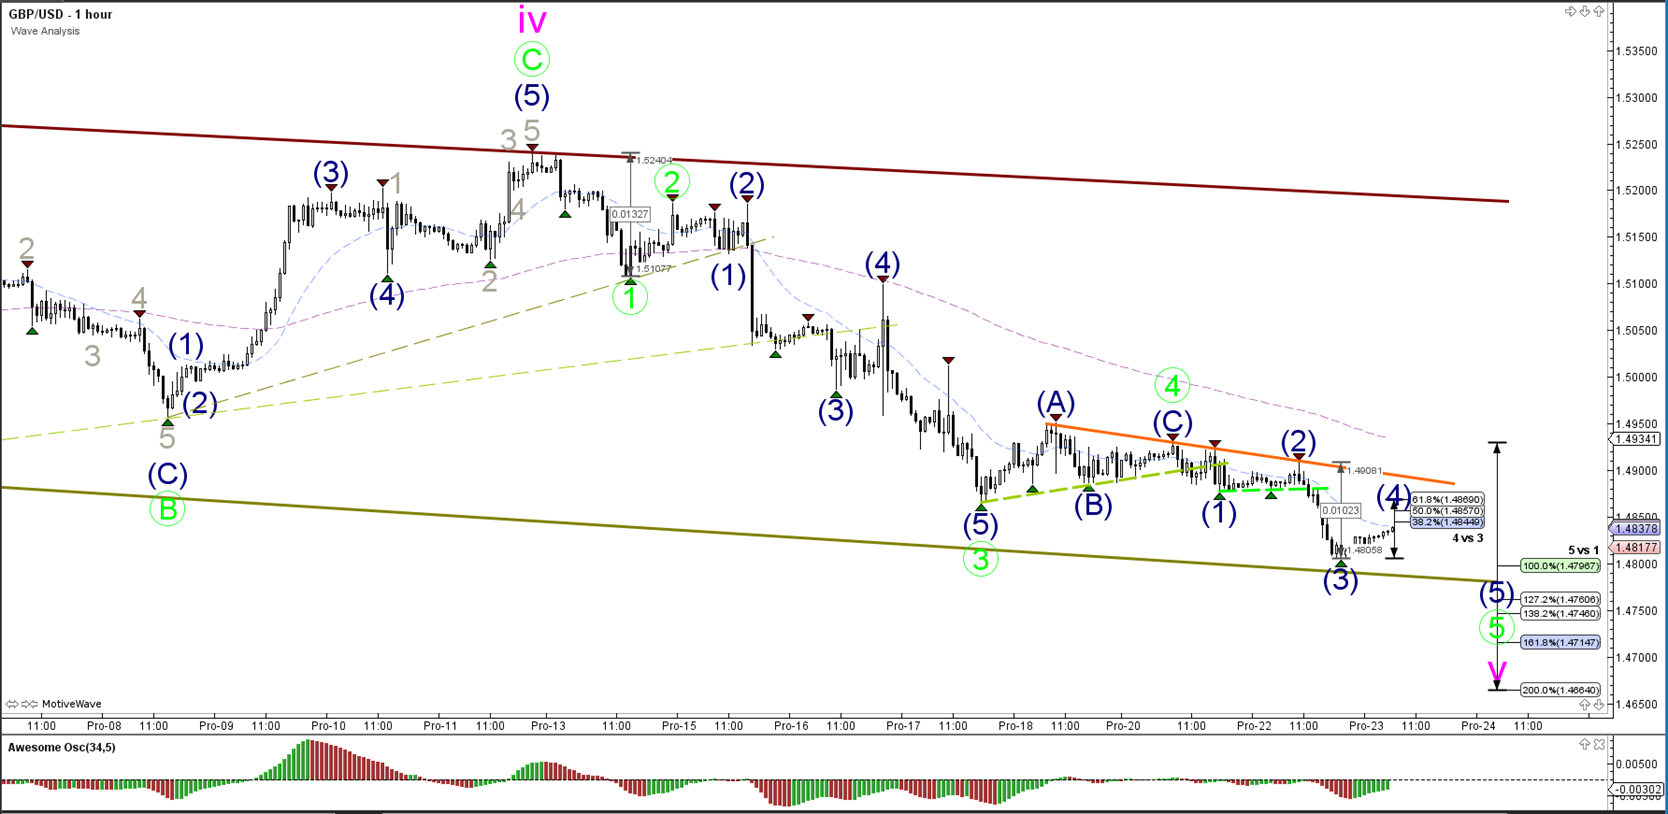
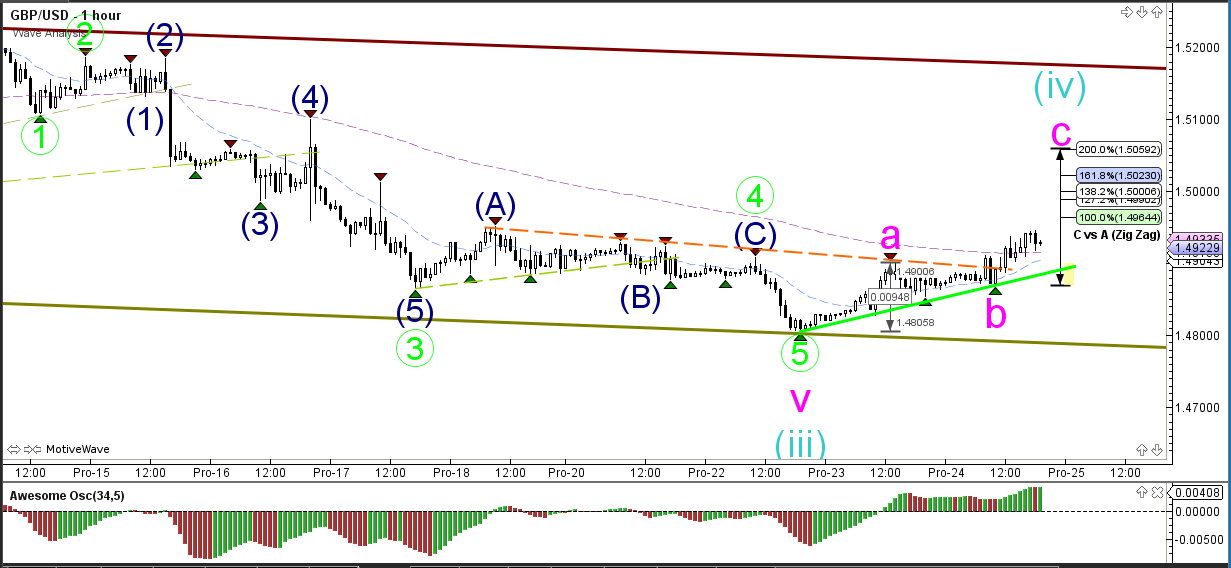
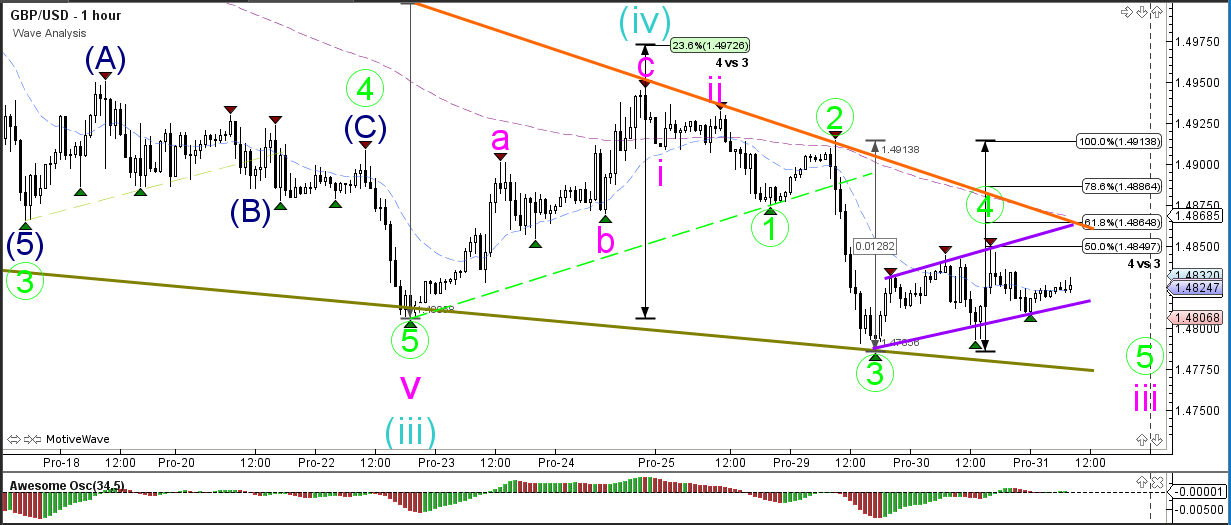
1 hour
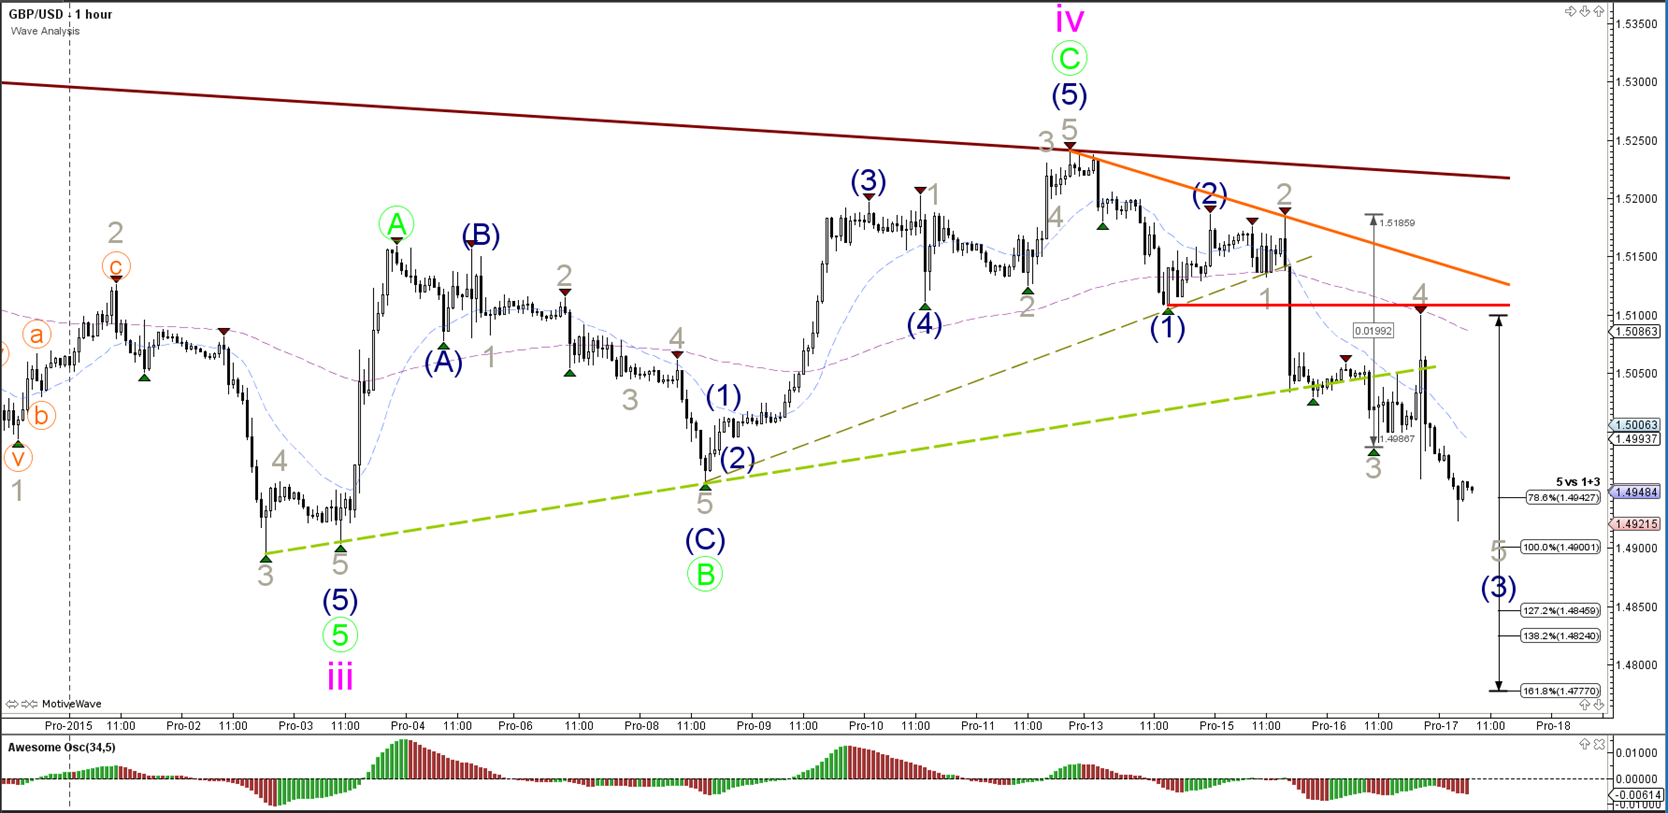
The GBP/USD broke below the support trend line (dotted green) and is moving lower to the targets of wave 5 (blue) of wave 3 (grey).
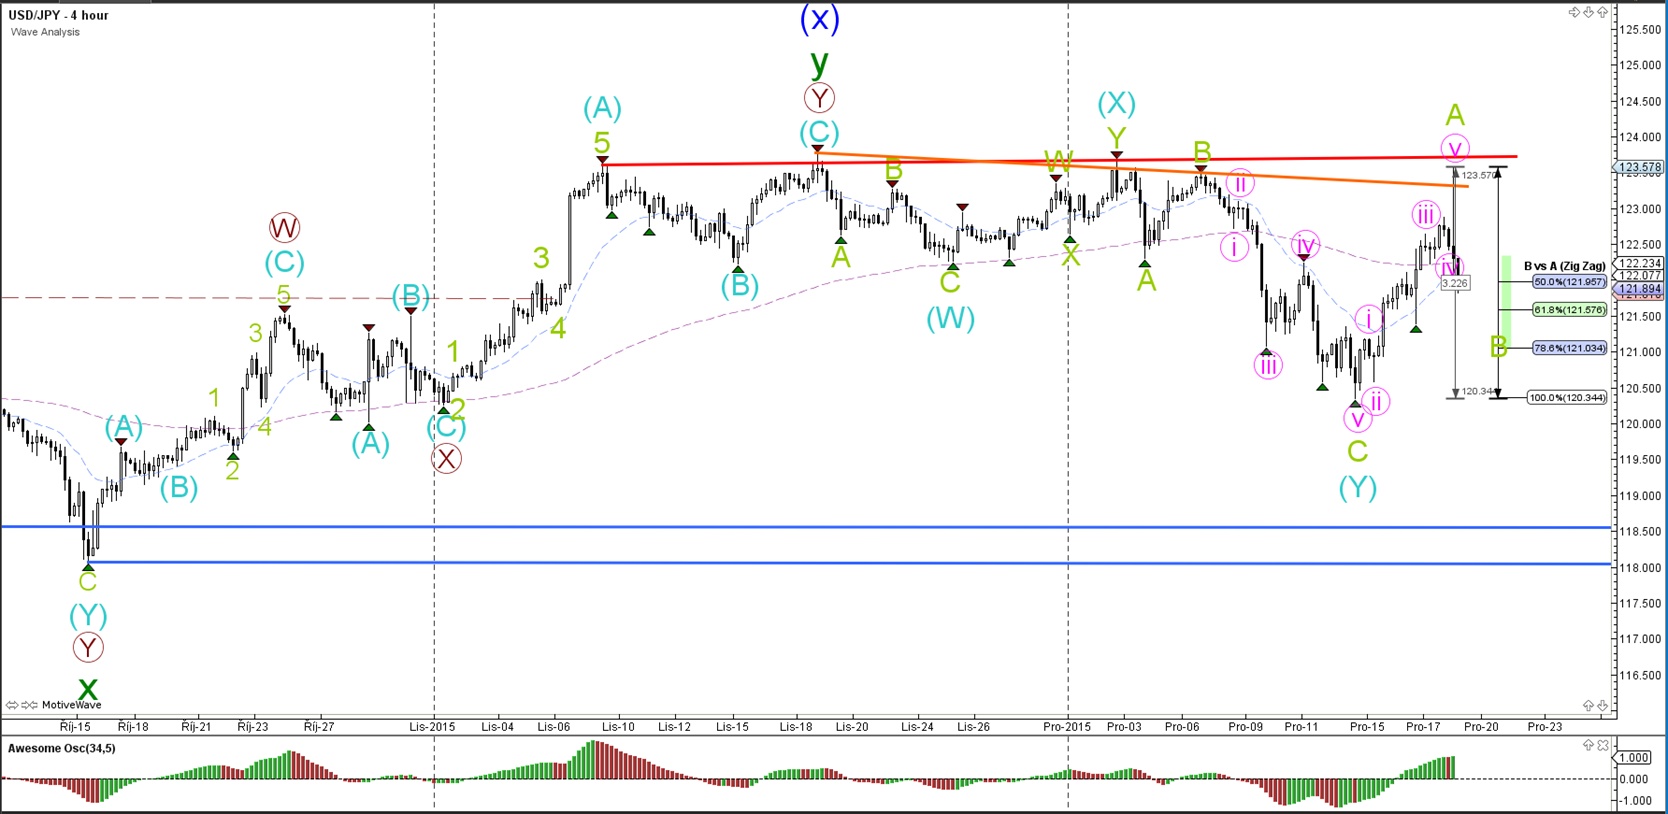
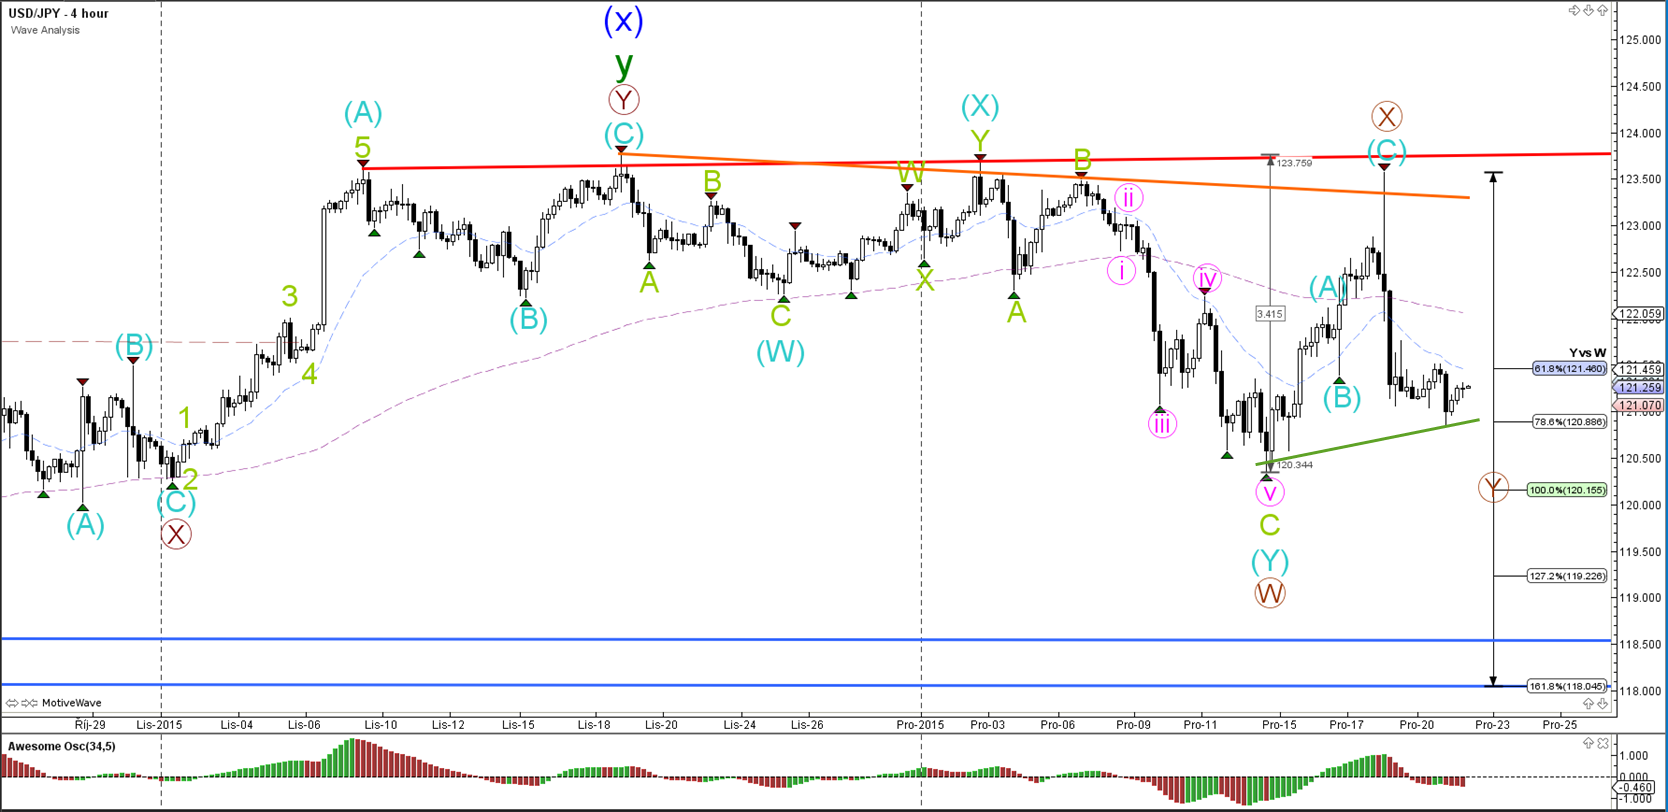
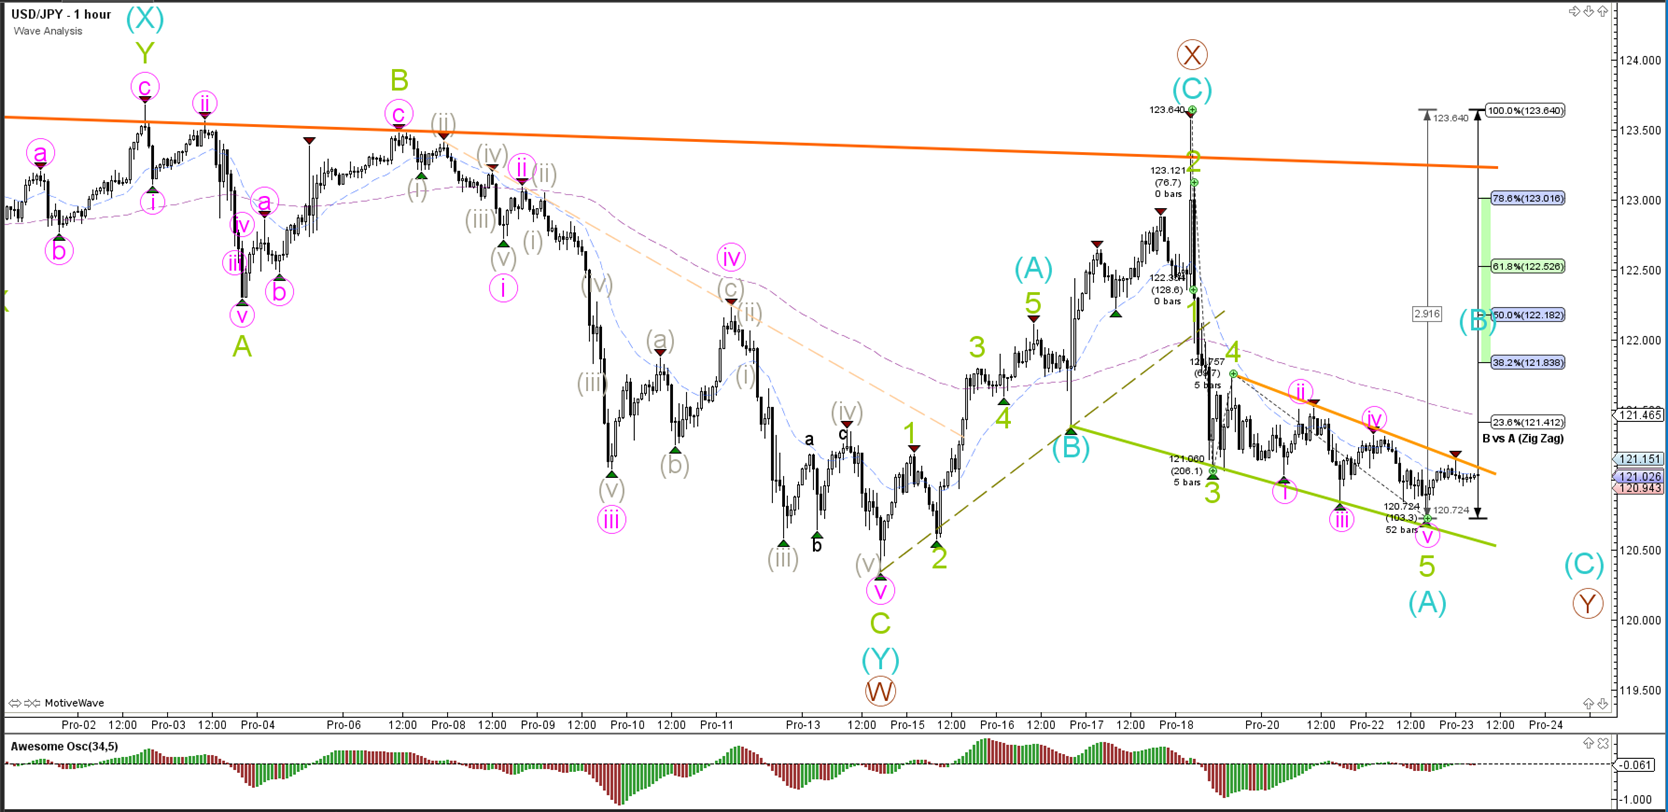
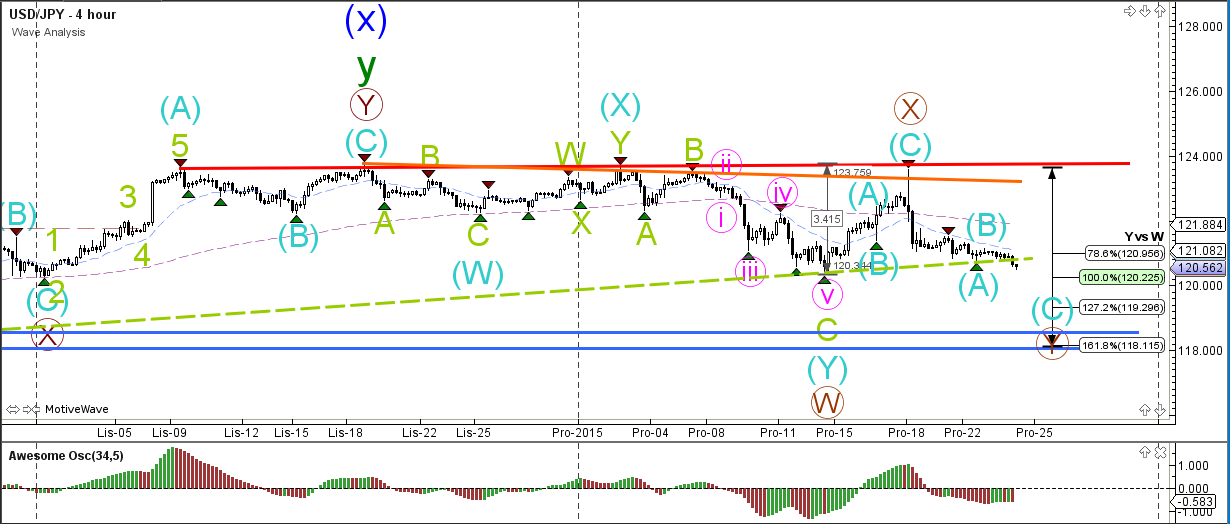
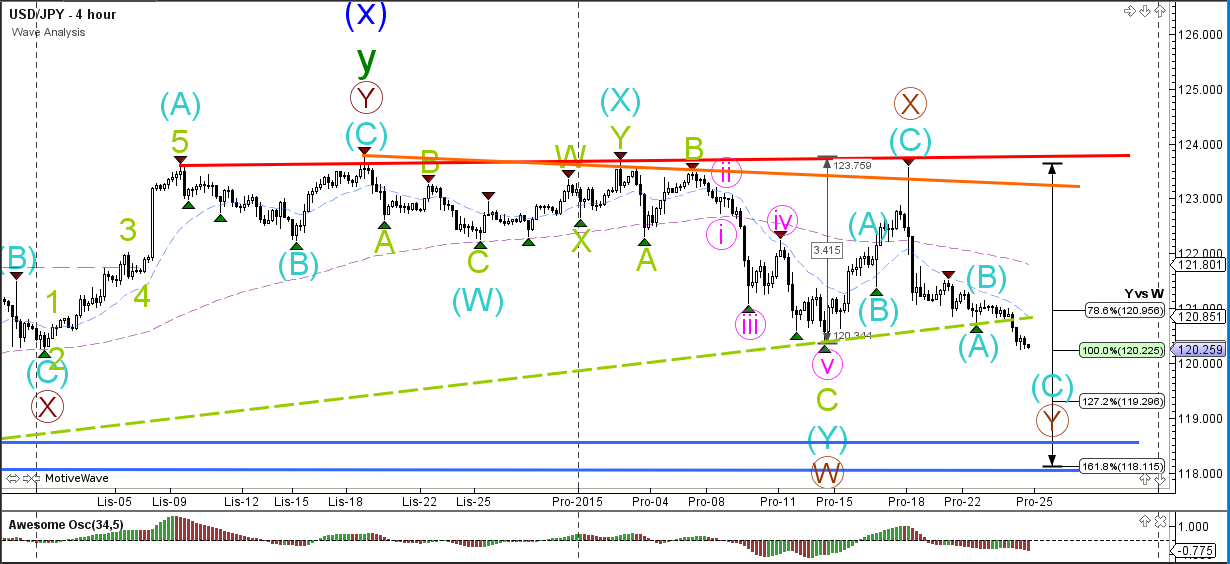
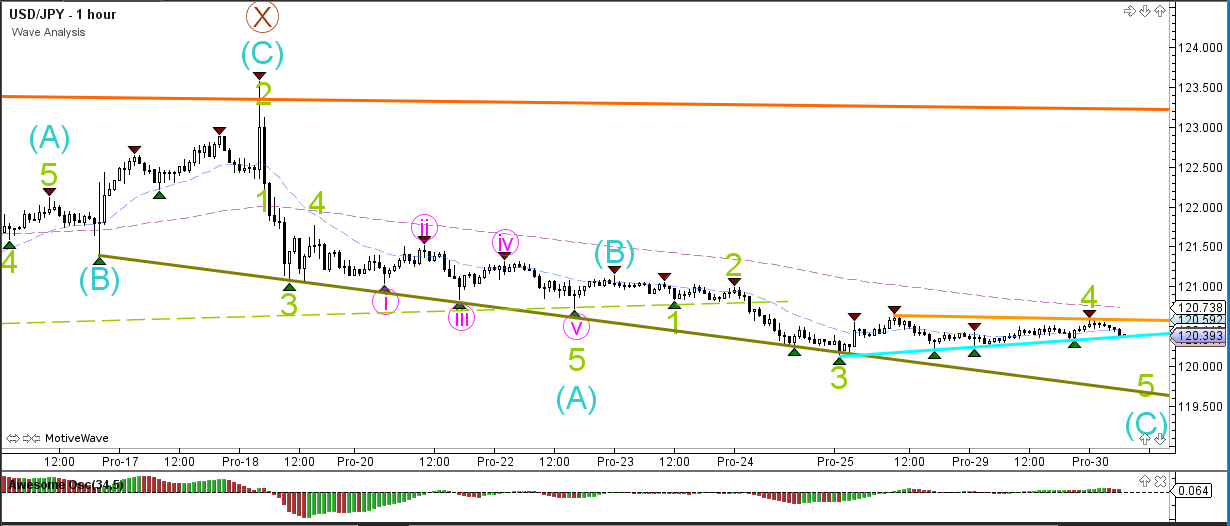
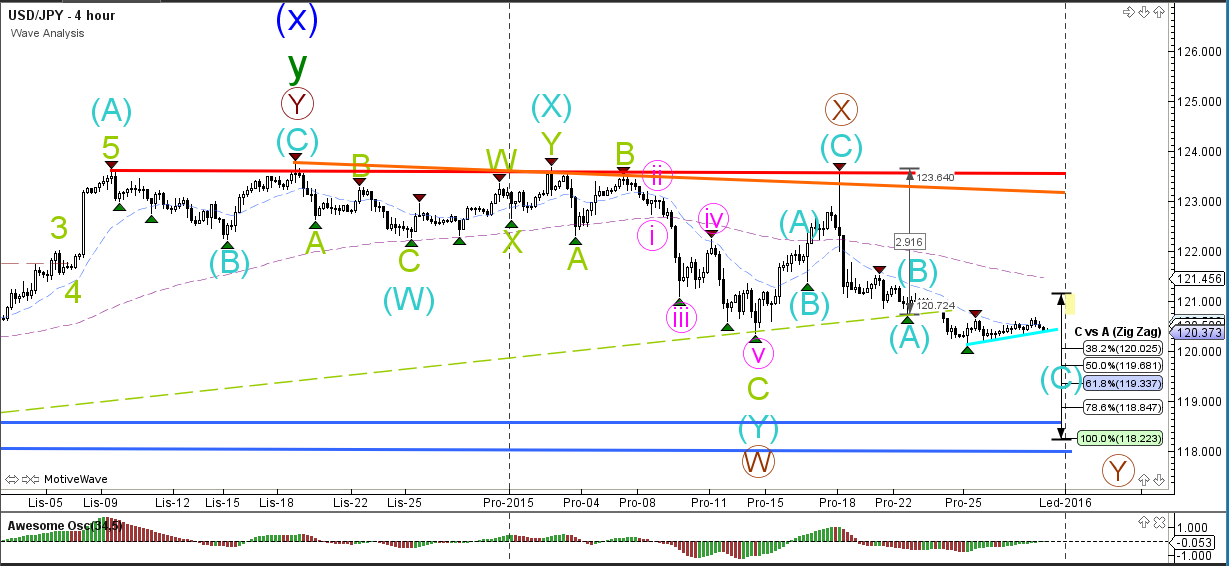
USD/JPY
4 hour
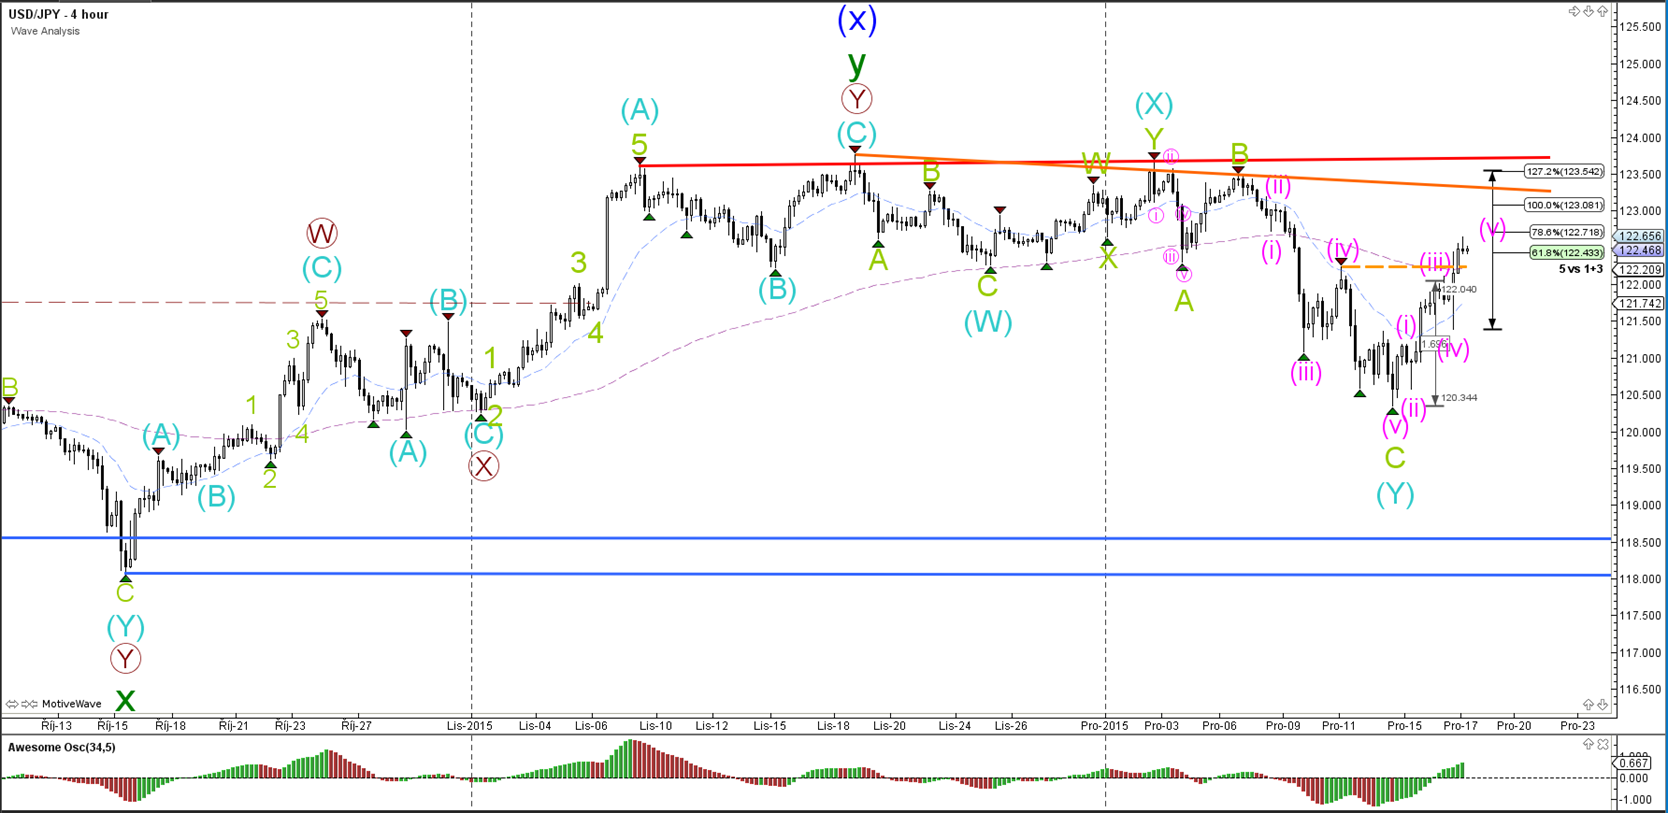
The FED's decision to increase interest rates in the US caused lots of volatility in the market but in the end a bullish 5 wave pattern emerged (pink). The 5 wave pattern has changed the bearish count from a potential A to the current C (green) of Y (blue).
“Original analysis is provided by Admiral Markets”
EUR/USD
4 hour

The FED's decision to increase interest rates in the US caused lots of volatility in the market. The EUR/USD moved lower eventually during the news but price is still far away from the current year low. For the moment I am not expecting price to break below this year's low (green line) and hence the wave count is now showing a wave X retracement (green).
1 hour

The EUR/USD bearish price action has been slow and therefore the wave count is showing an ABC zigzag rather than a 123 (brown).
GBP/USD
4 hour
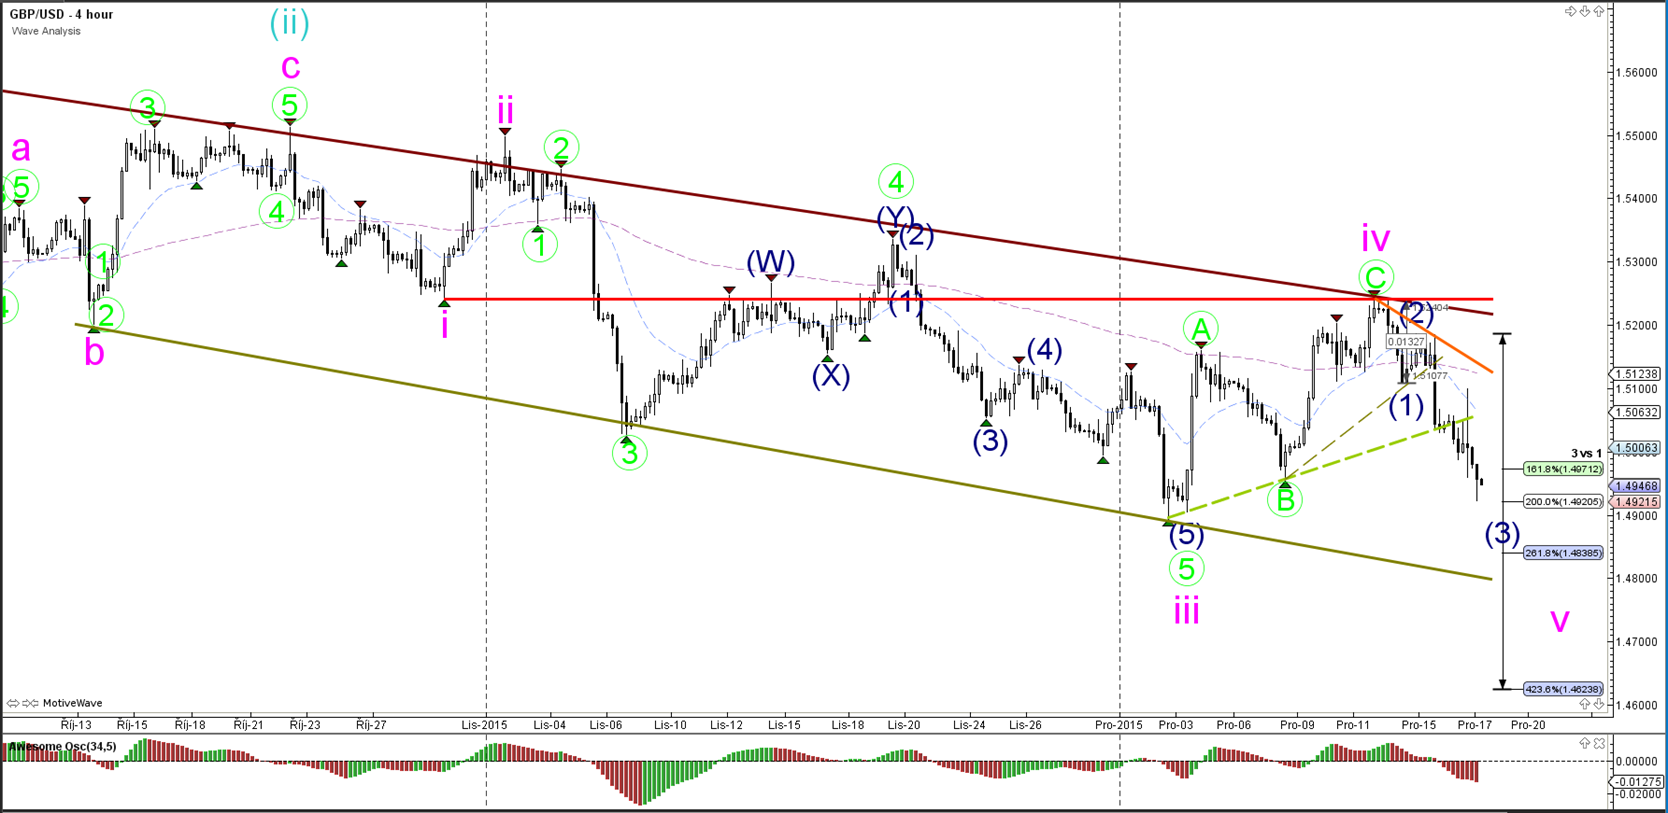
The FED's decision to increase interest rates in the US caused lots of volatility in the market but the GBP/USD has managed to make a bearish turn at the top of the channel and is now breaking below support within the downtrend channel.
1 hour

The GBP/USD broke below the support trend line (dotted green) and is moving lower to the targets of wave 5 (blue) of wave 3 (grey).
USD/JPY
4 hour

The FED's decision to increase interest rates in the US caused lots of volatility in the market but in the end a bullish 5 wave pattern emerged (pink). The 5 wave pattern has changed the bearish count from a potential A to the current C (green) of Y (blue).
“Original analysis is provided by Admiral Markets”