Admiral Markets
AdmiralMarkets.com Representative
- Messages
- 95
US Dollar Starts with Weakness in 2016
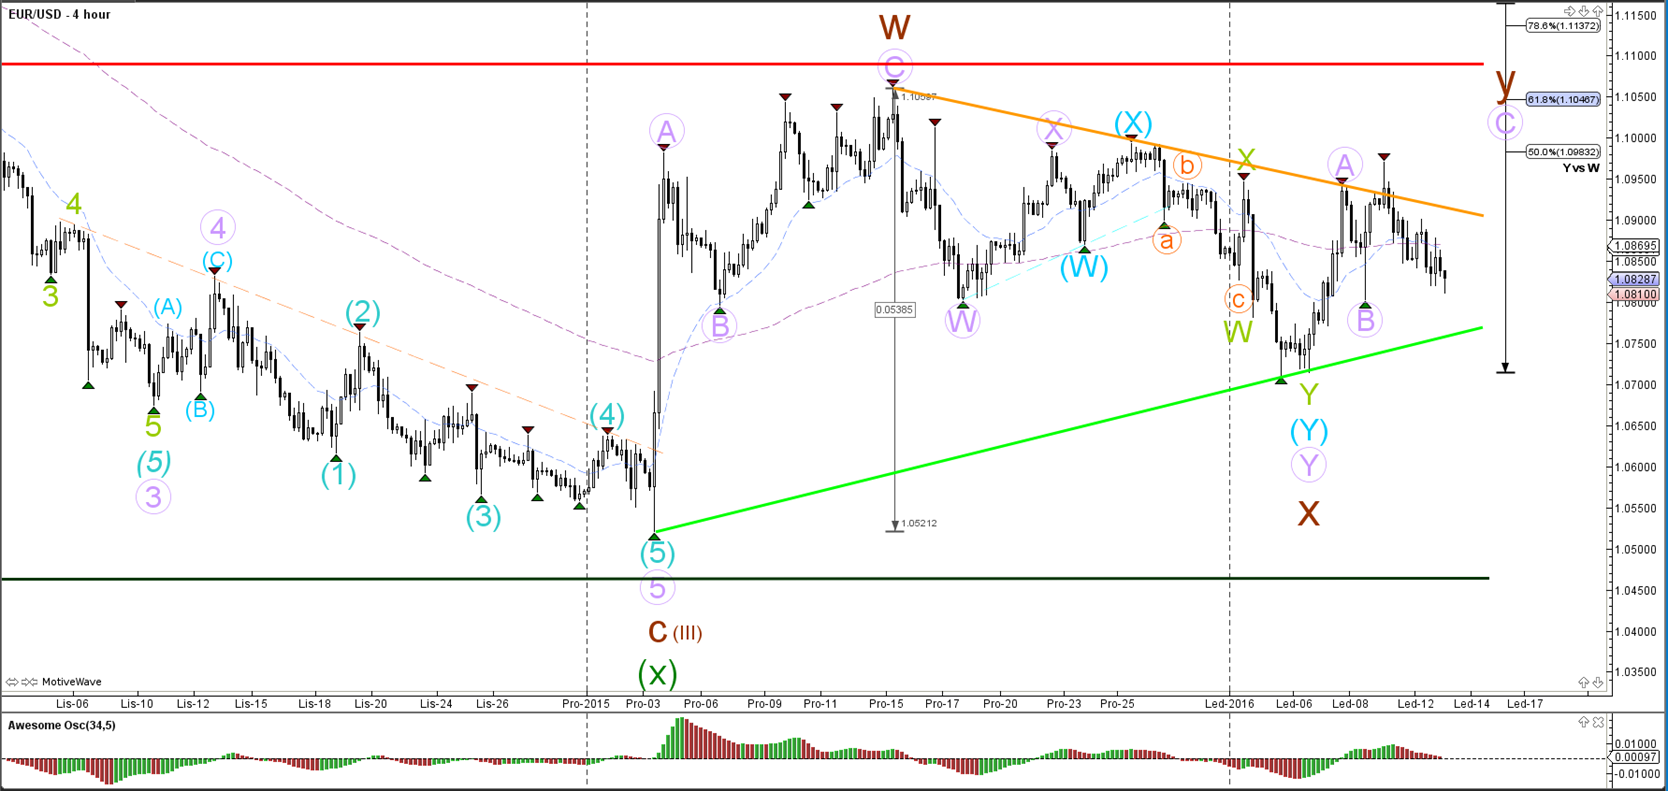
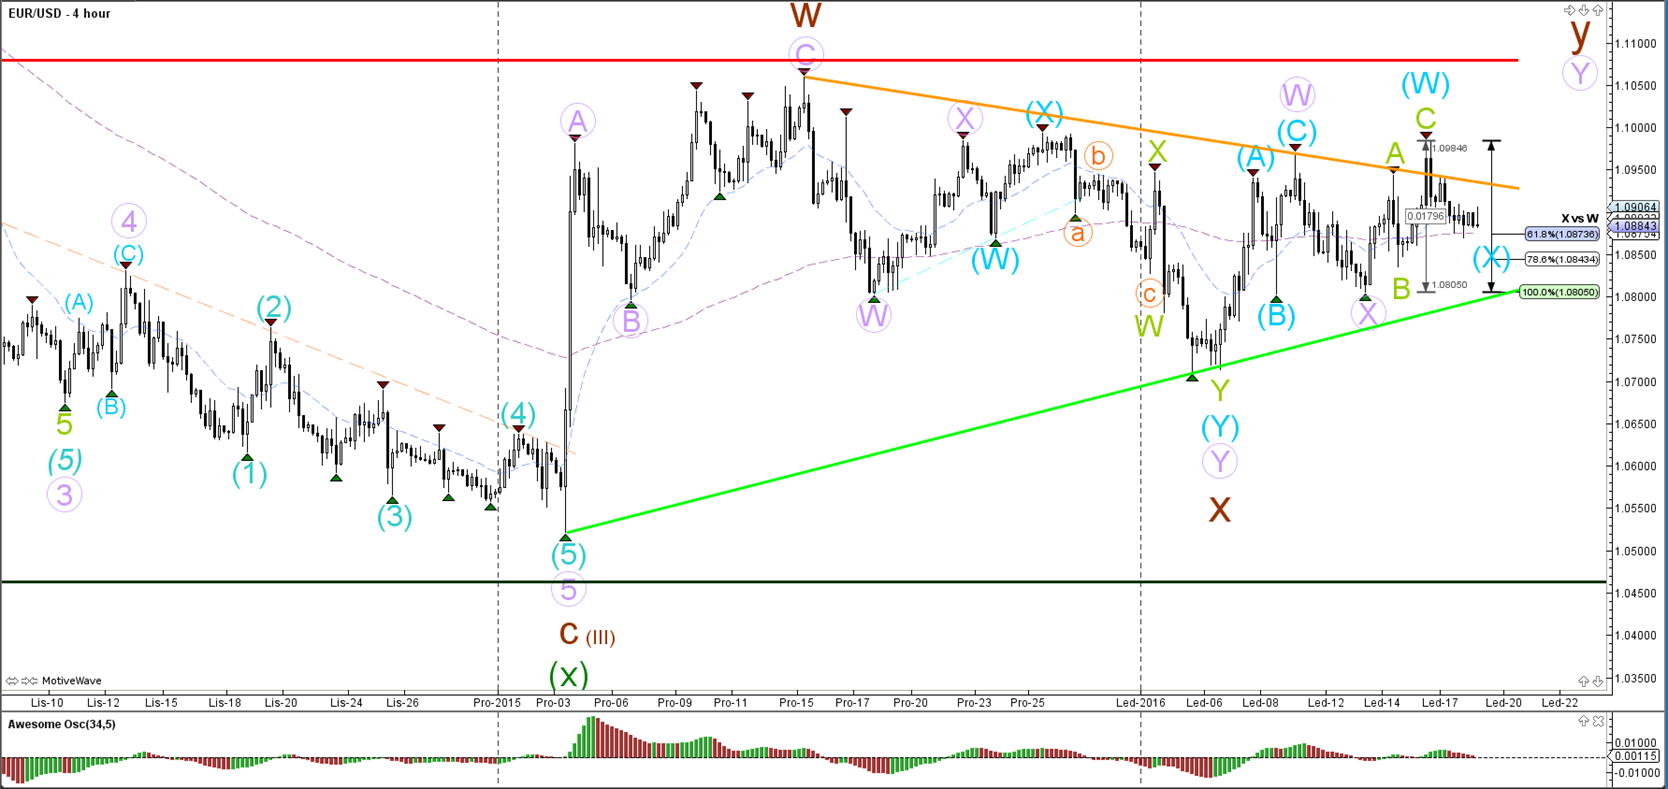
EUR/USD
4 hour
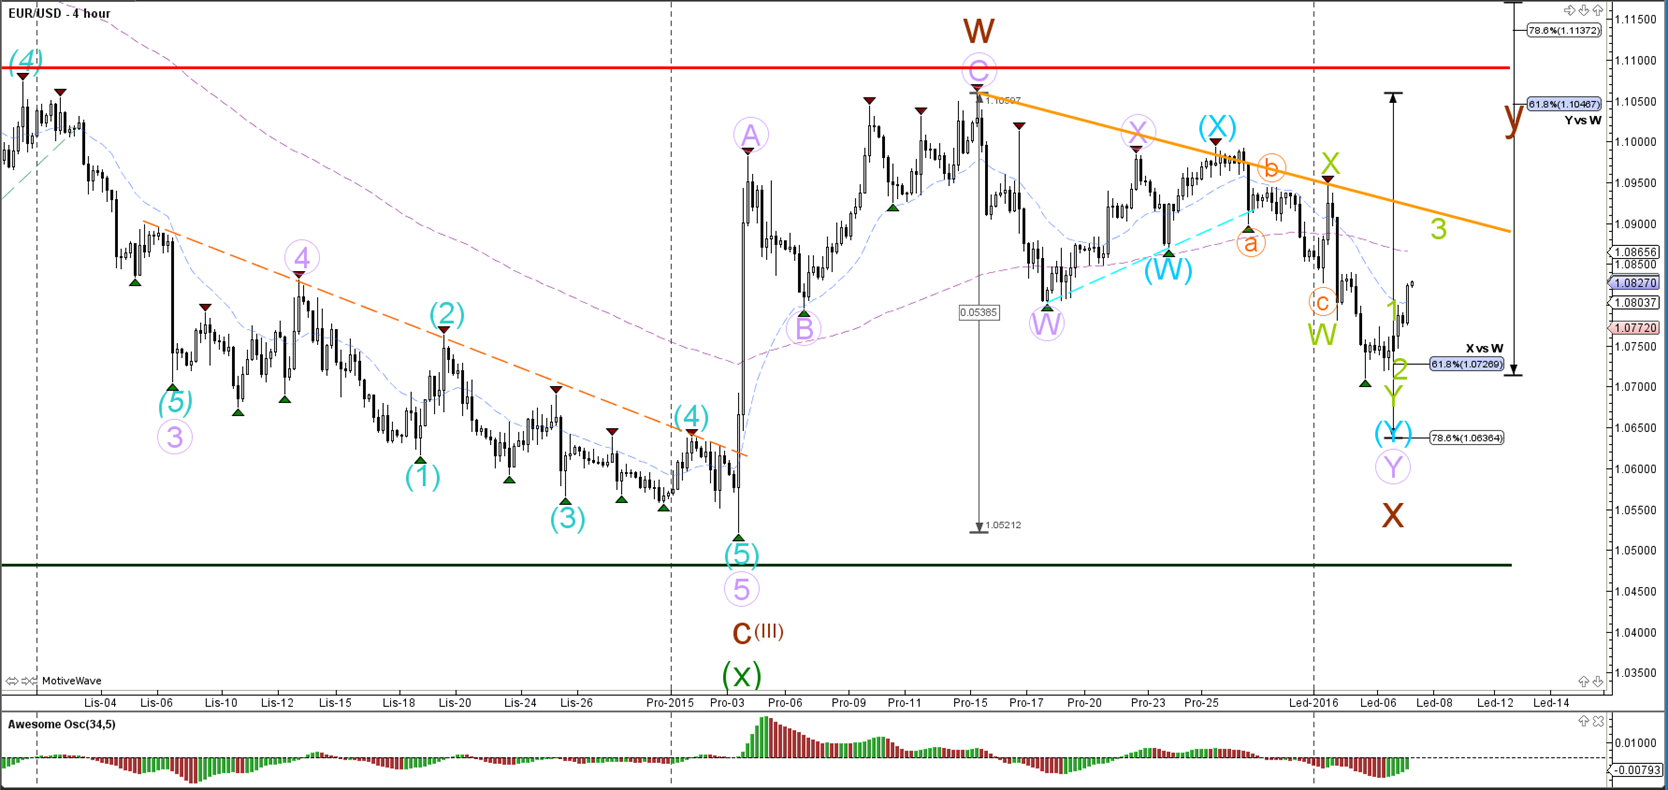
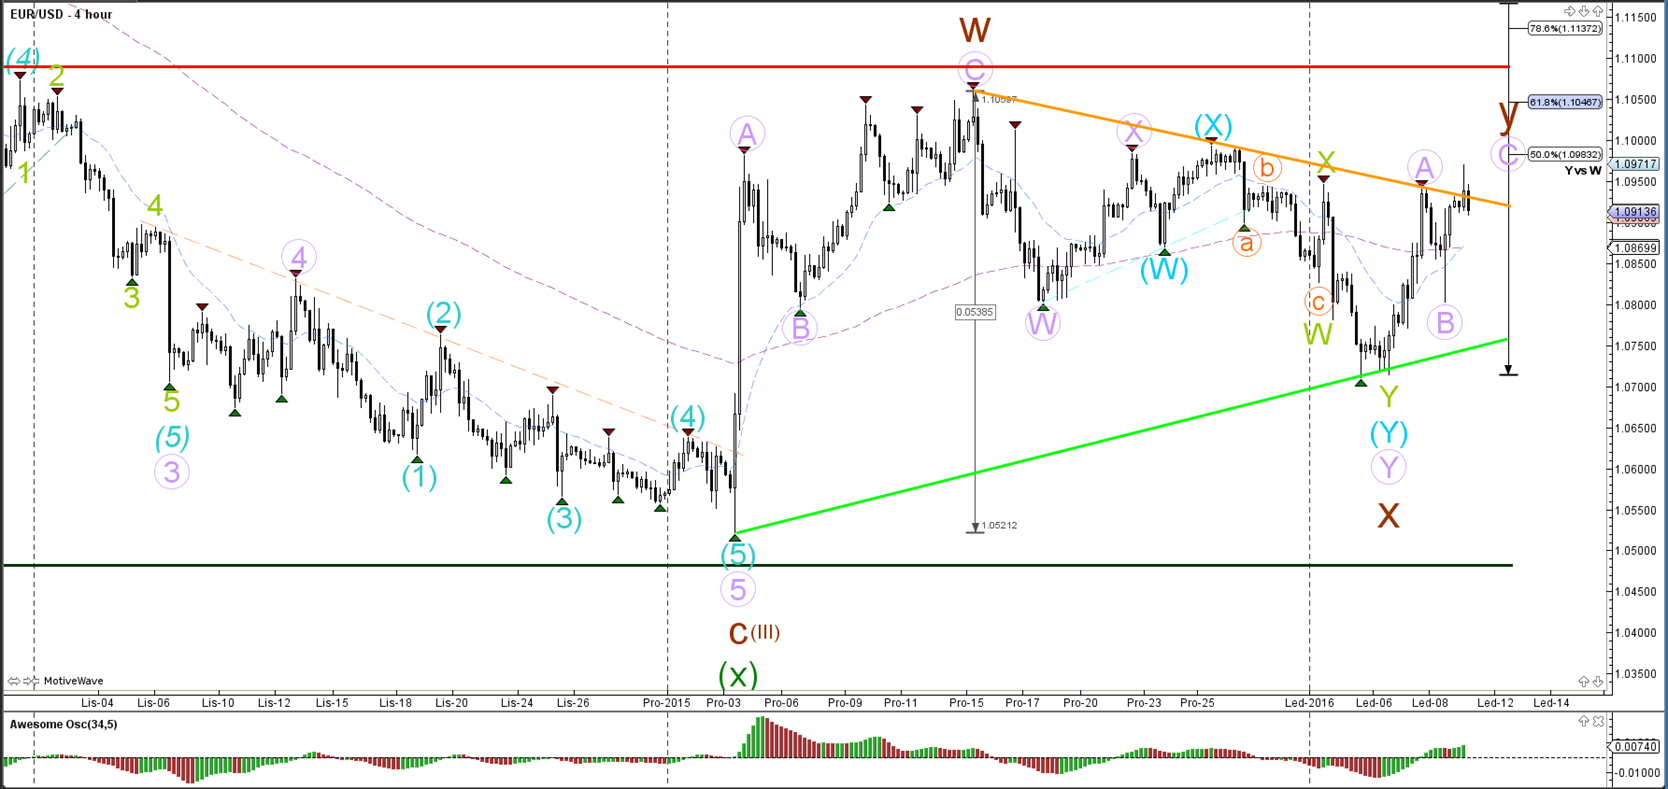
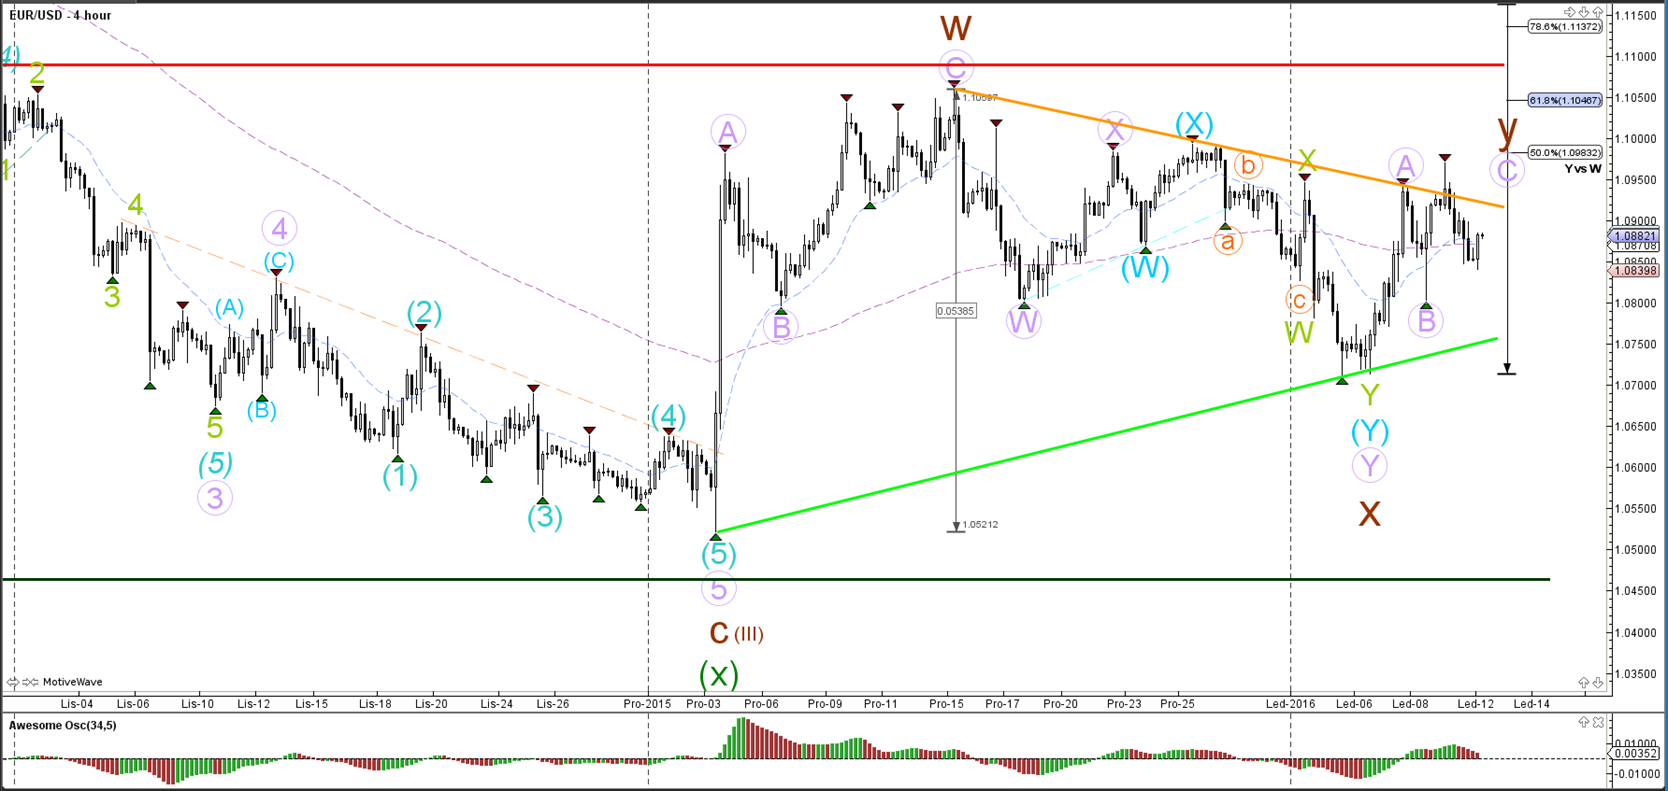
The EUR/USD is most likely in a wave B of a larger ABC (purple) zigzag. The wave count is invalidated if price breaks below the horizontal support (lighter green).
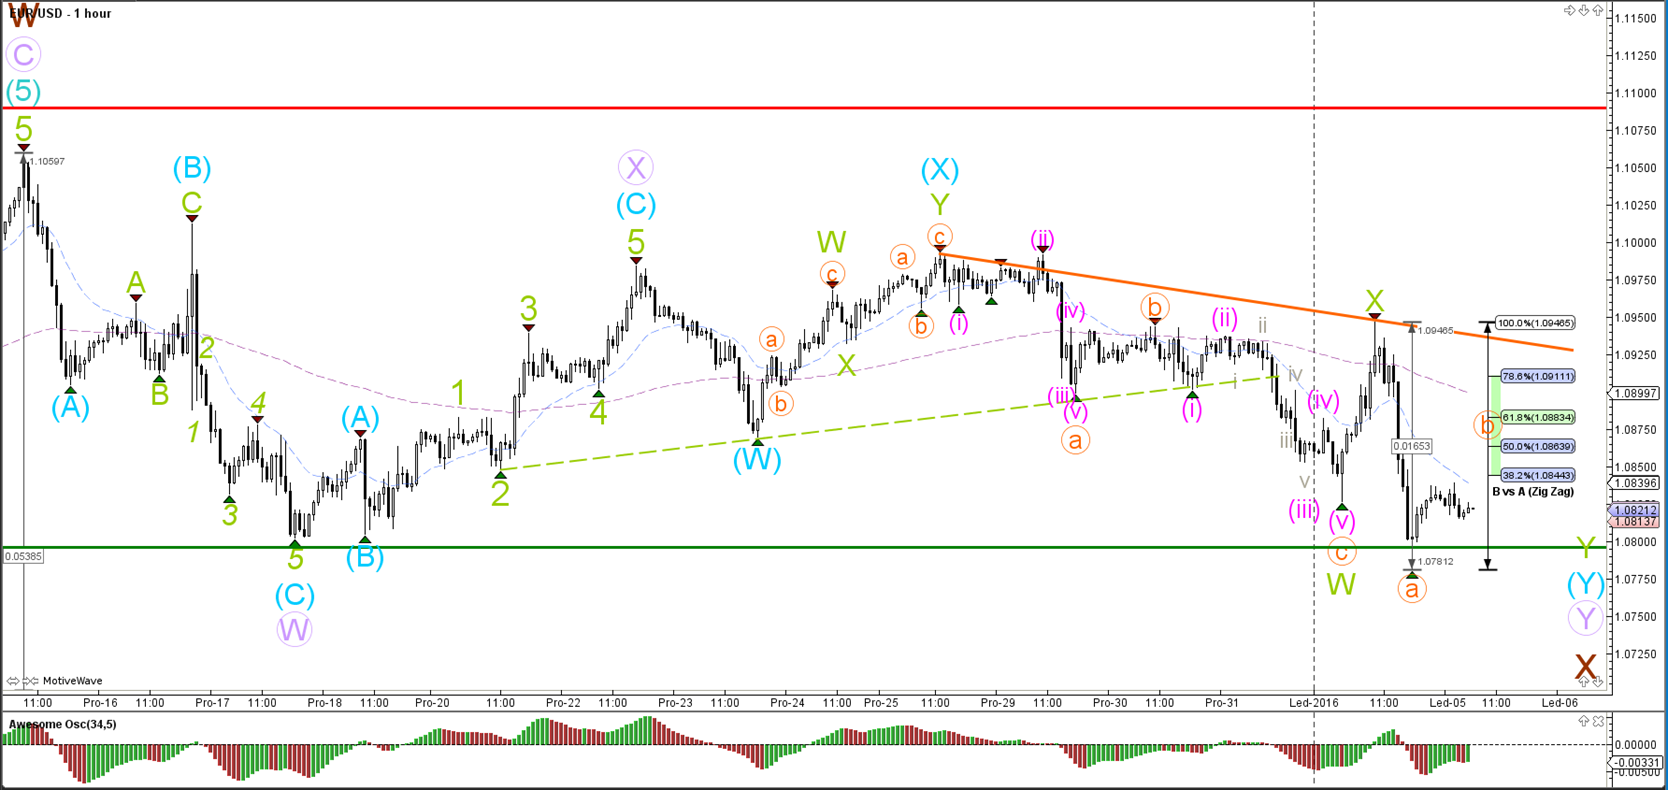
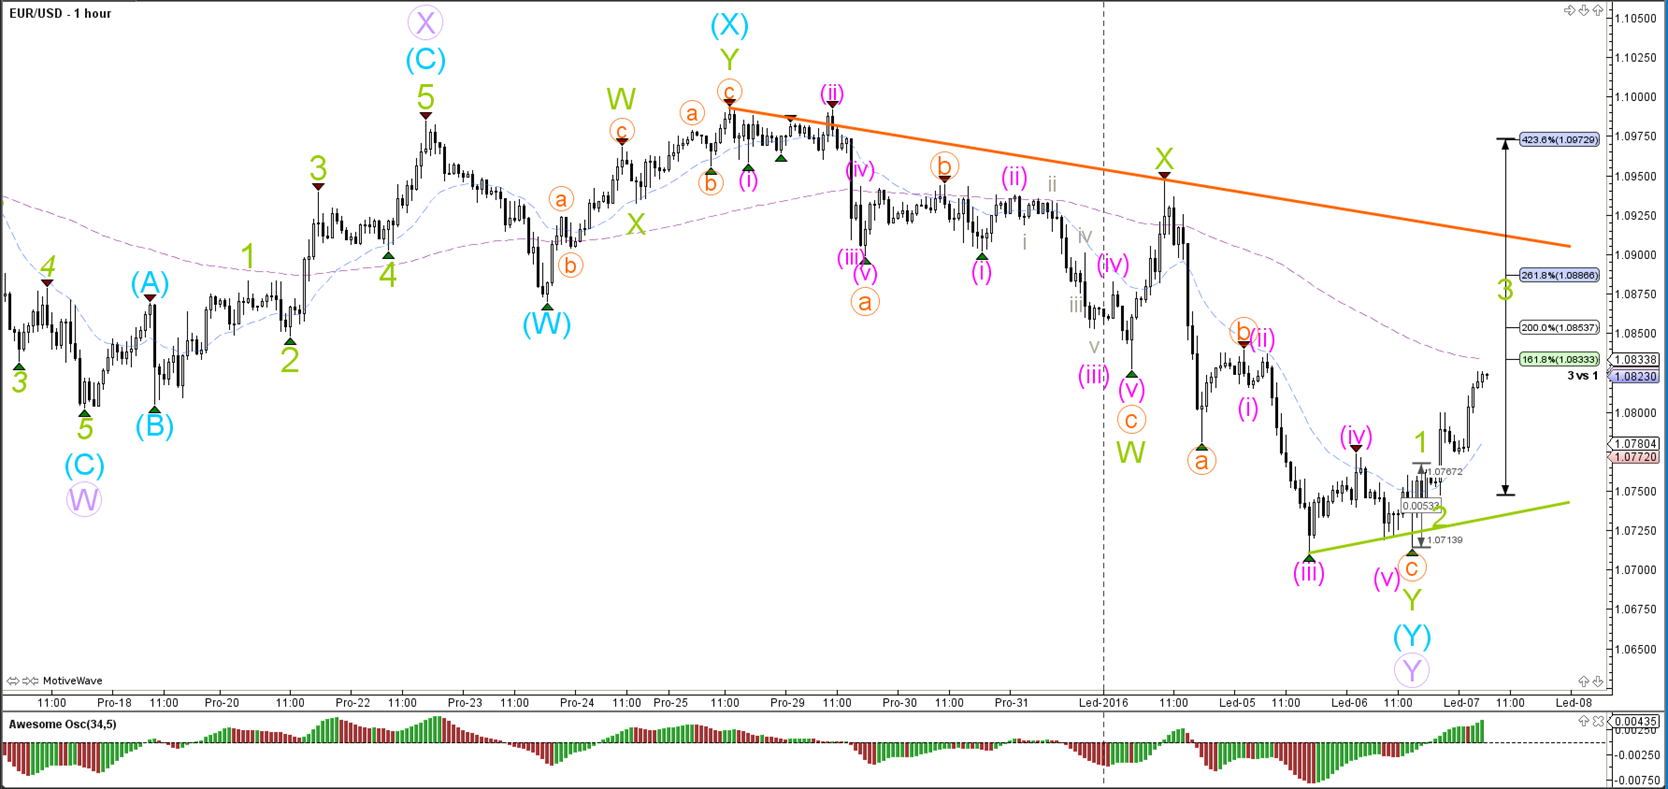
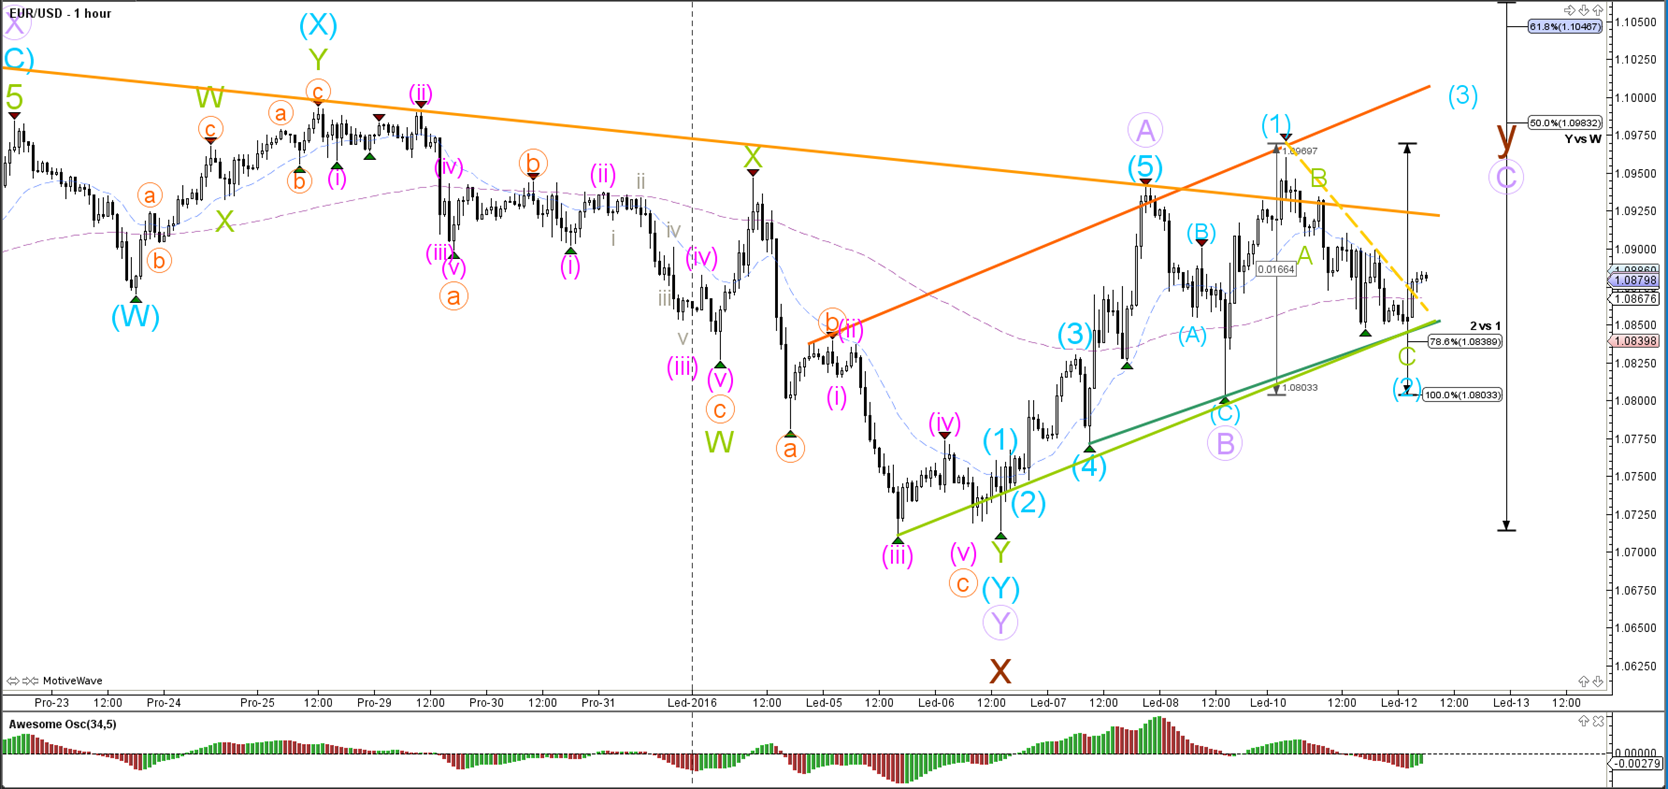
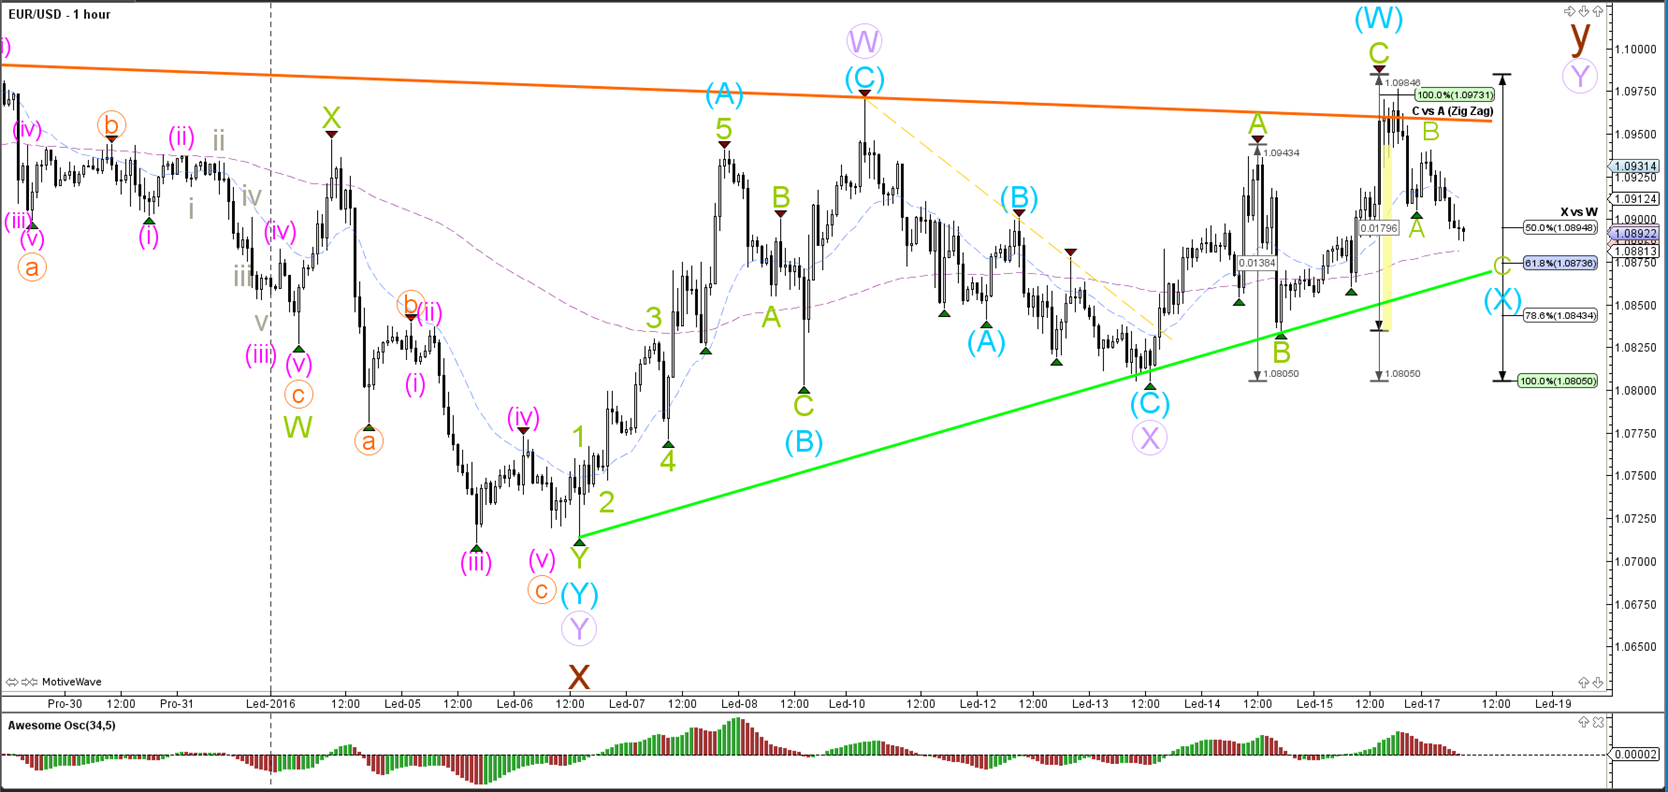
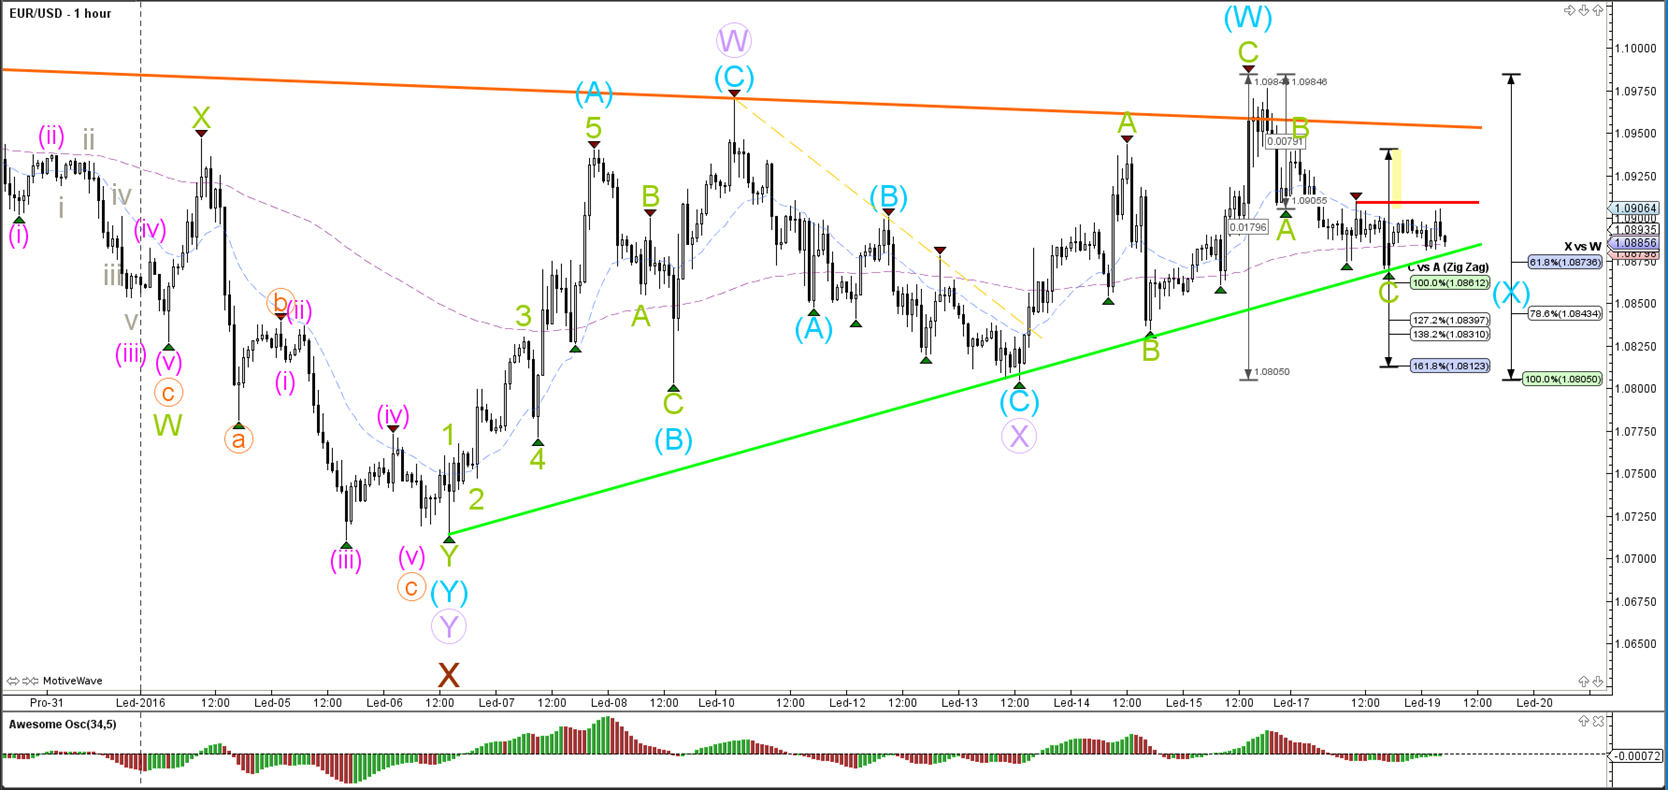
1 hour
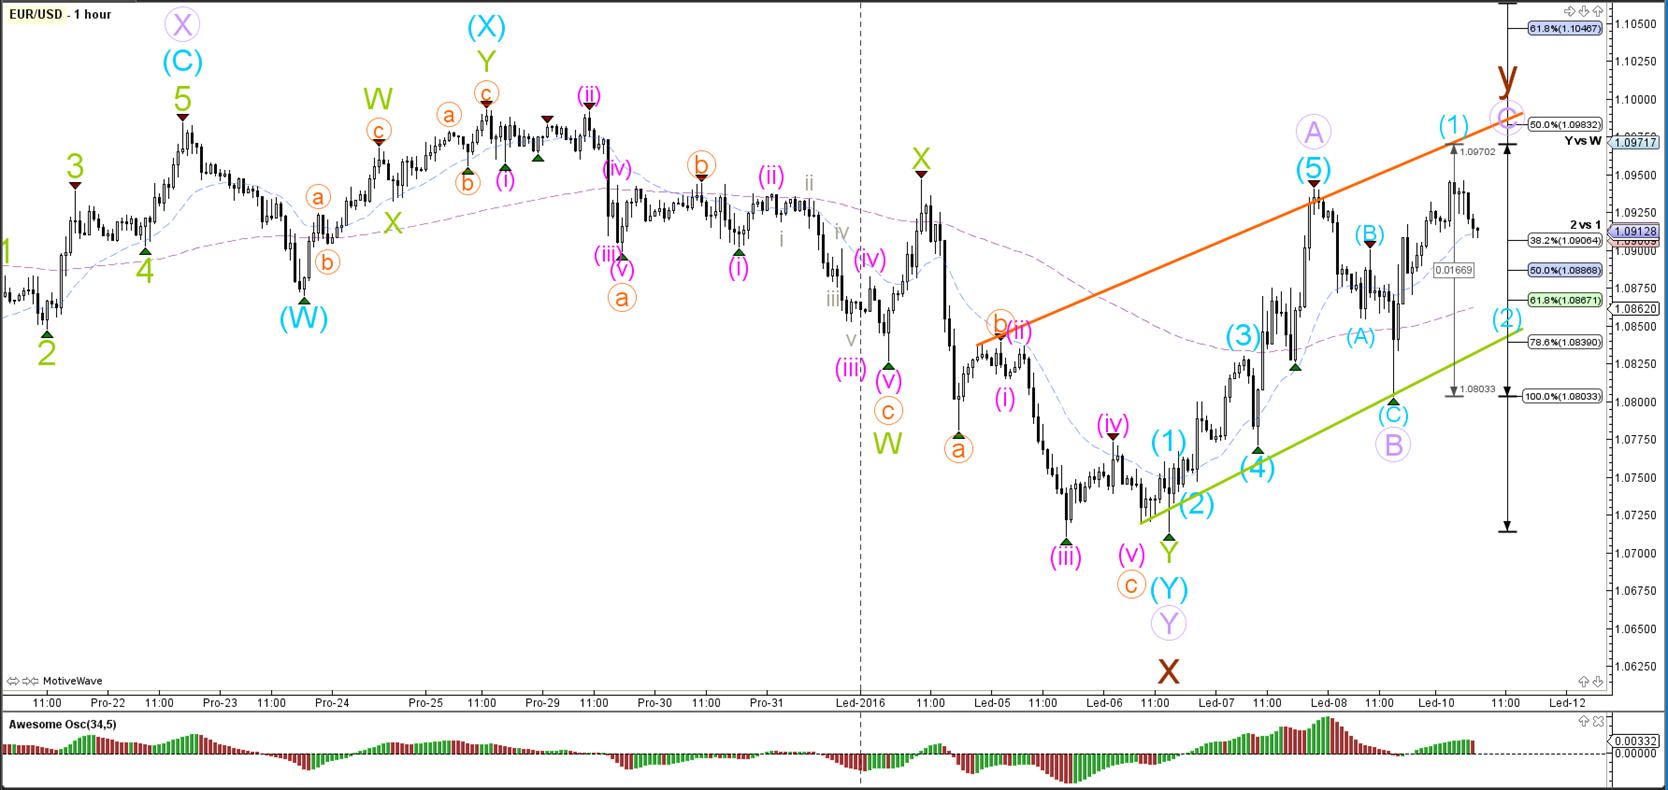
The EUR/USD made a bearish break below the support trend line (dotted green) as part of a 5th wave (green), which could potential complete a wave C (blue) of a wave B (purple). Price has bounced at the 78.6% Fib and a break below the 100% mark invalidates this wave count.
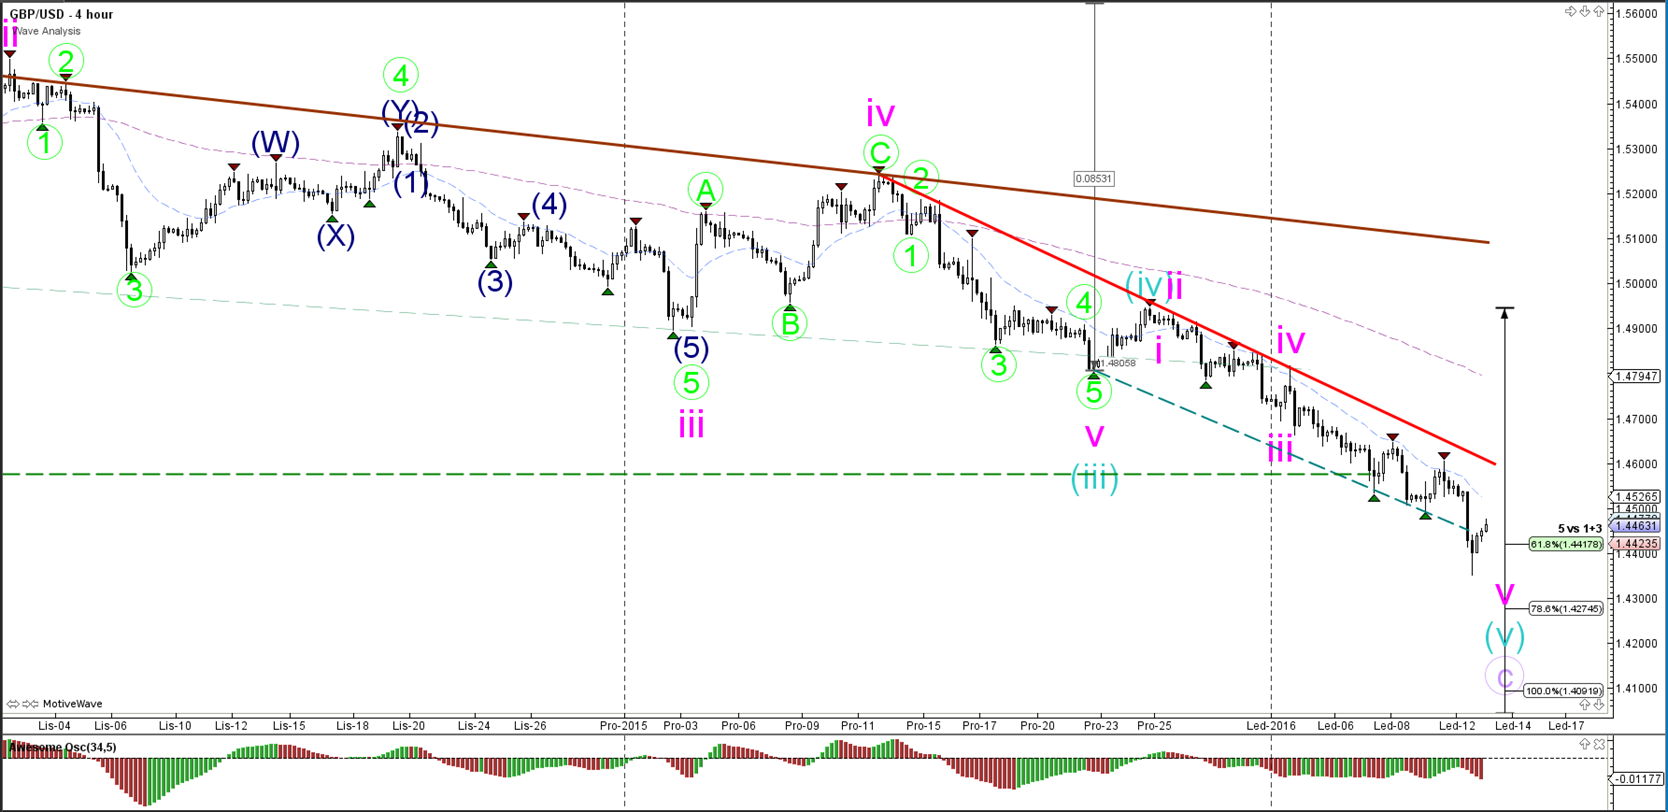
GBP/USD
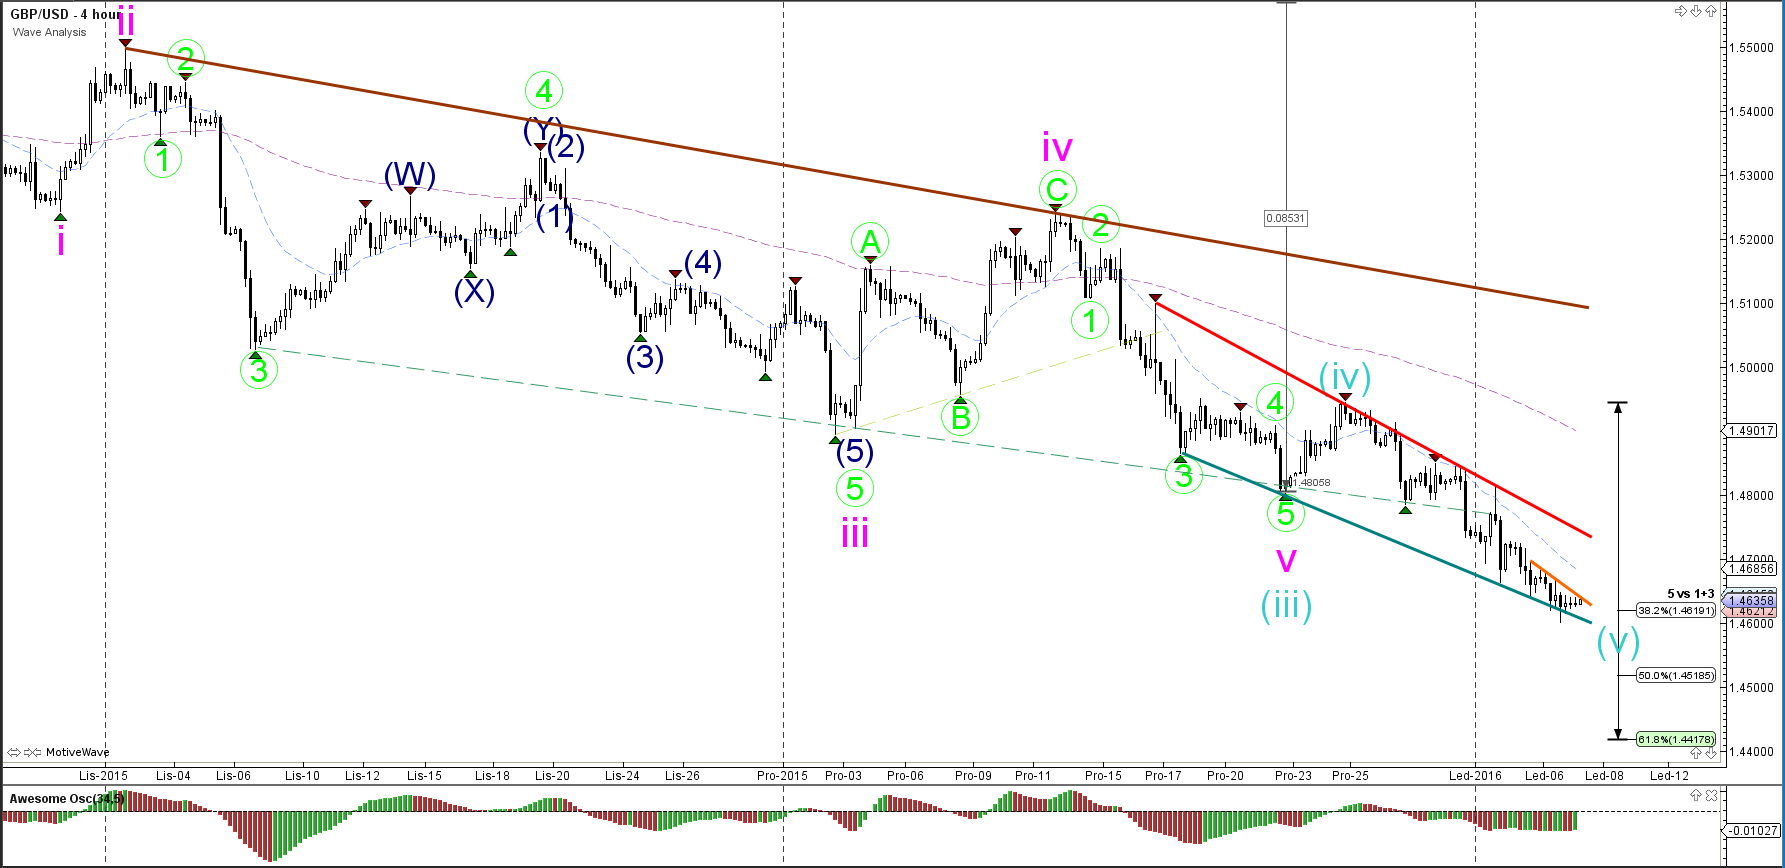
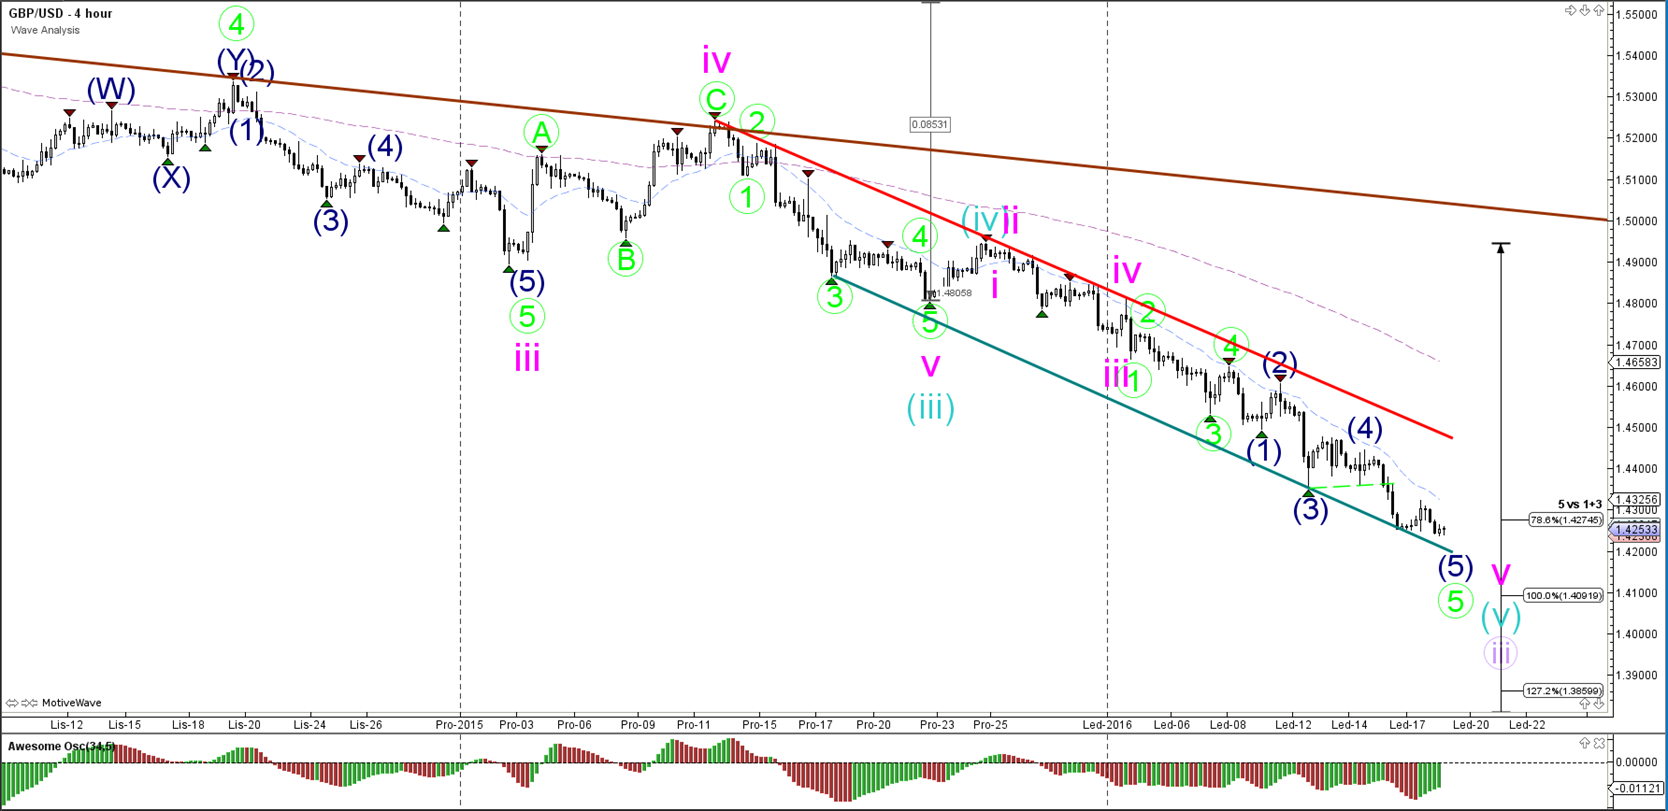
4 hour
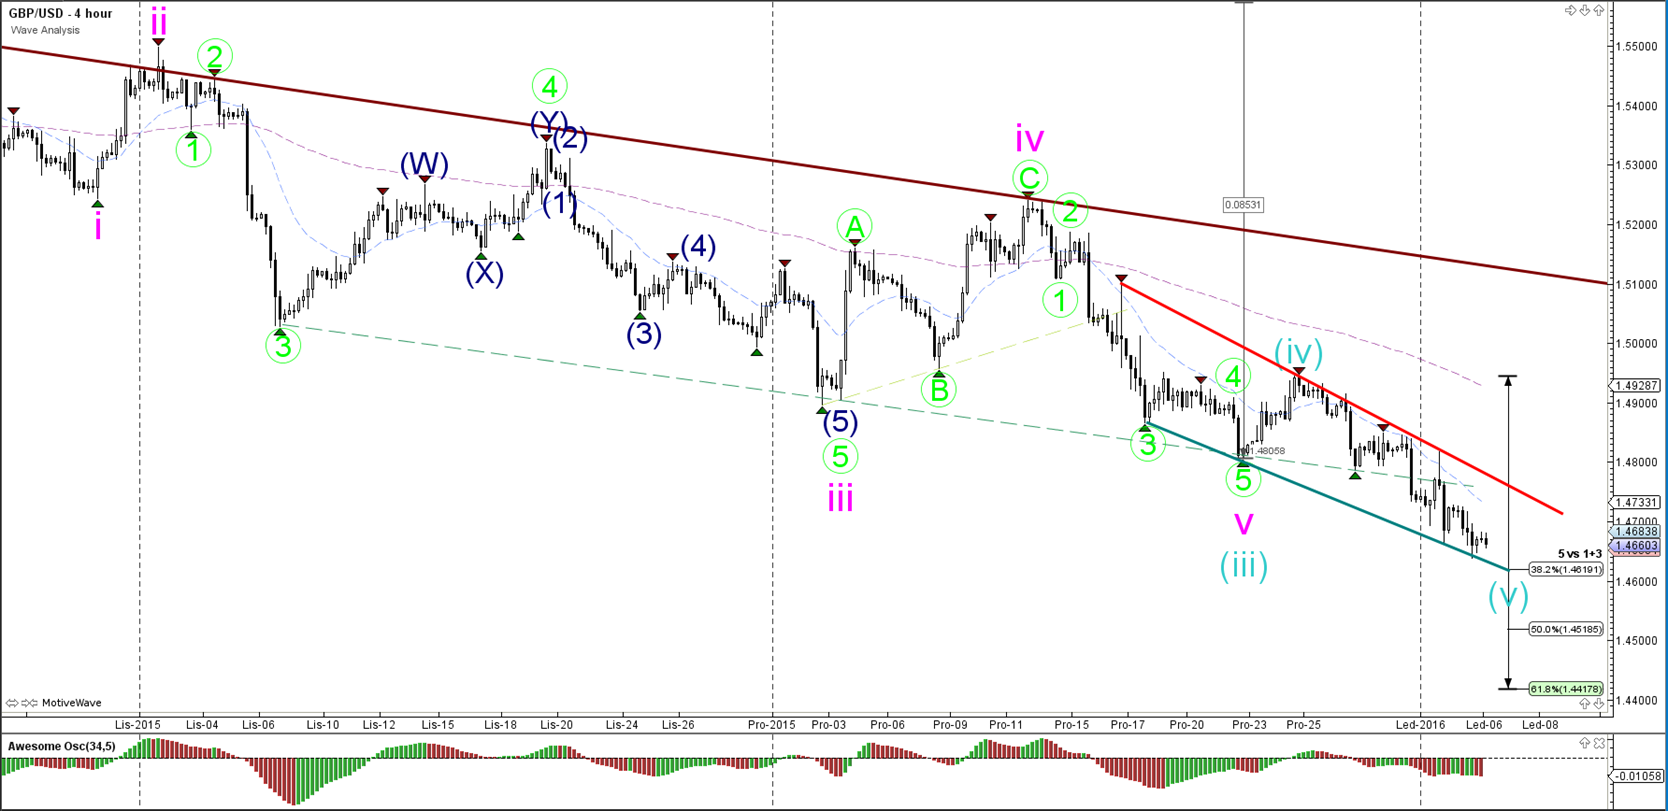
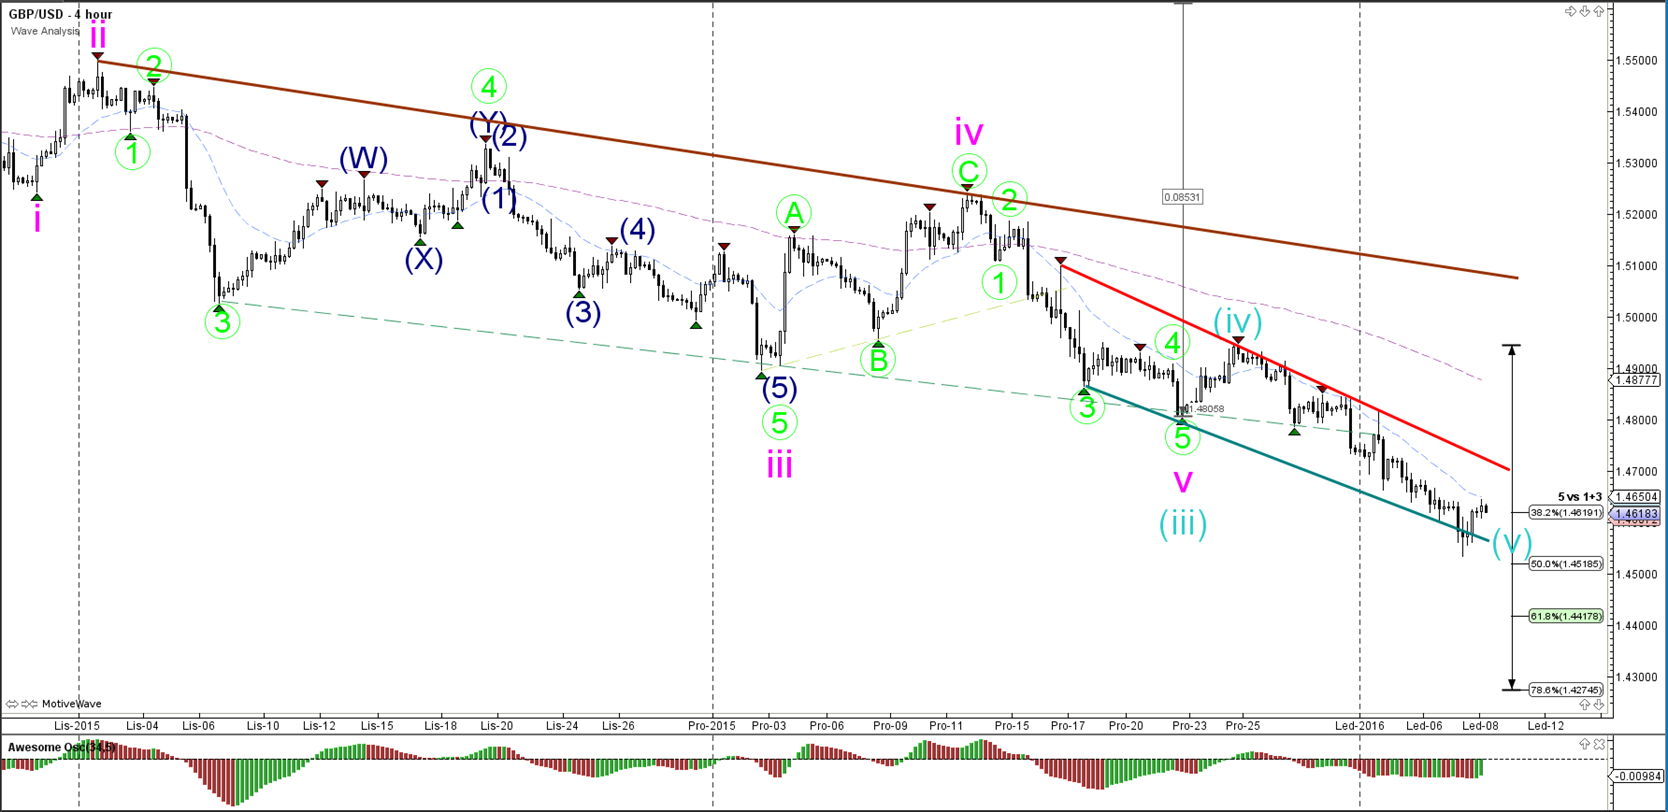
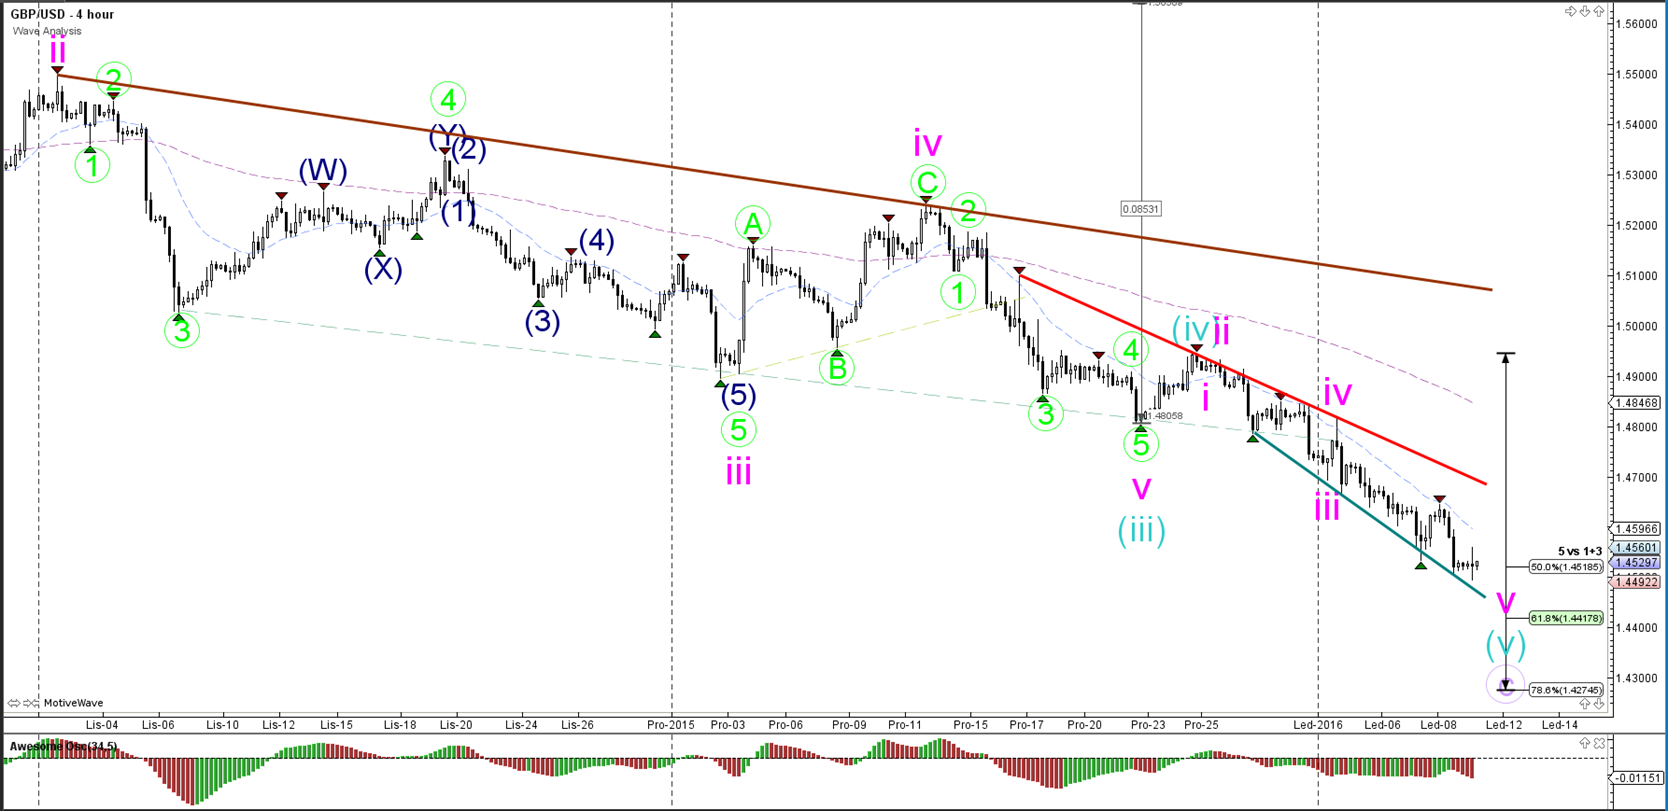
The GBP/USD is attempting to break below the downtrend channel, which could indicate wave 3 (pink) continuation.
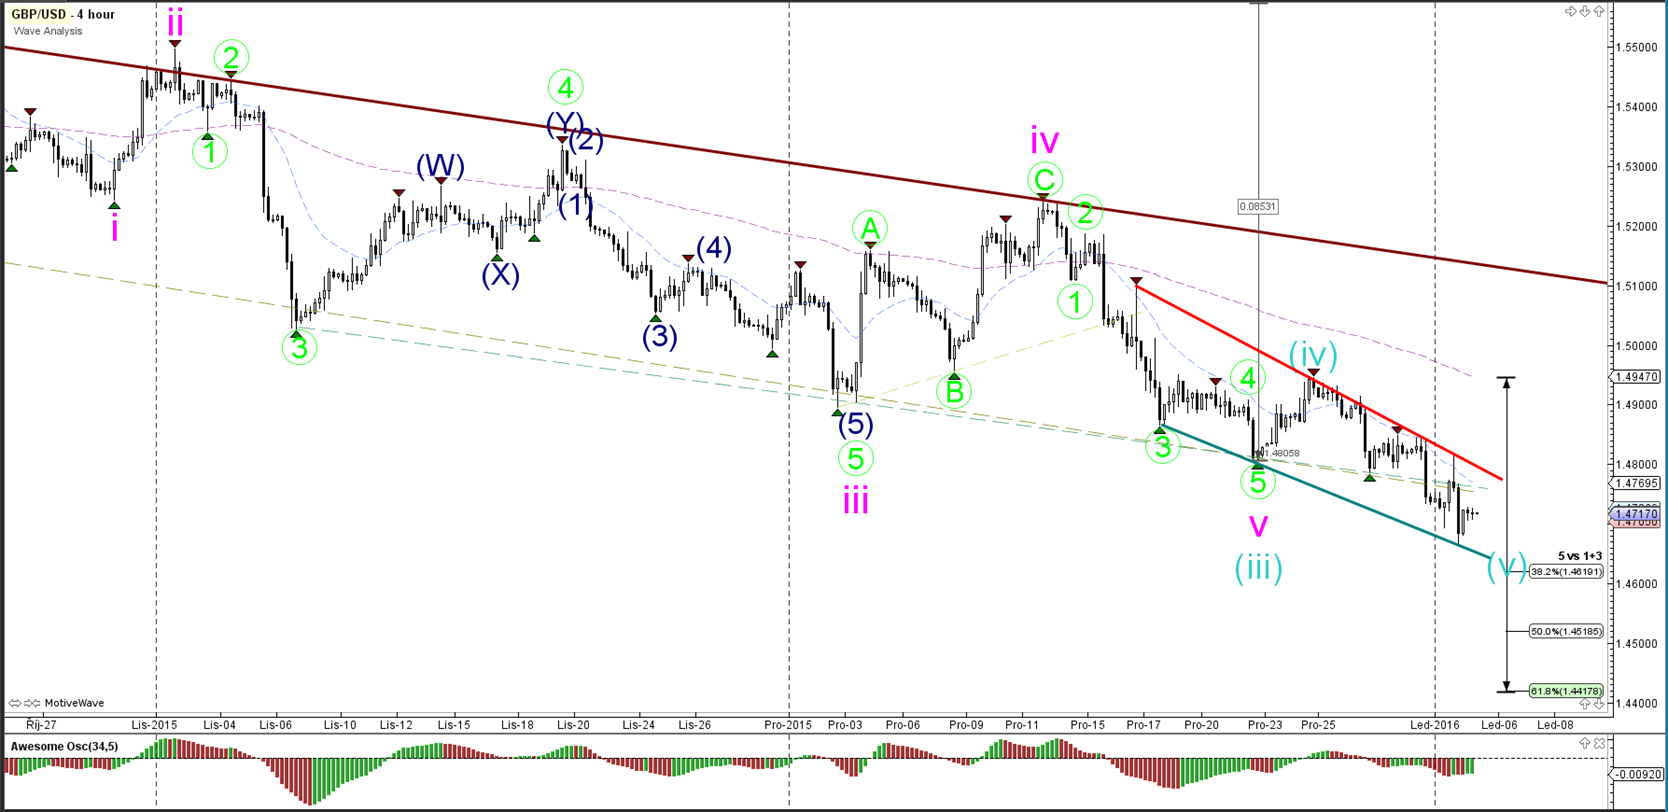
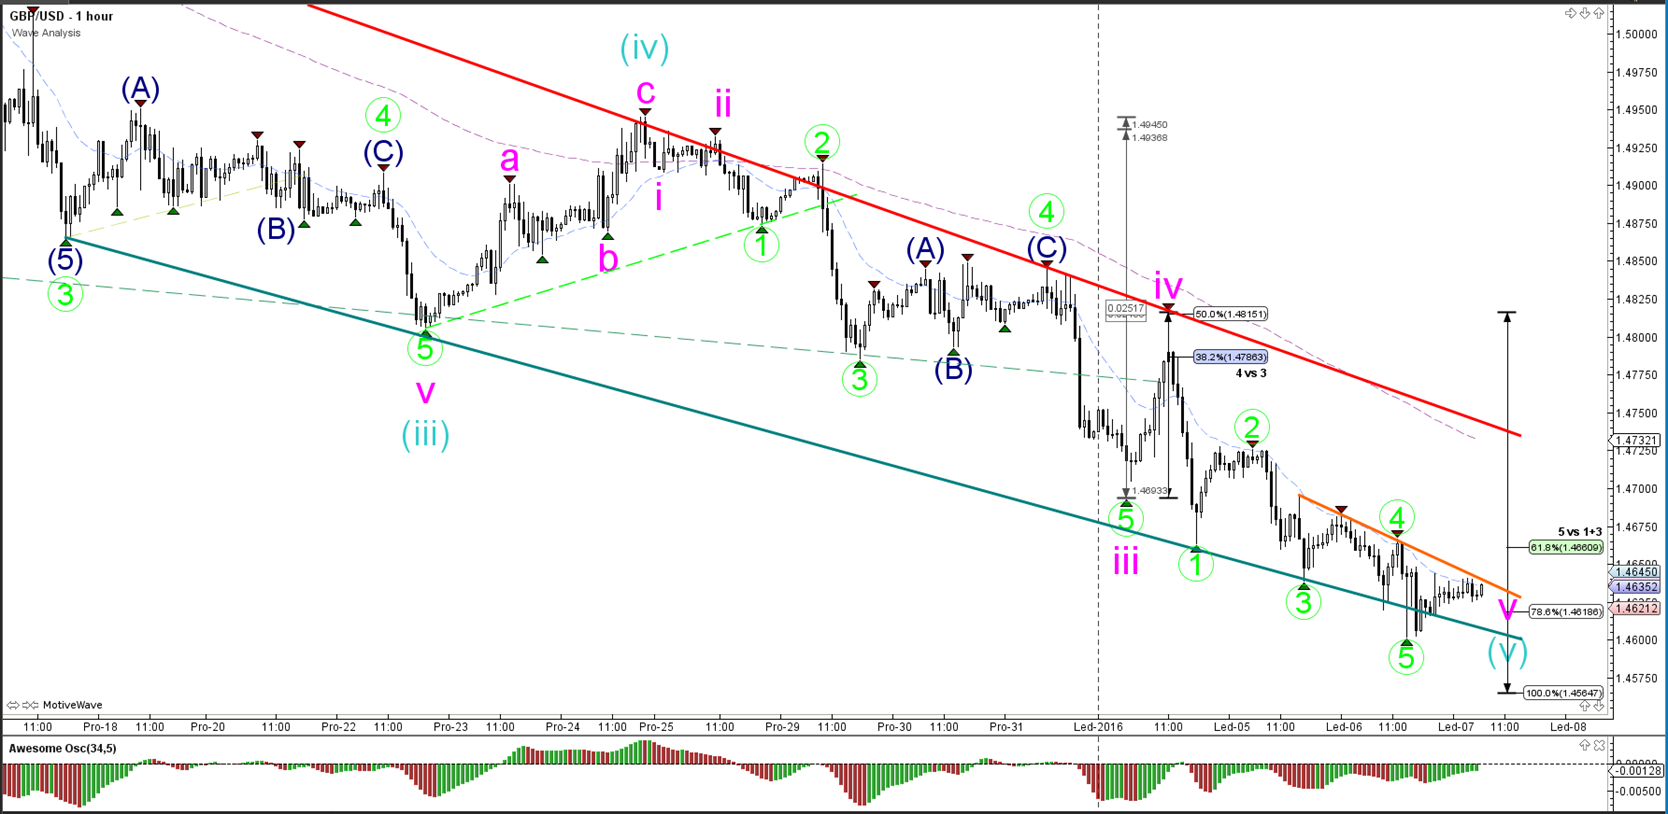
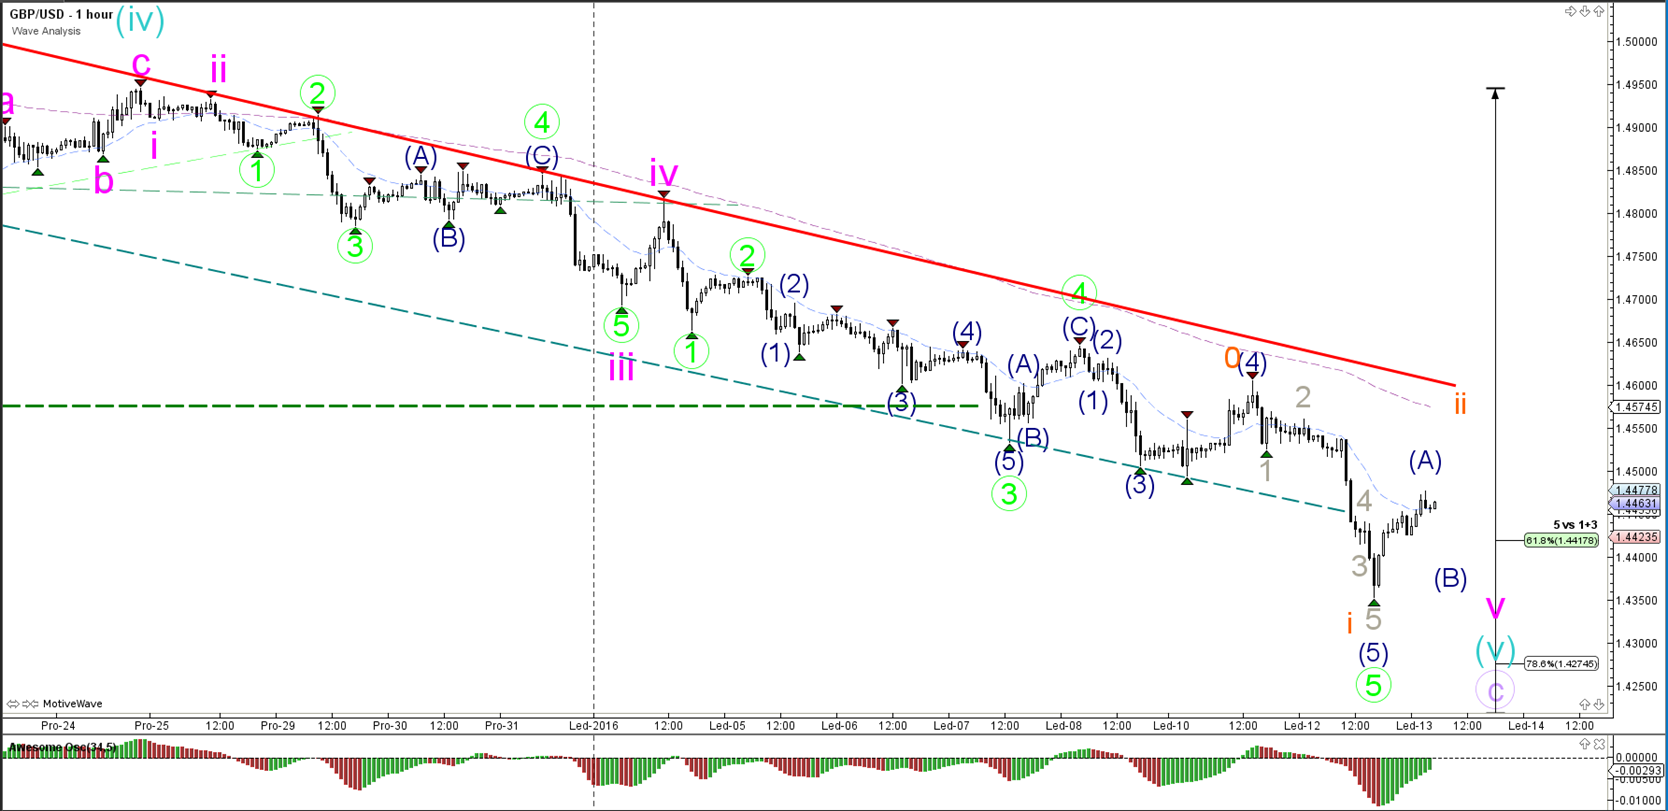
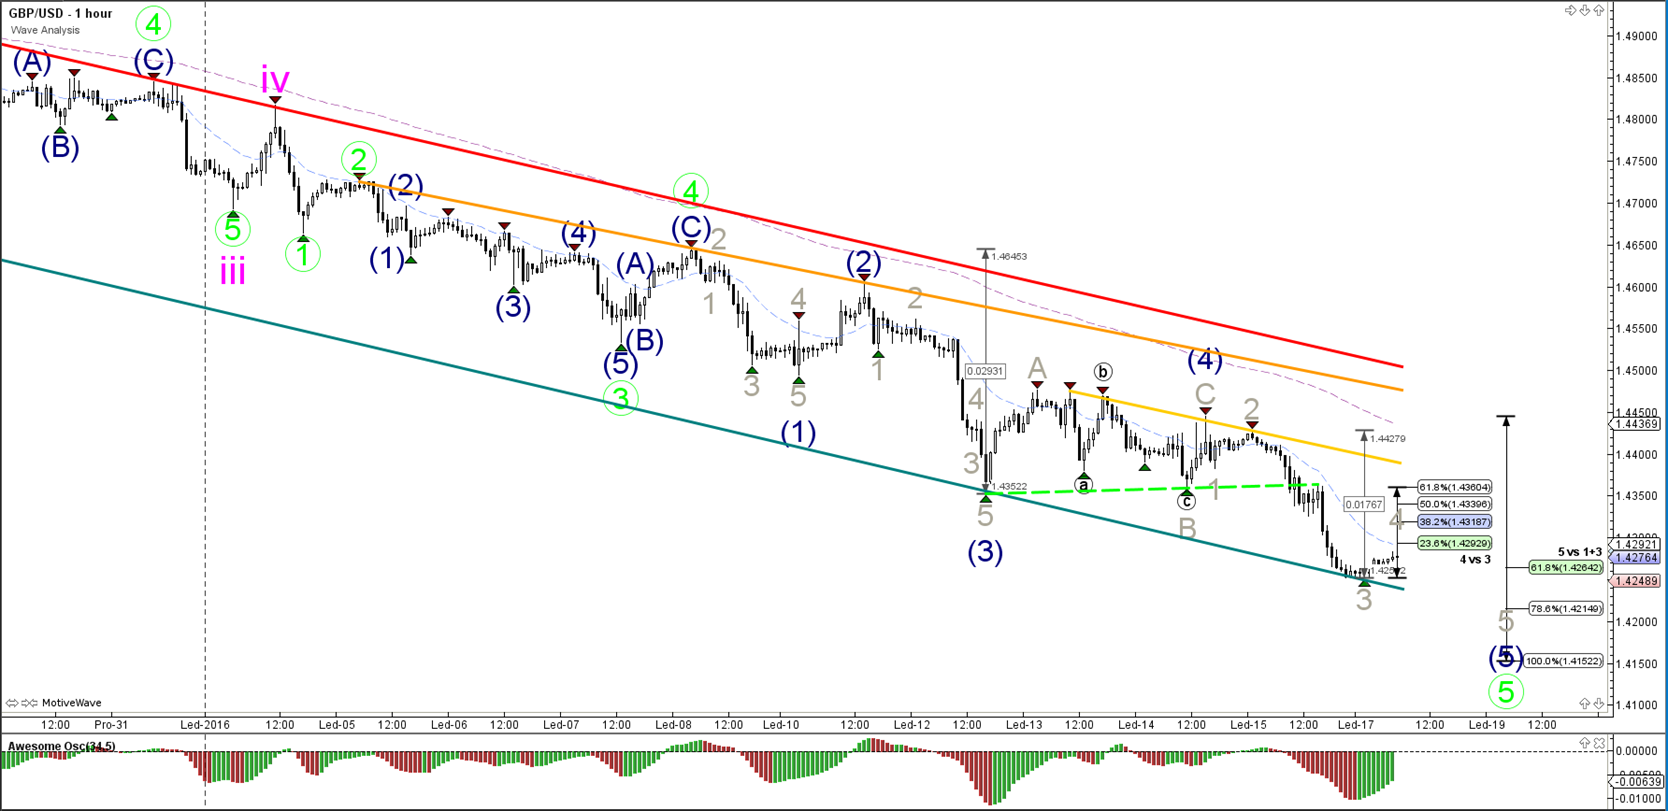
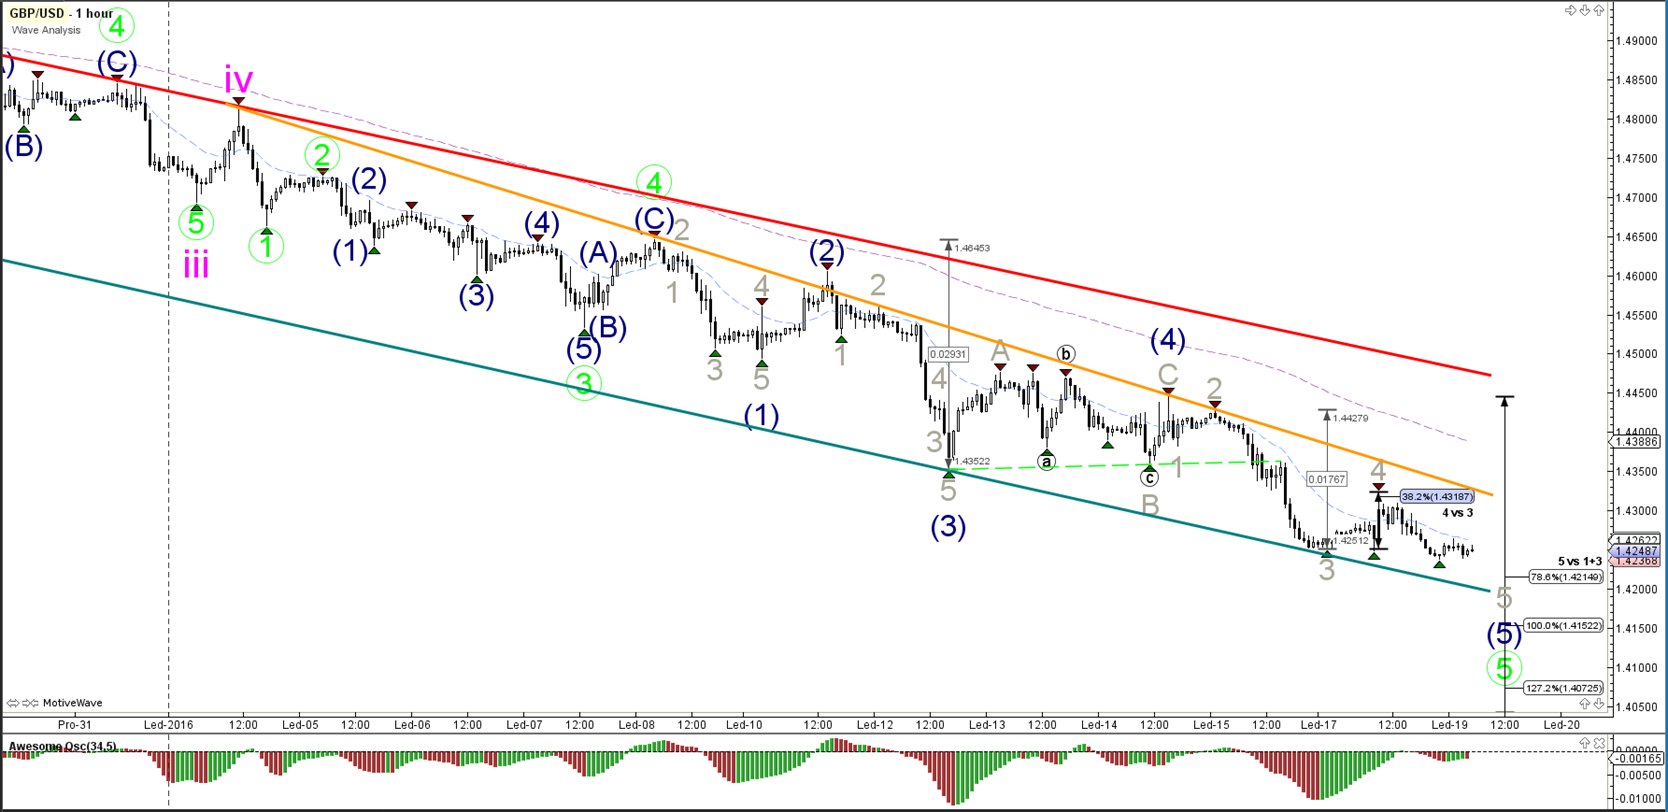
1 hour
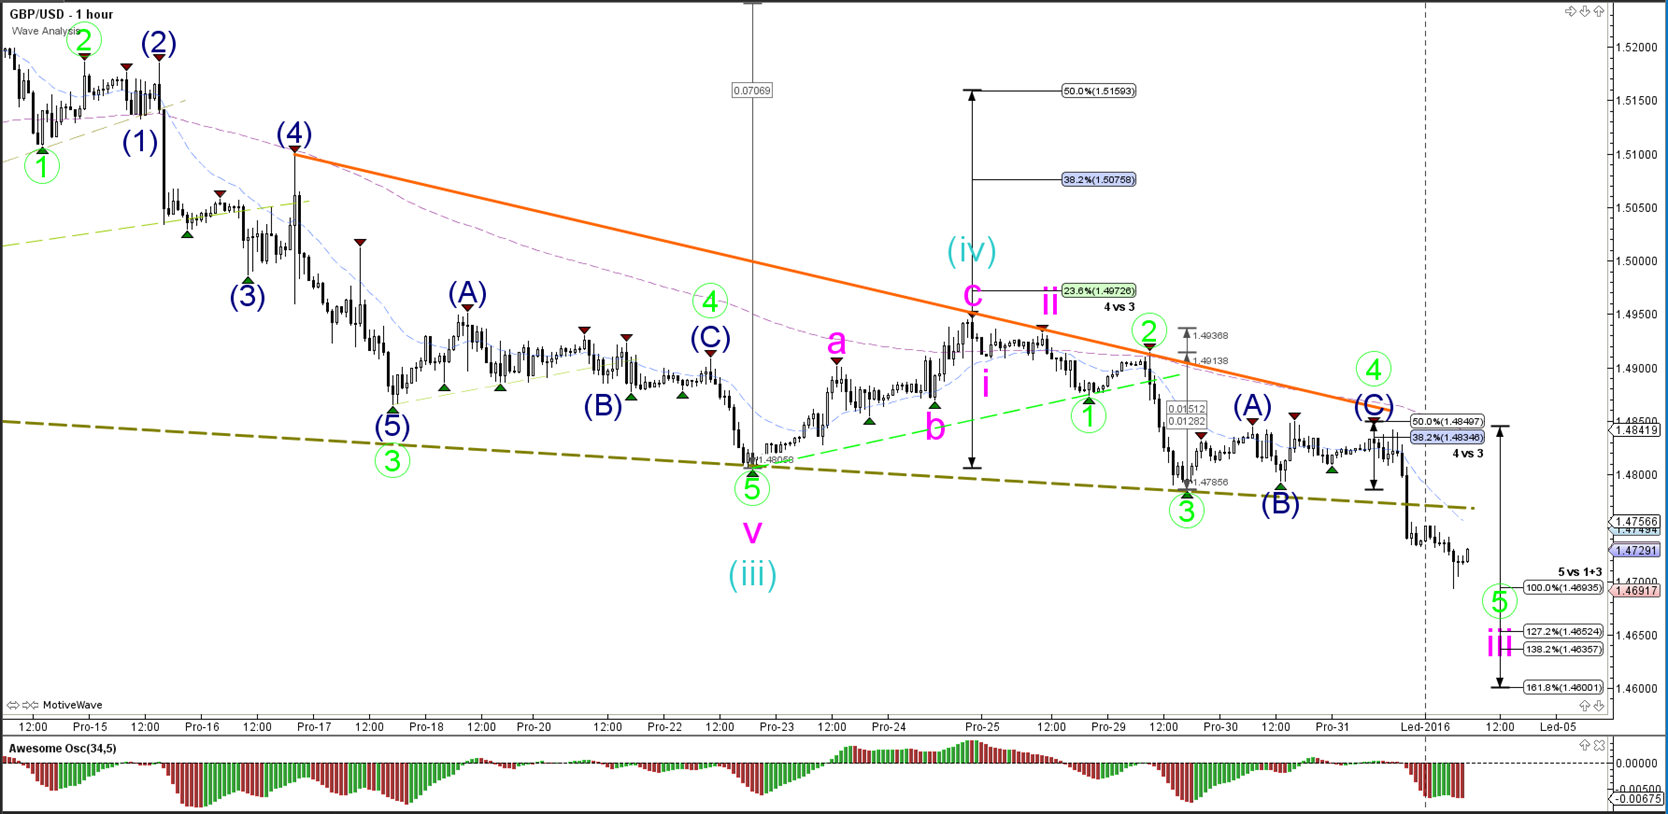
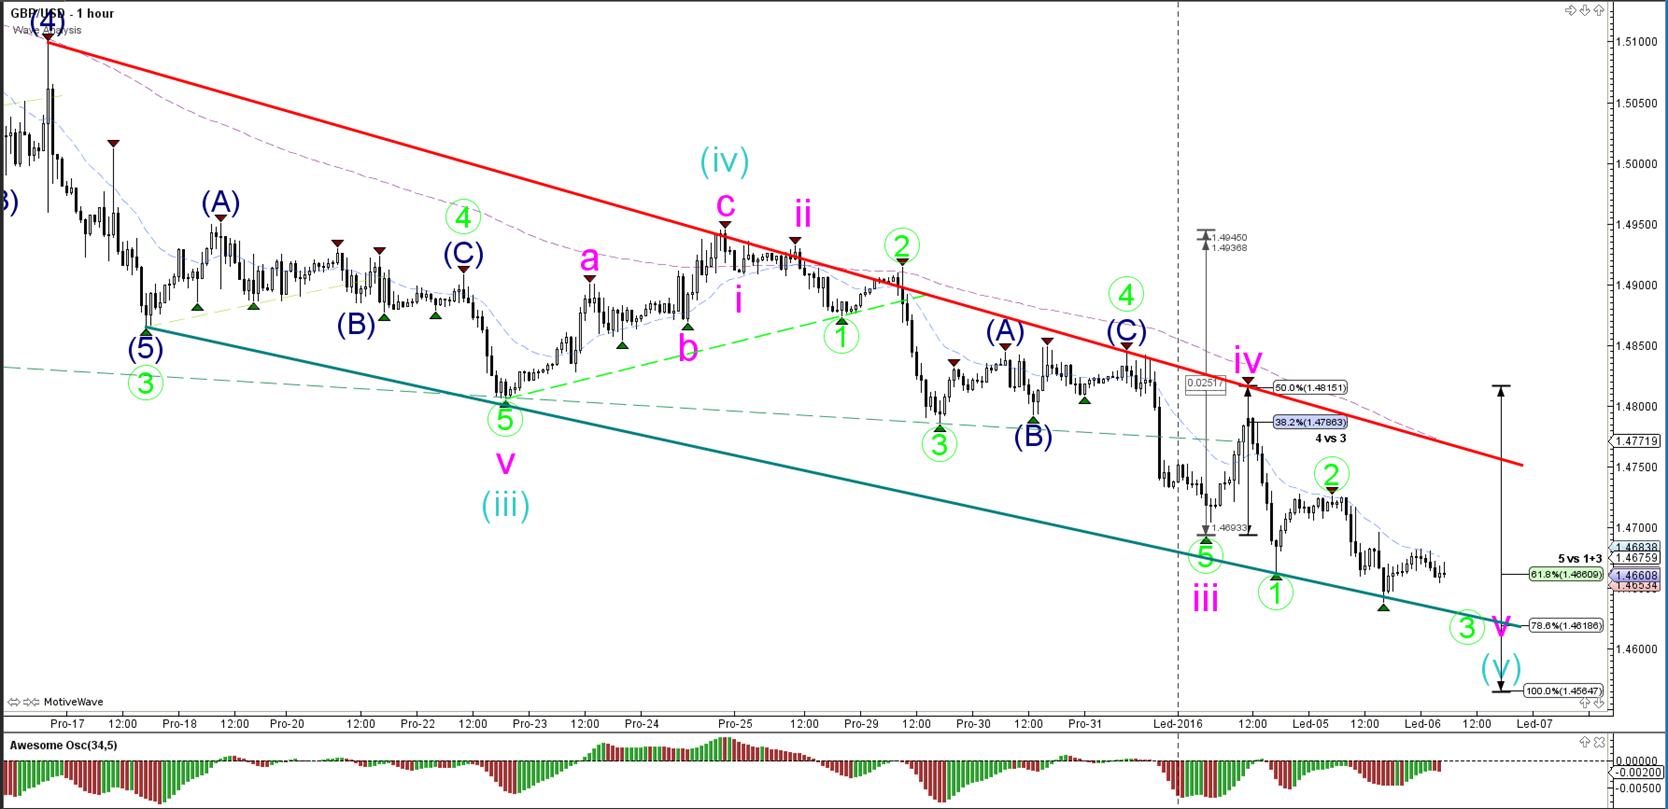
The GBP/USD broke below the support trend line (dotted green), which confirmed the completion of a shallow wave 4 (green) at the 50% Fibonacci level. Price has now moved down lower towards the Fibonacci targets of wave 5 (green).
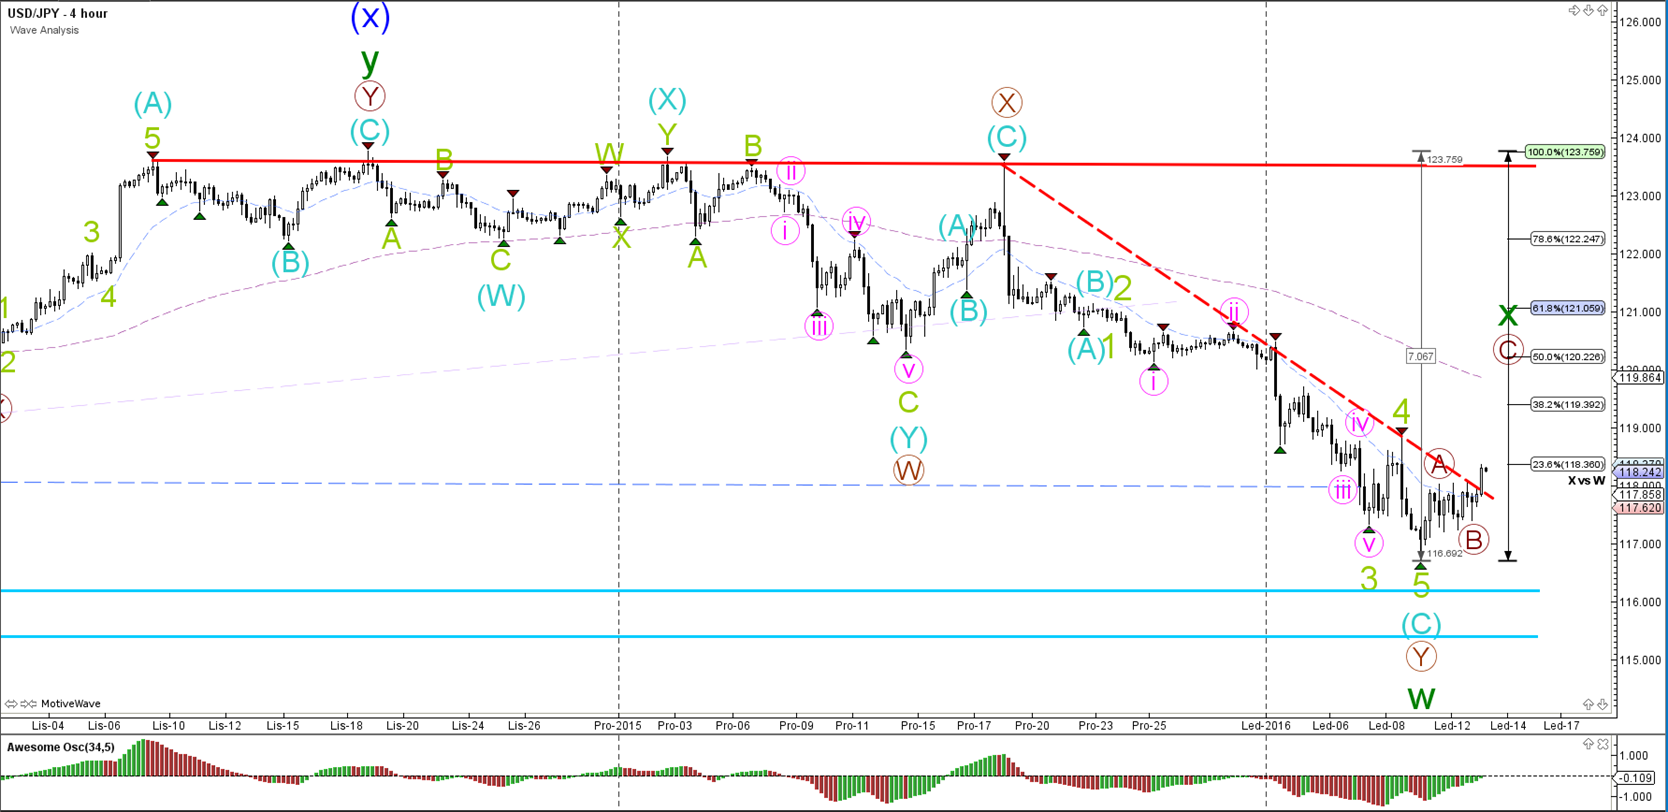
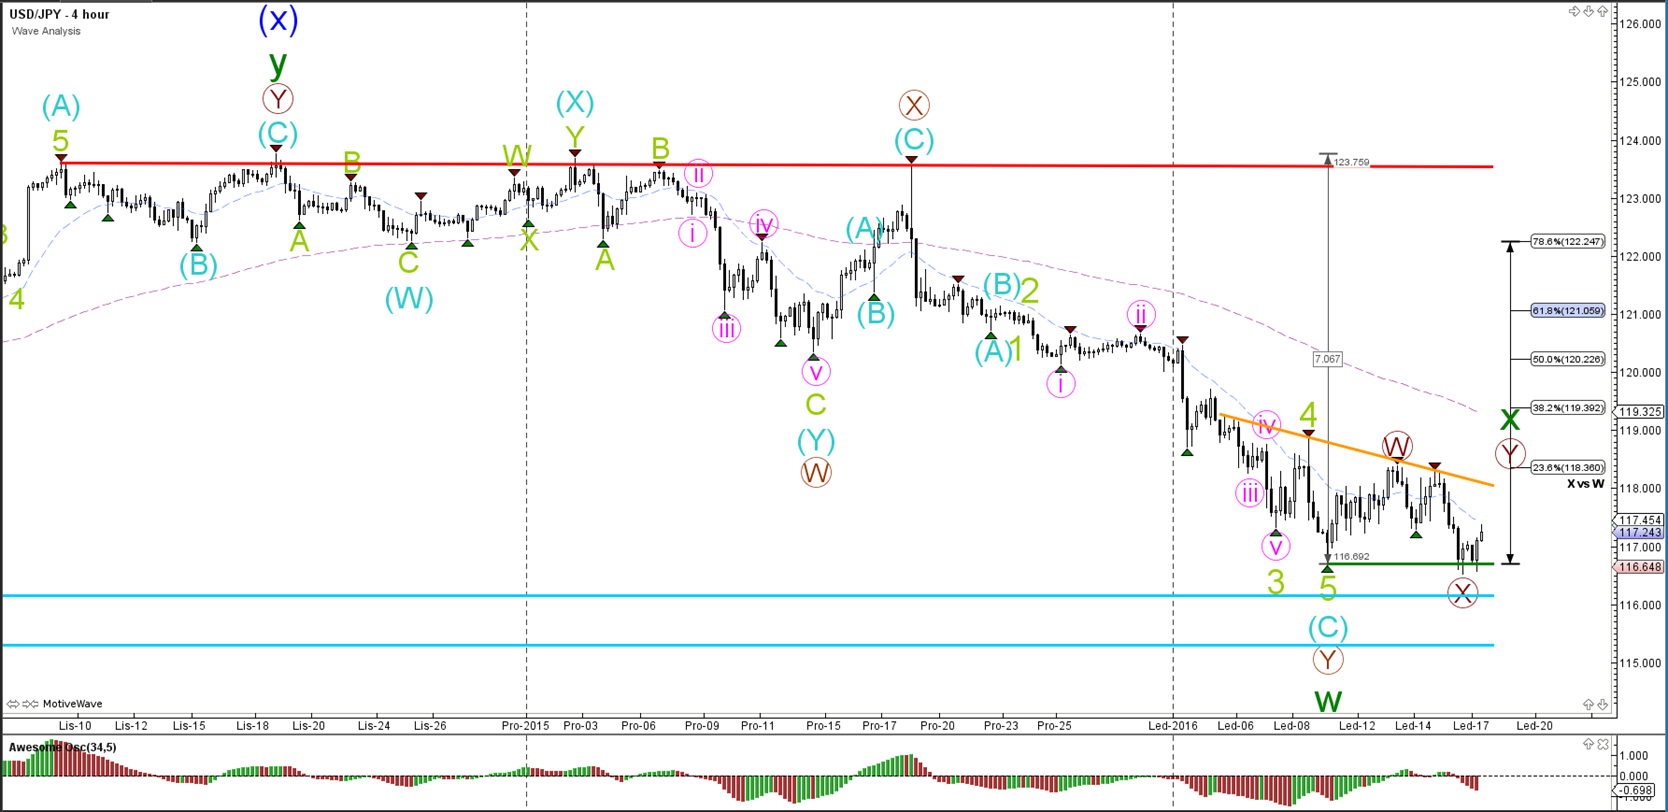
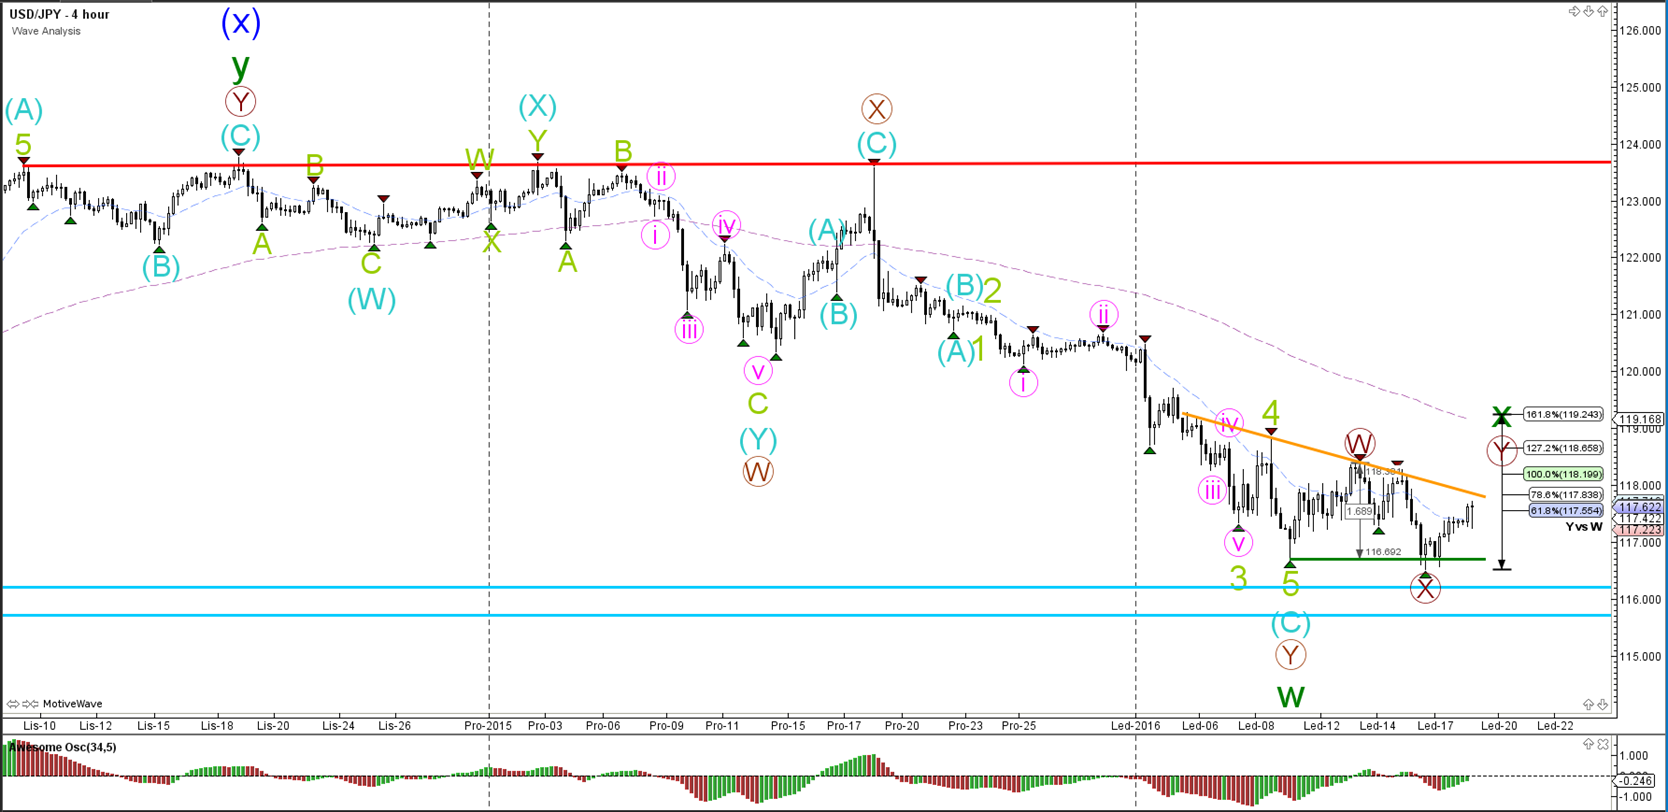
USD/JPY
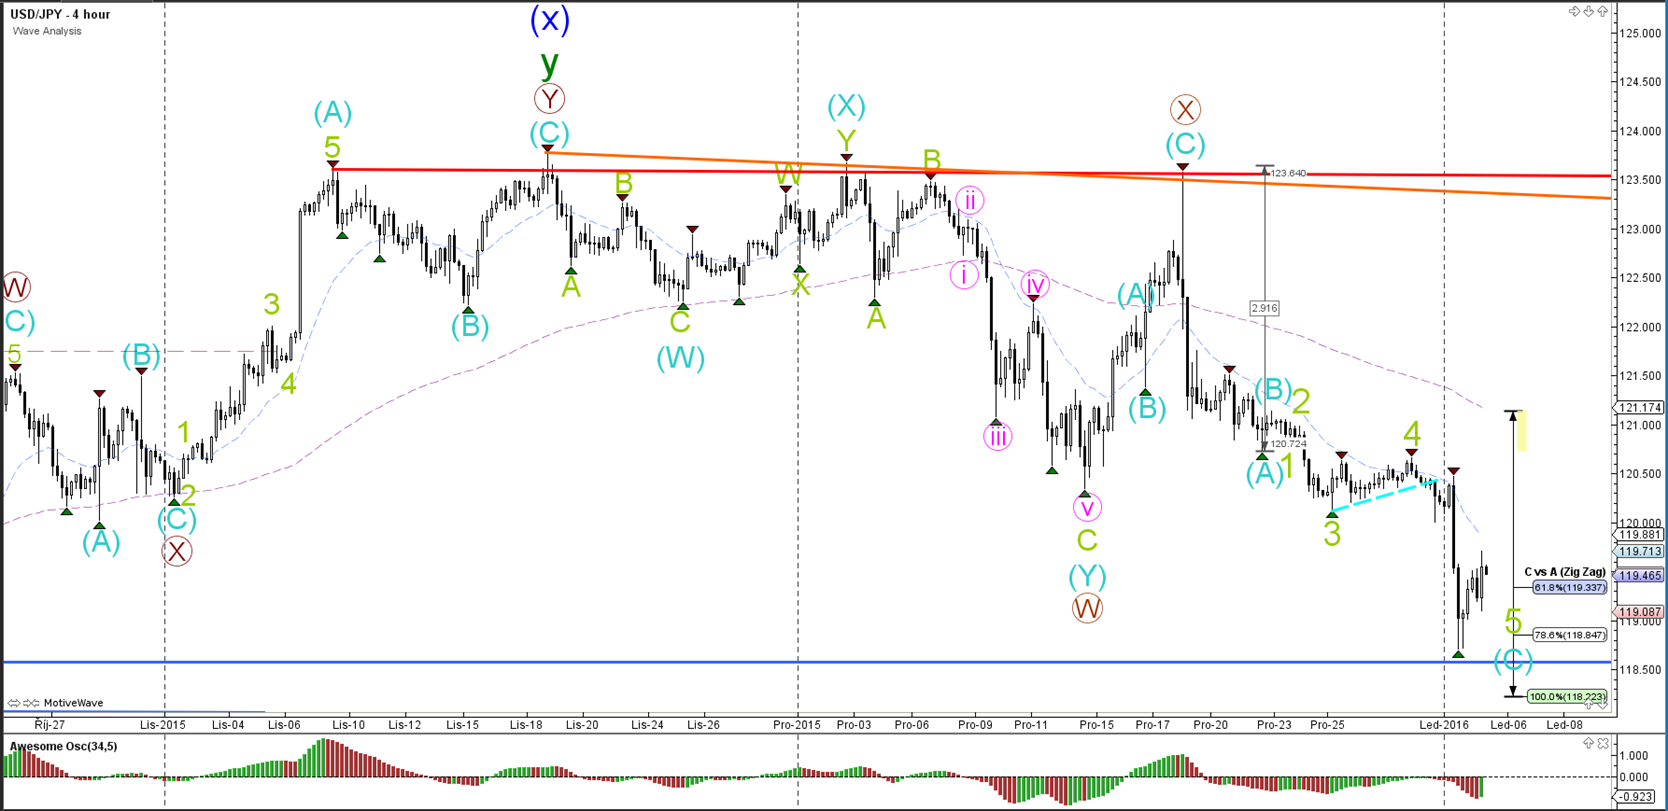
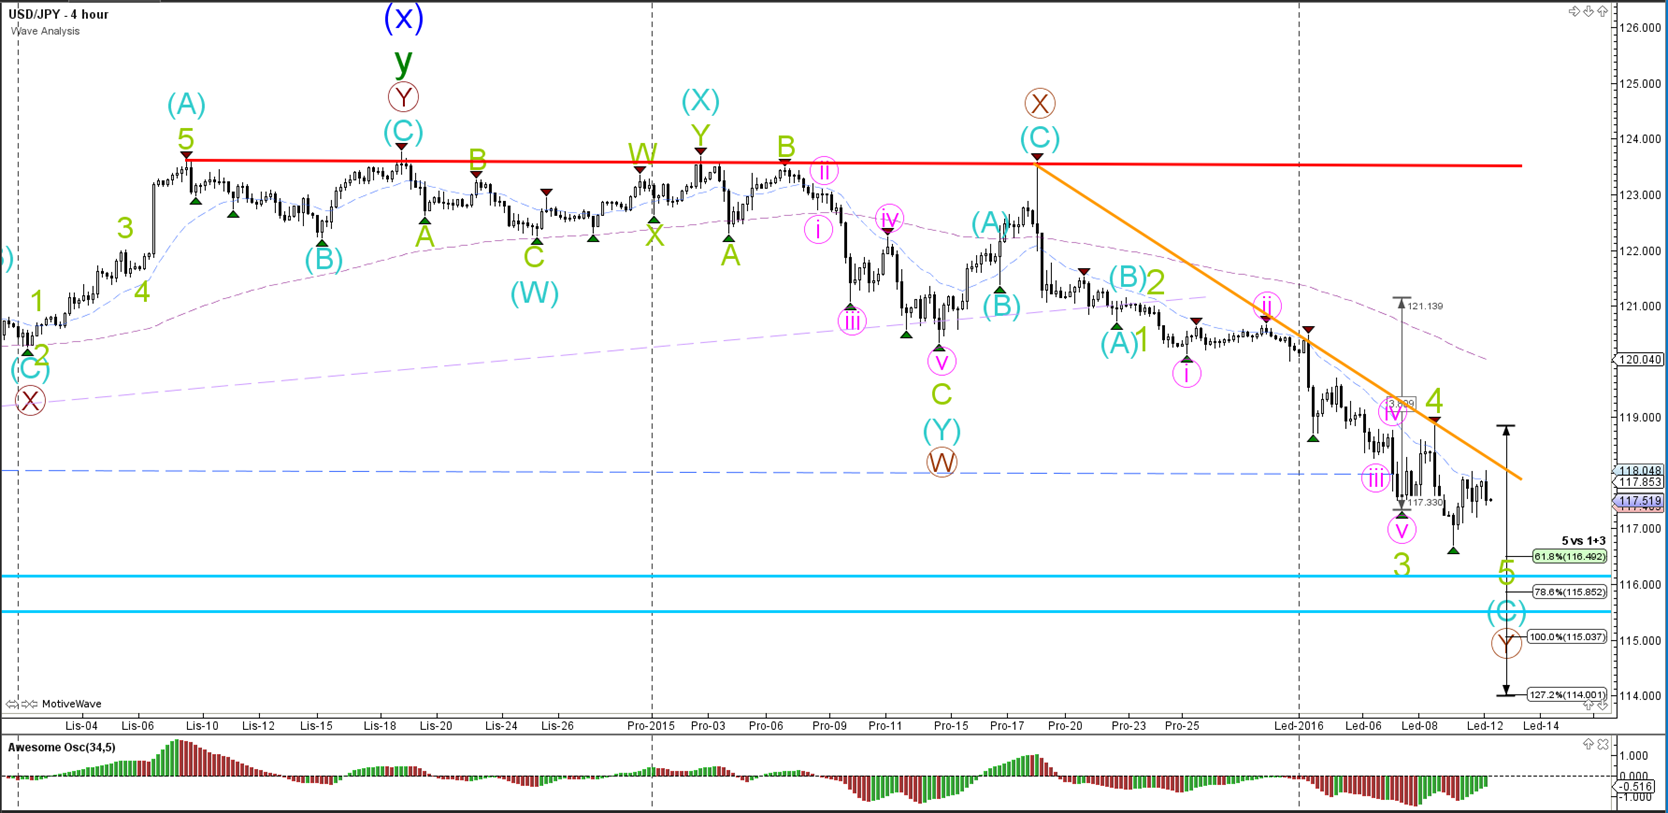
4 hour
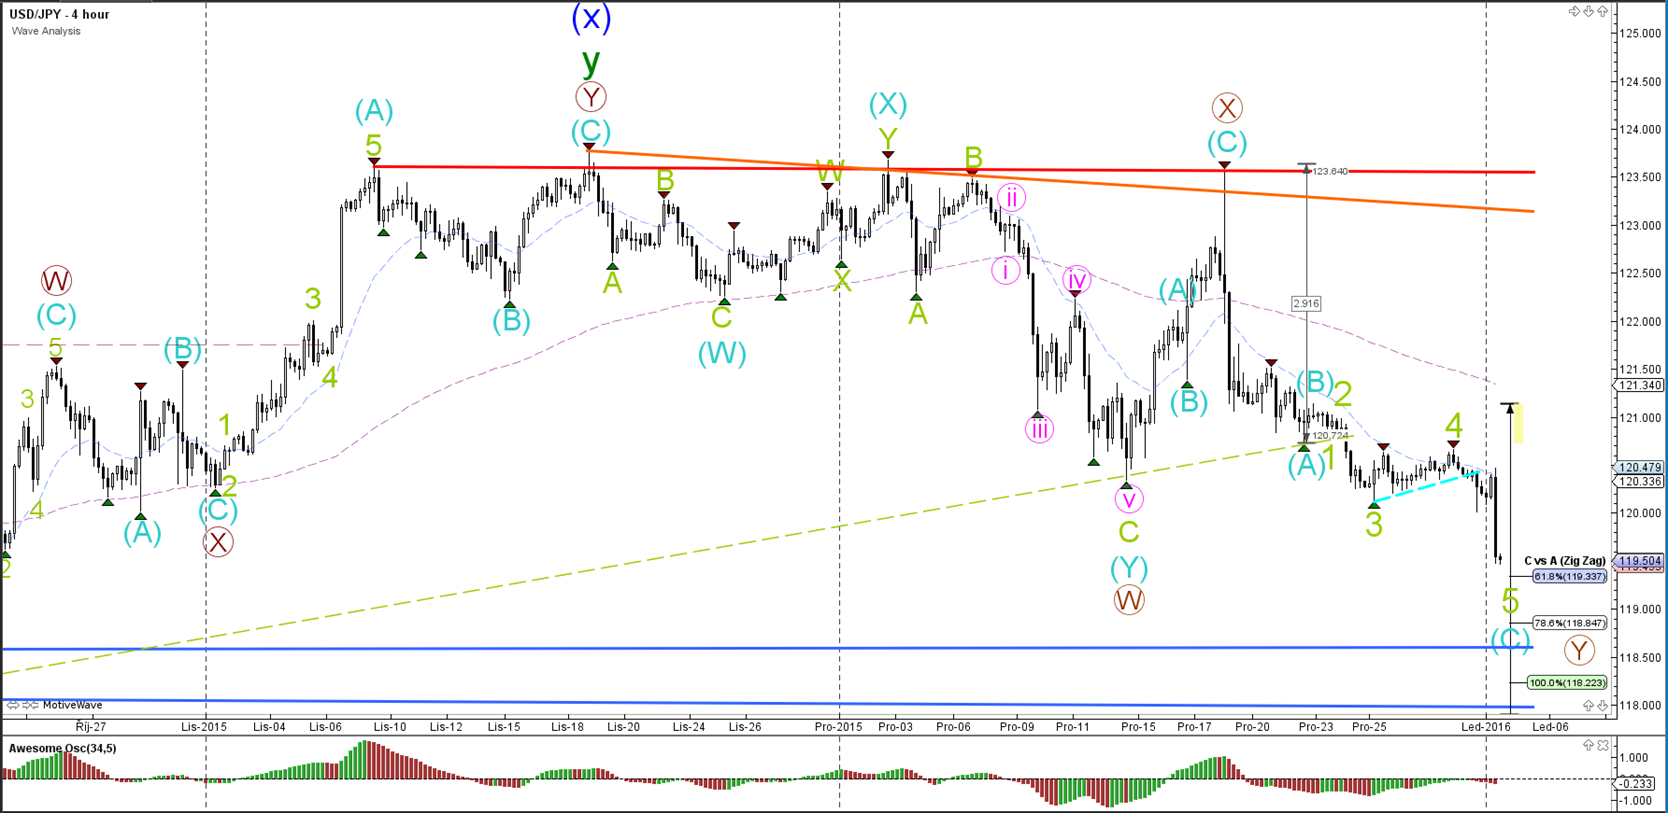
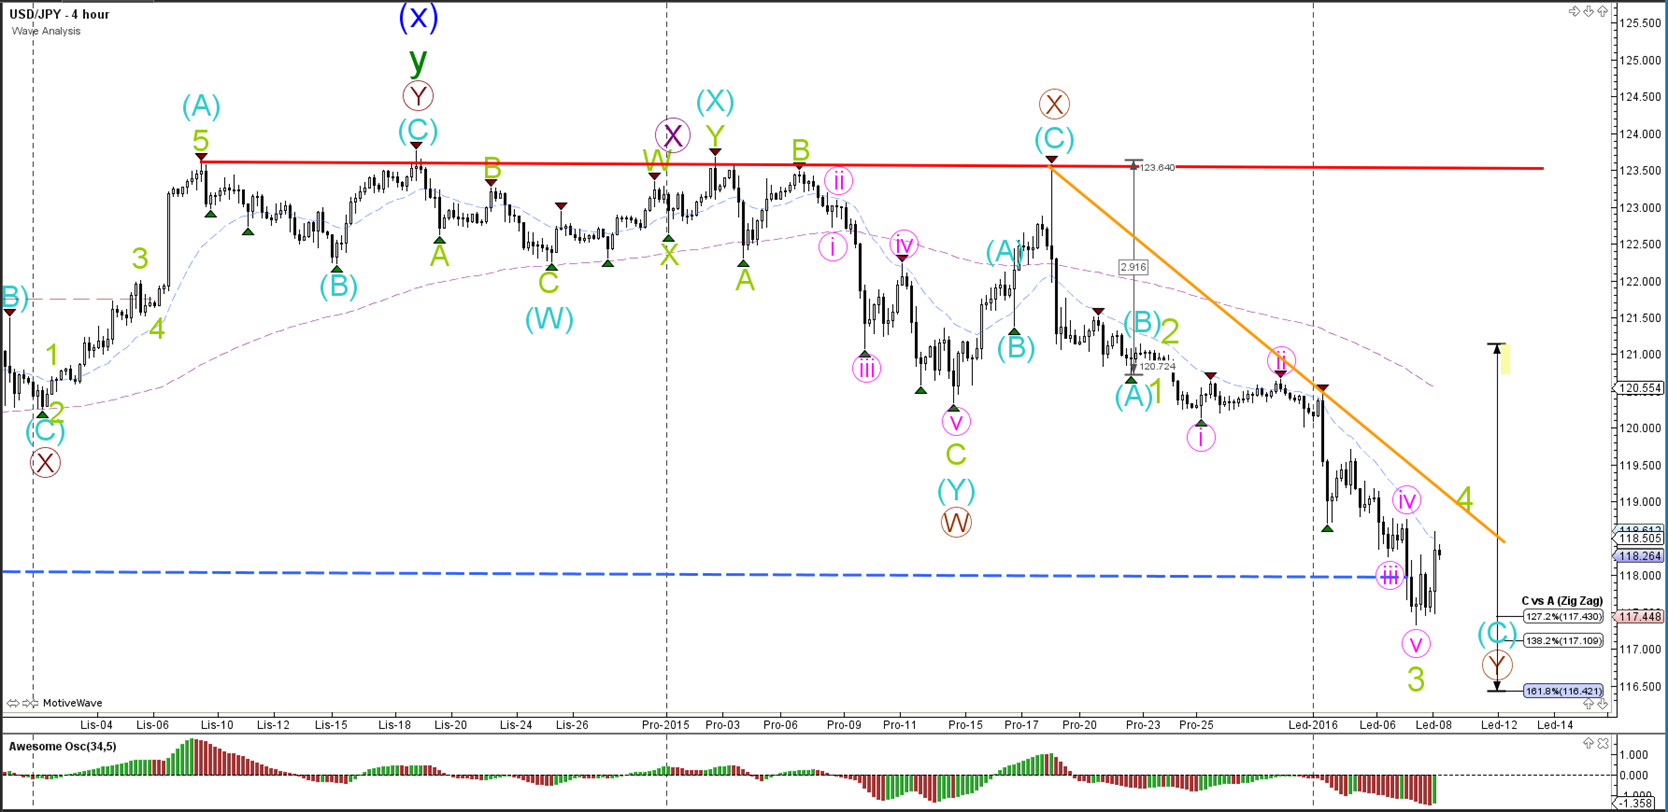
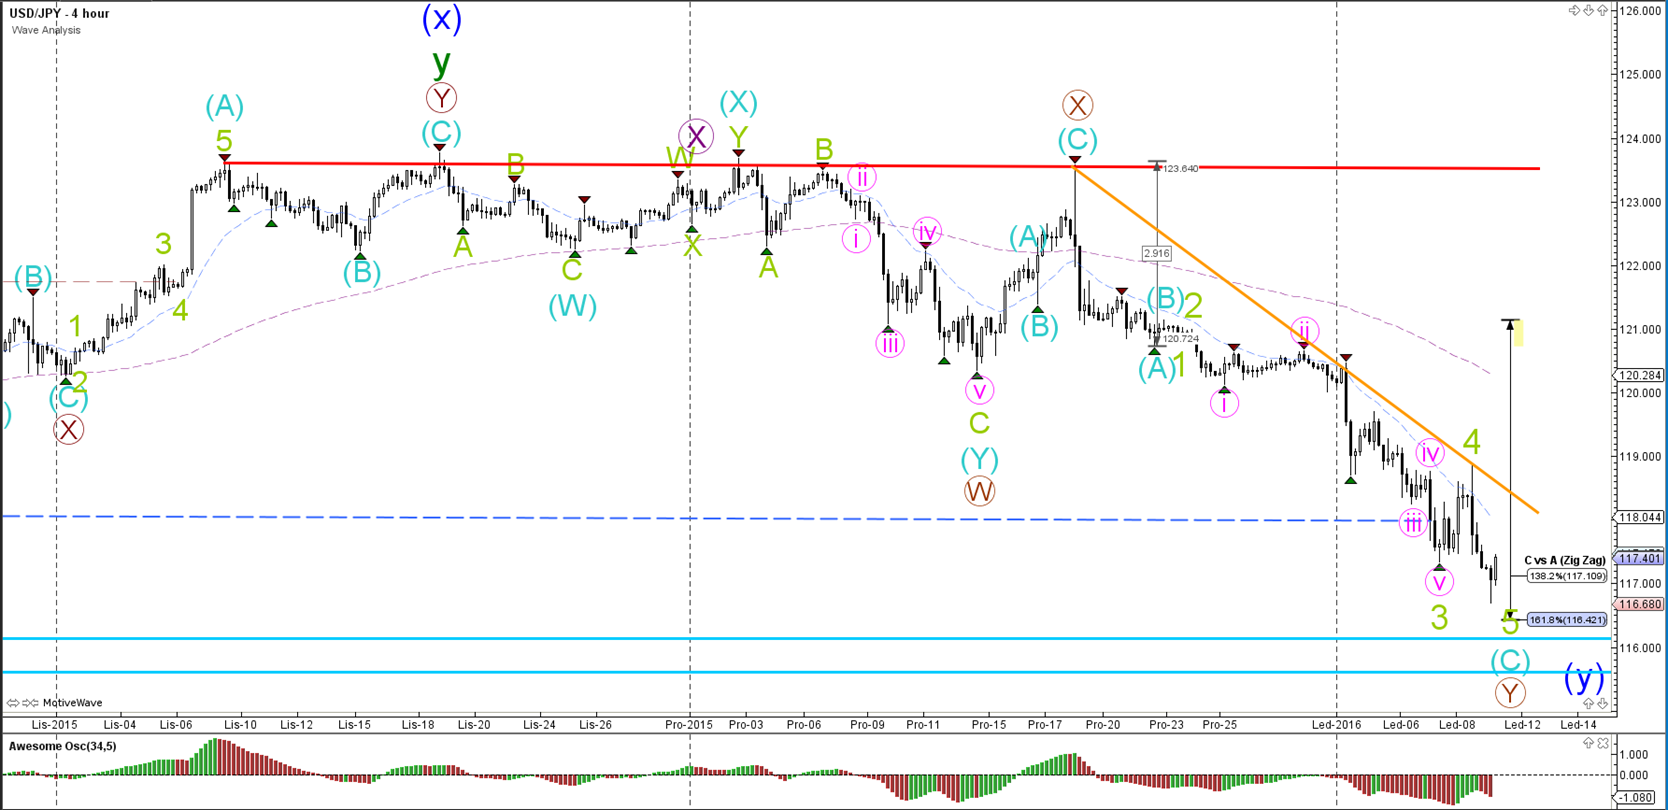
The USD/JPY is showing signs of bearish trend continuation as price keeps pushing to make lower lows. The blue support levels are support levels from the daily chart.
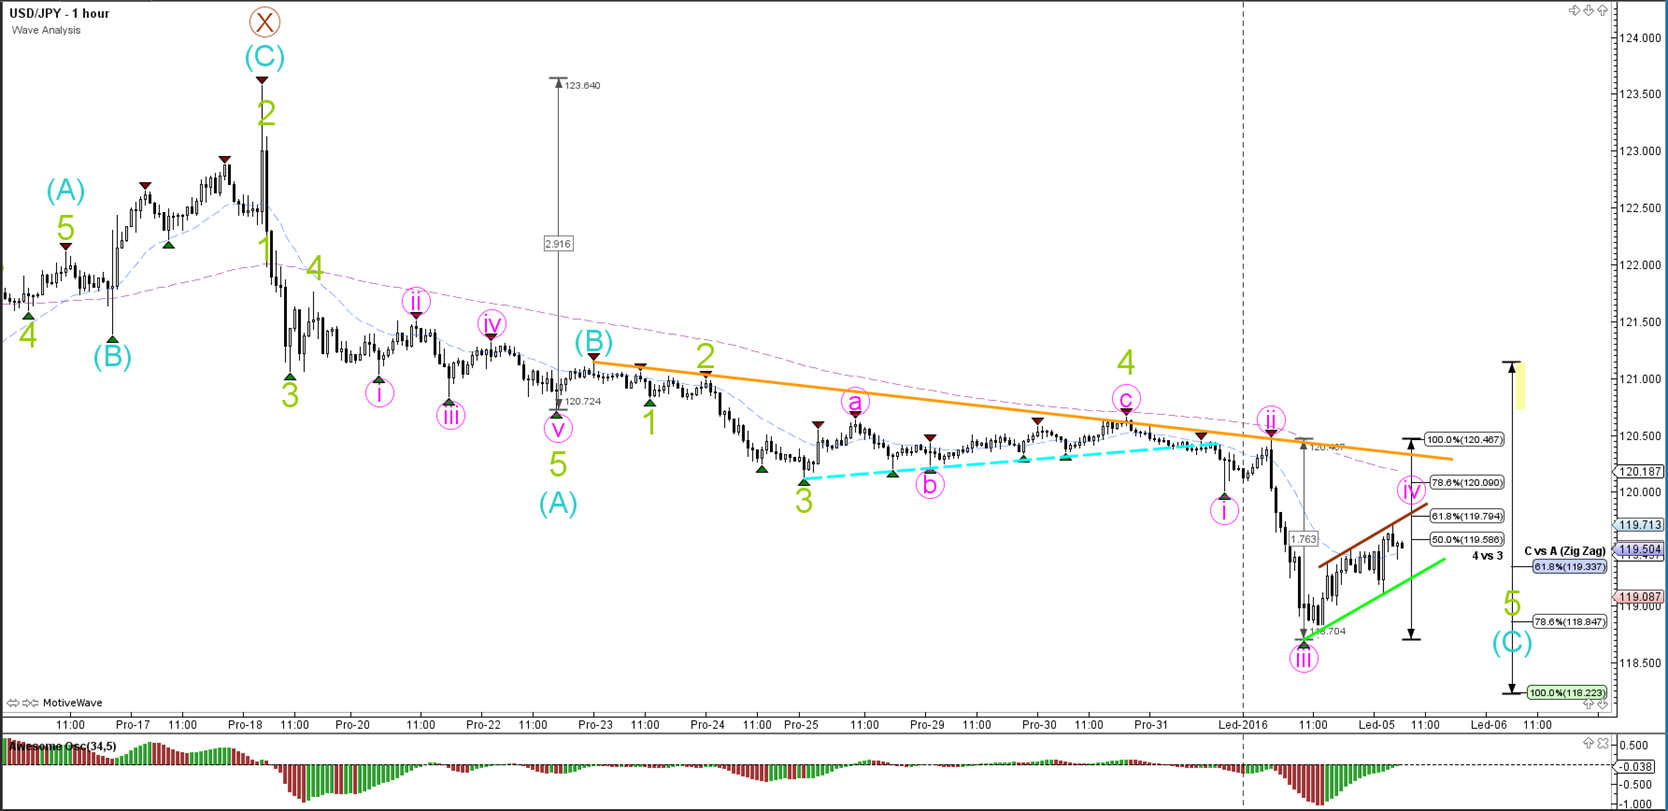
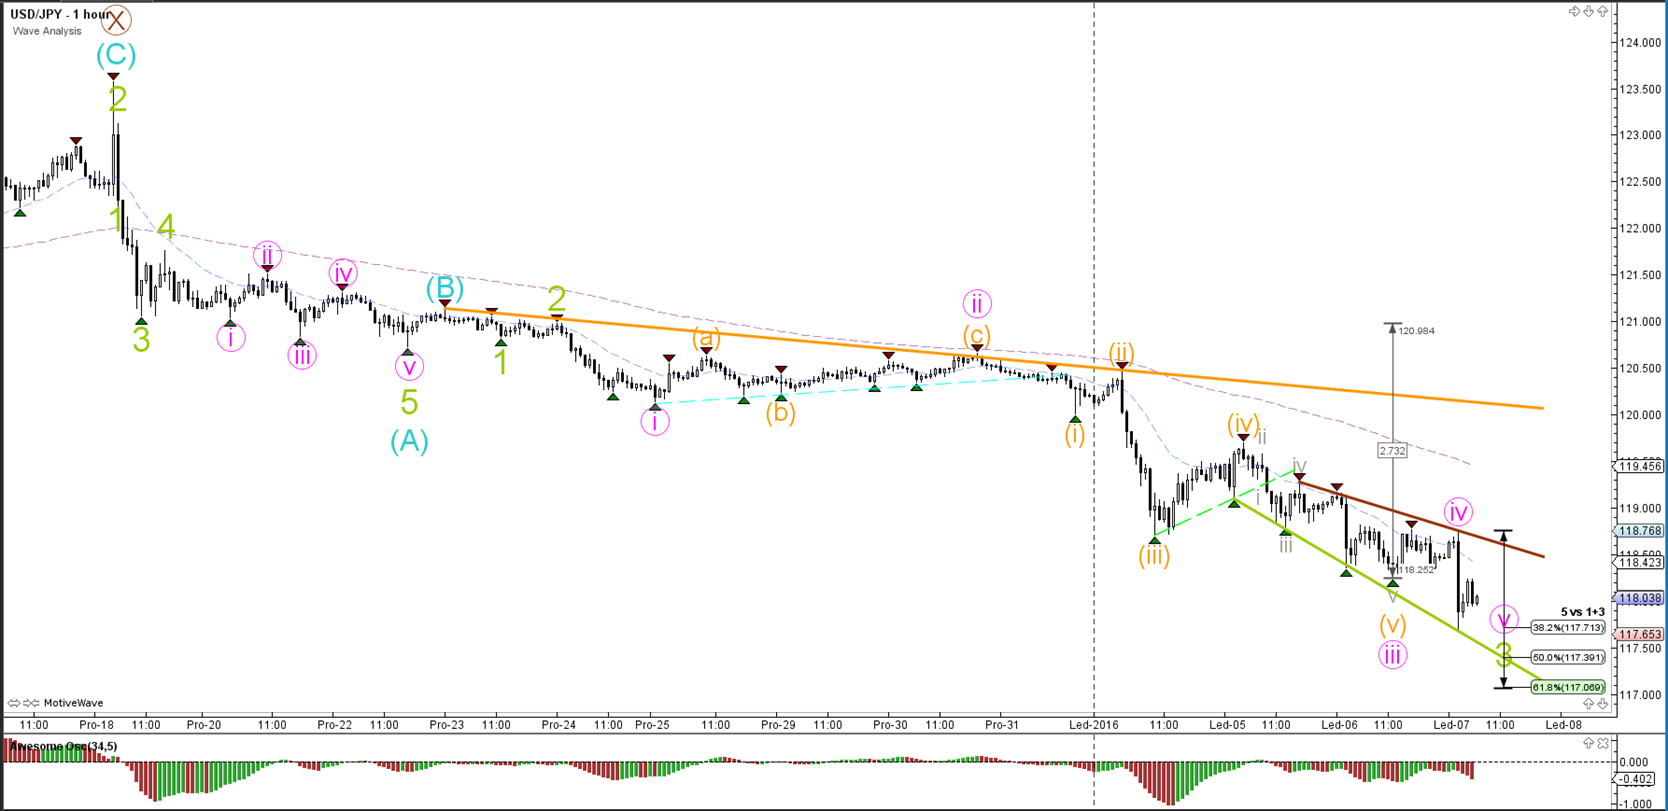
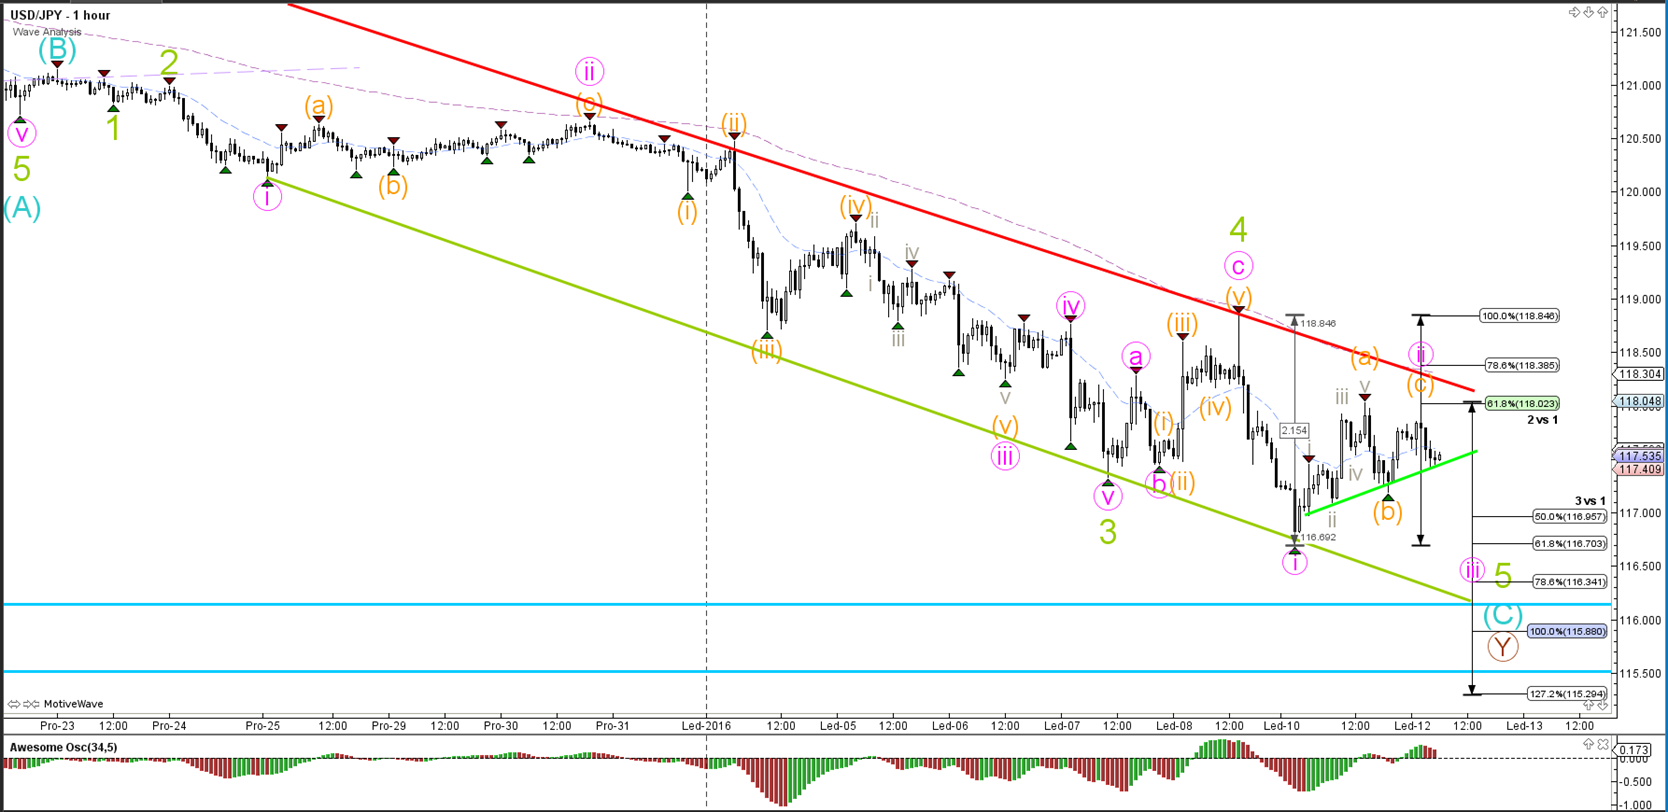
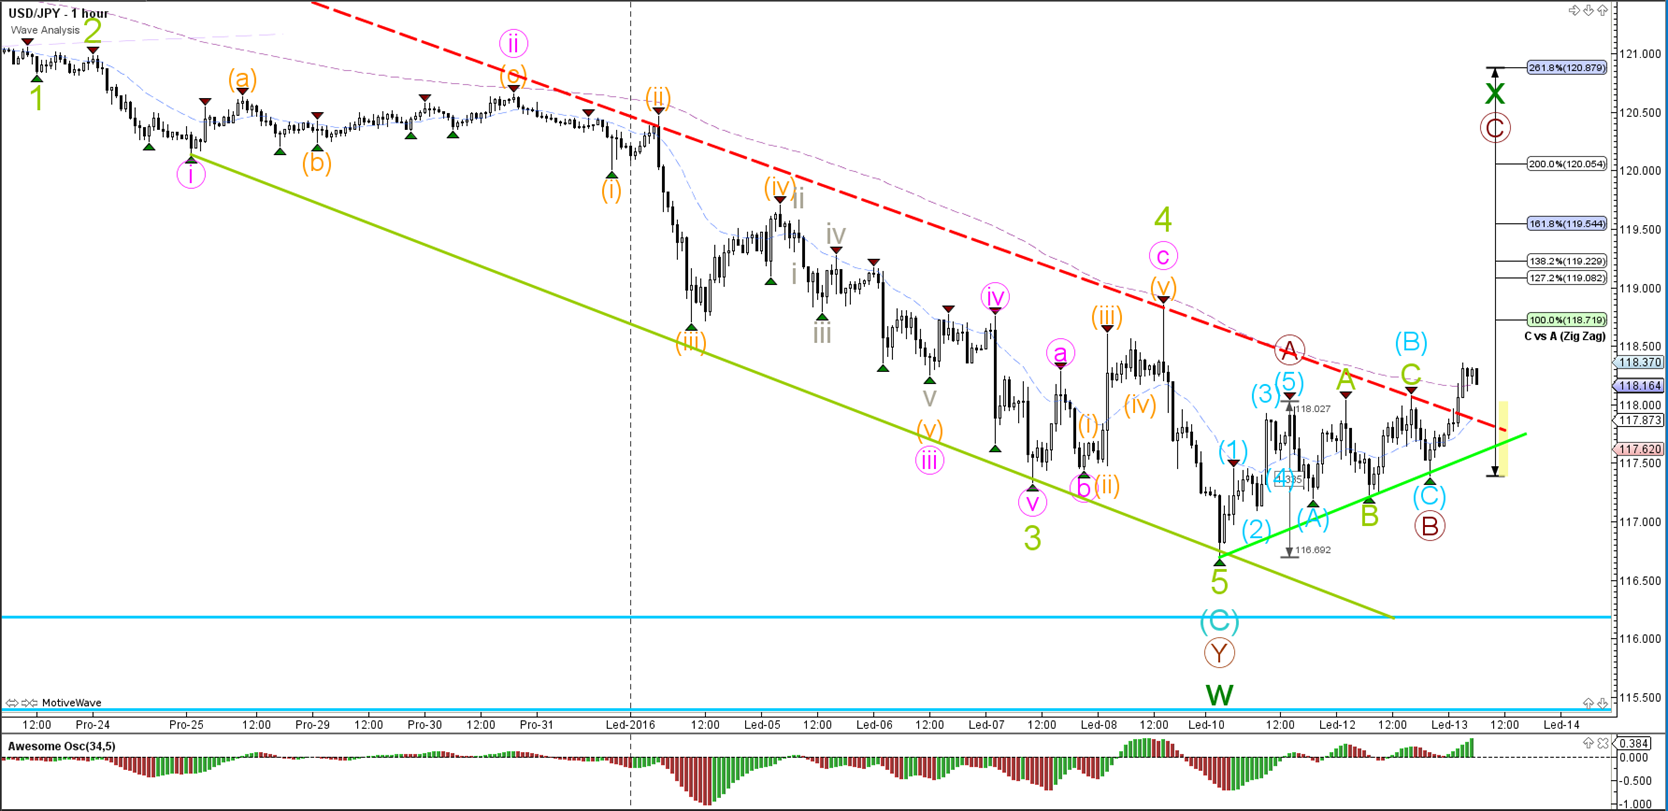
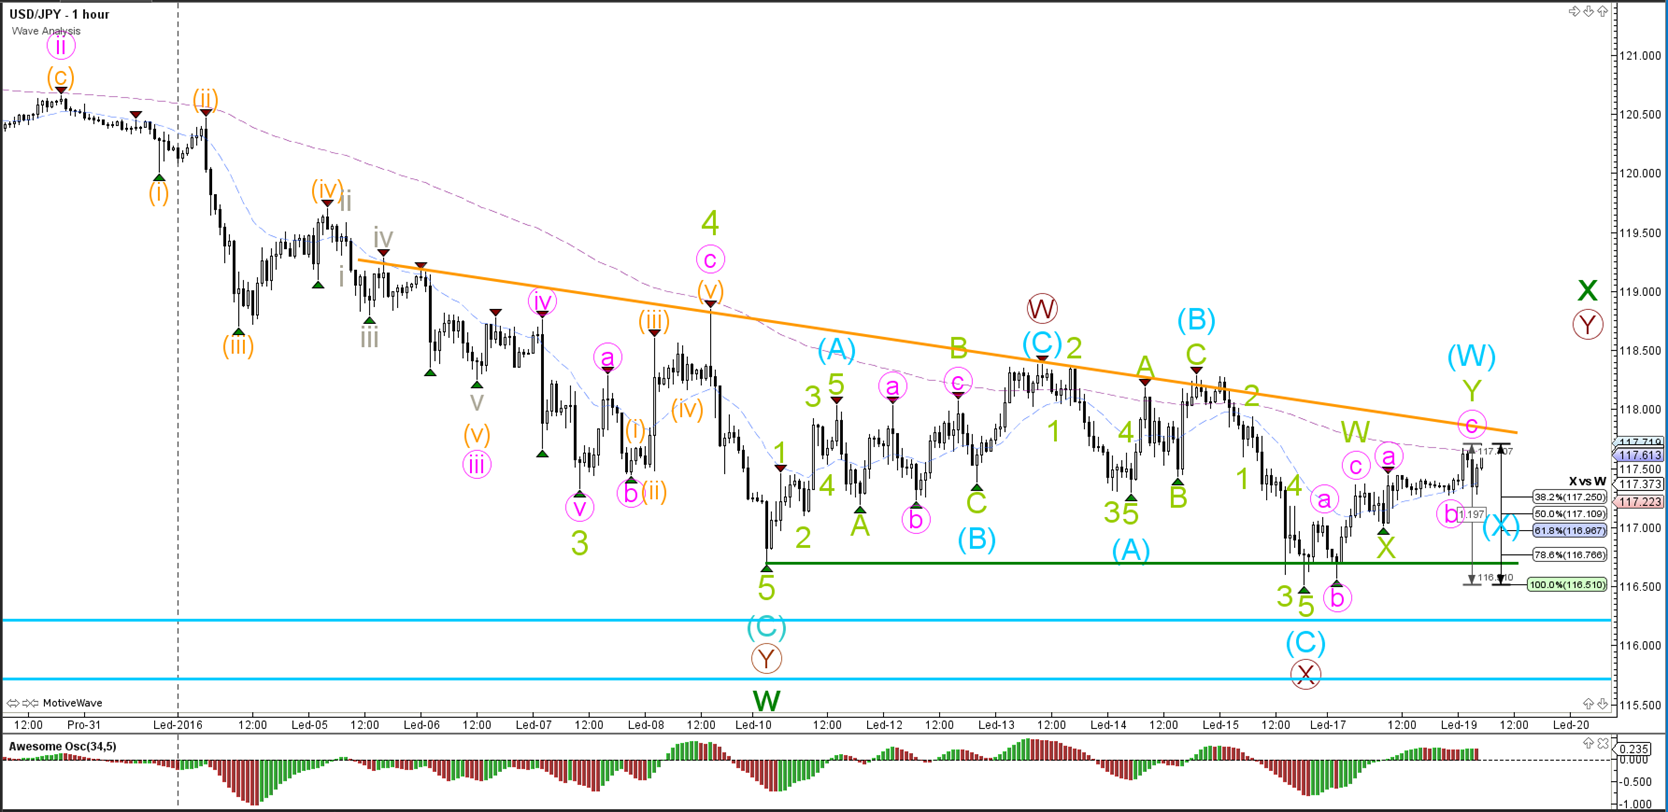
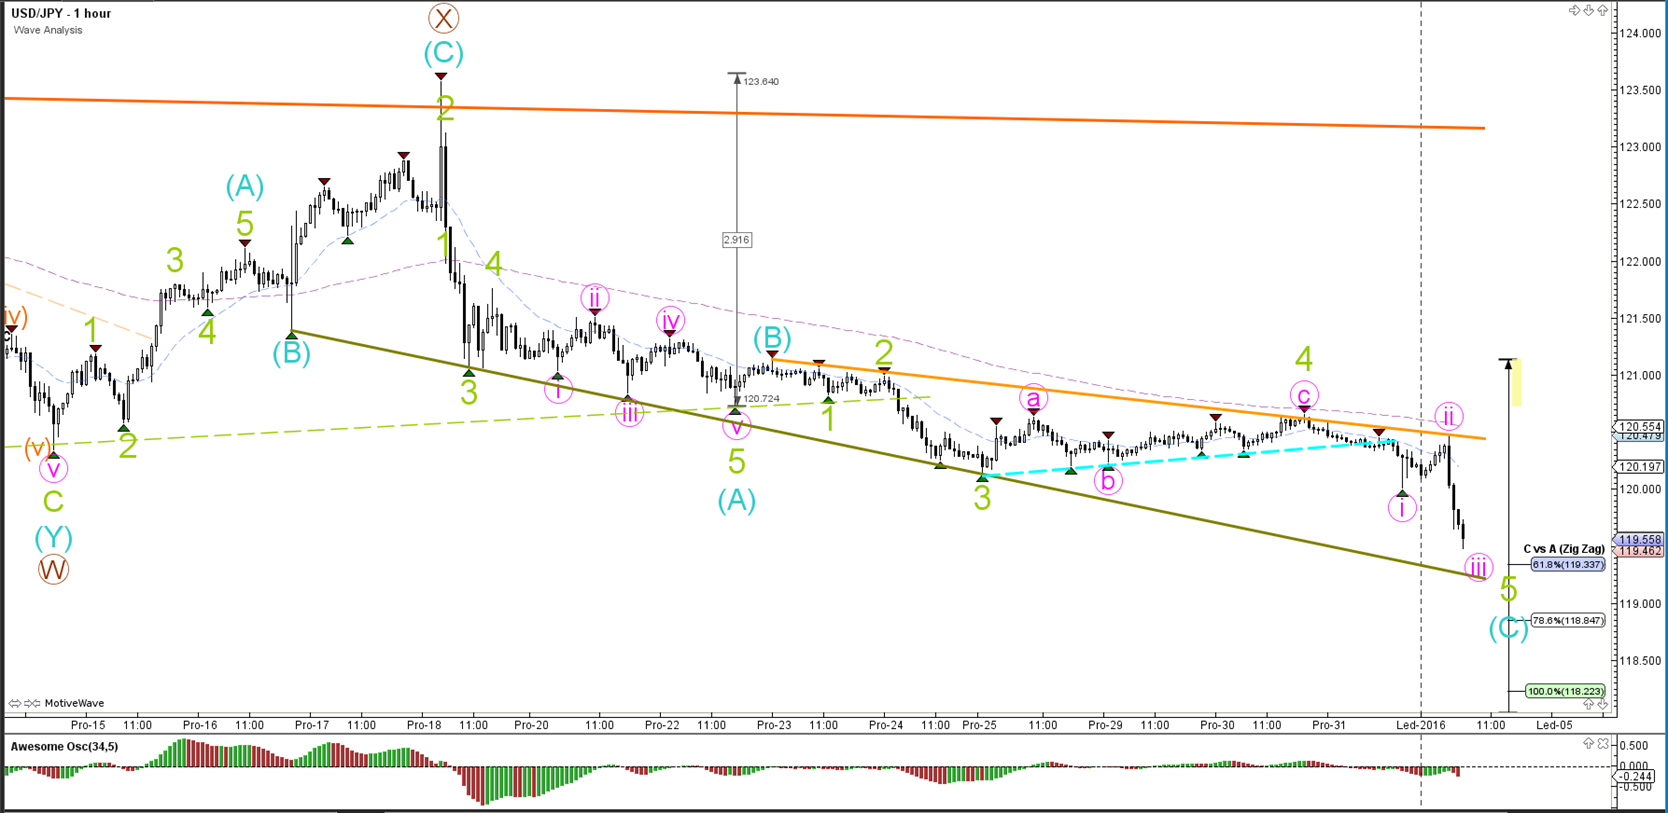
1 hour

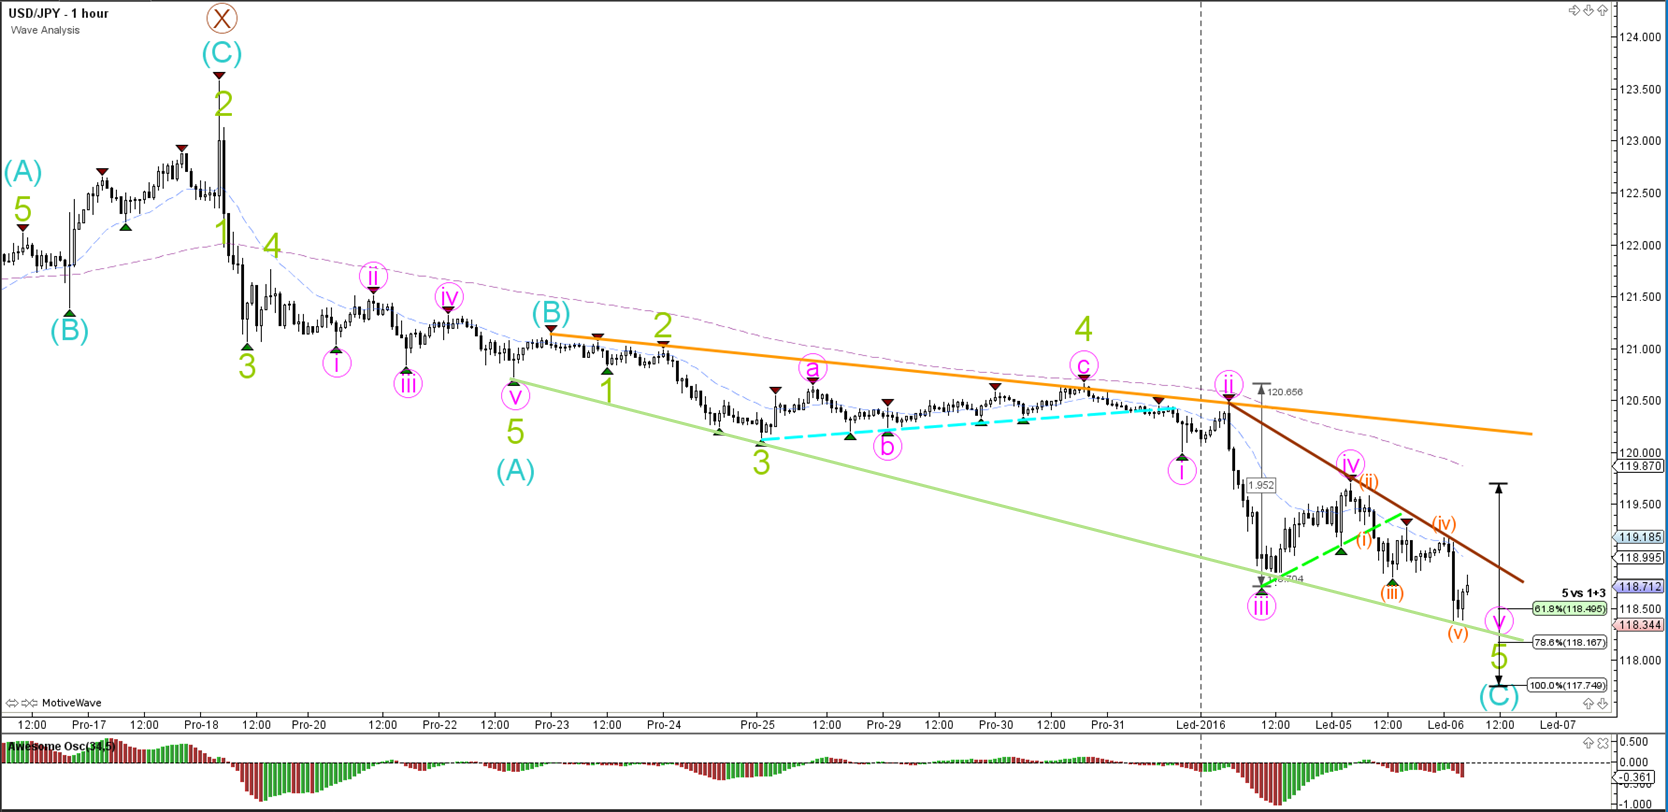
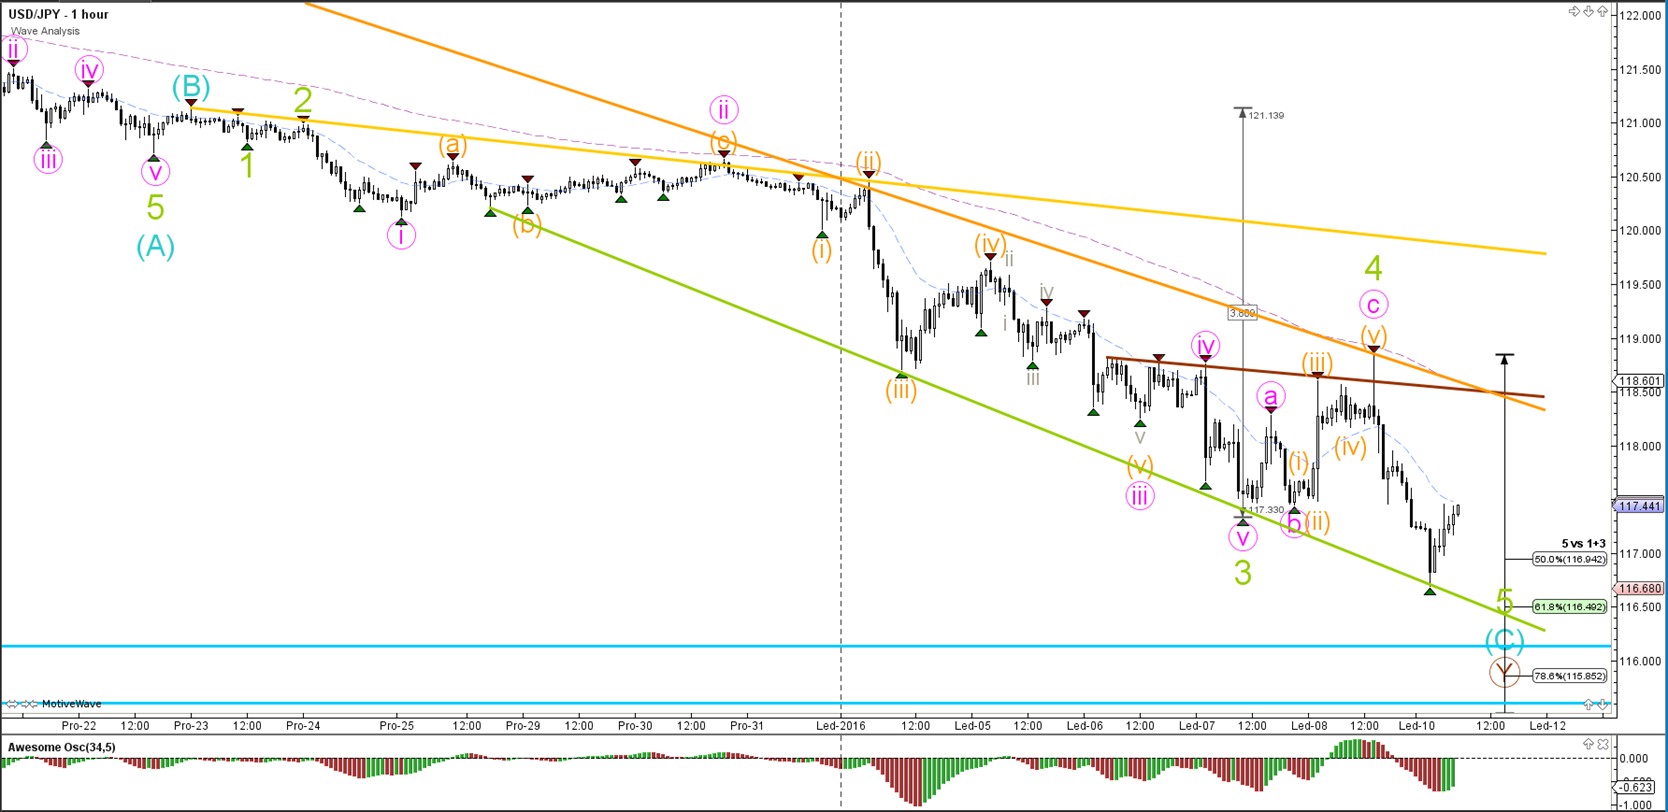
The USD/JPY has completed a shallow wave 4 (green) correction before breaking the support (blue) trend line and continuing lower as part of wave 5.
“Original analysis is provided by Admiral Markets”
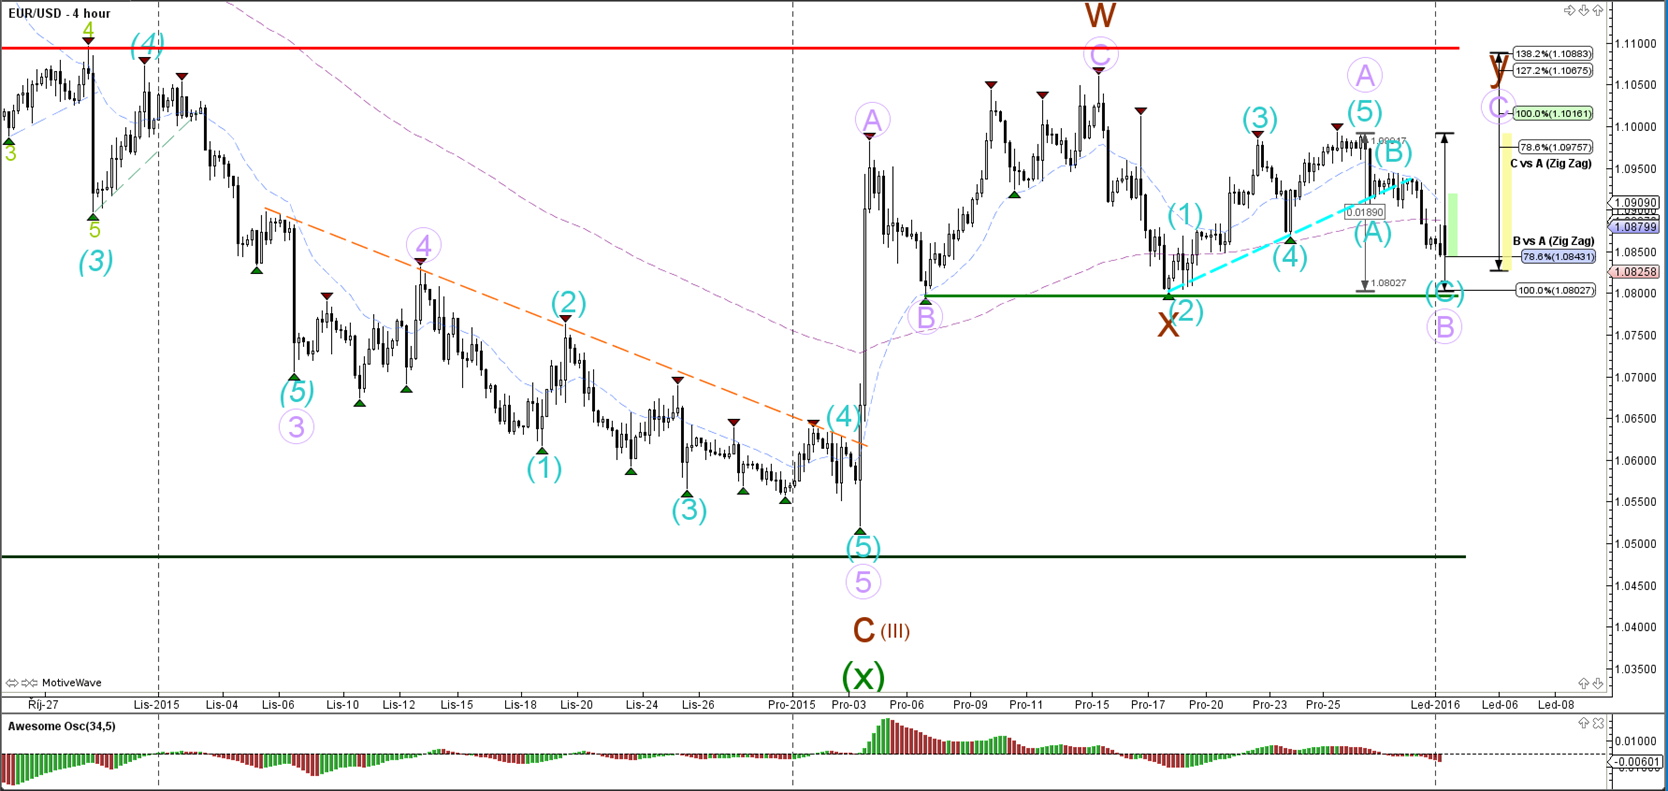
EUR/USD
4 hour

The EUR/USD is most likely in a wave B of a larger ABC (purple) zigzag. The wave count is invalidated if price breaks below the horizontal support (lighter green).
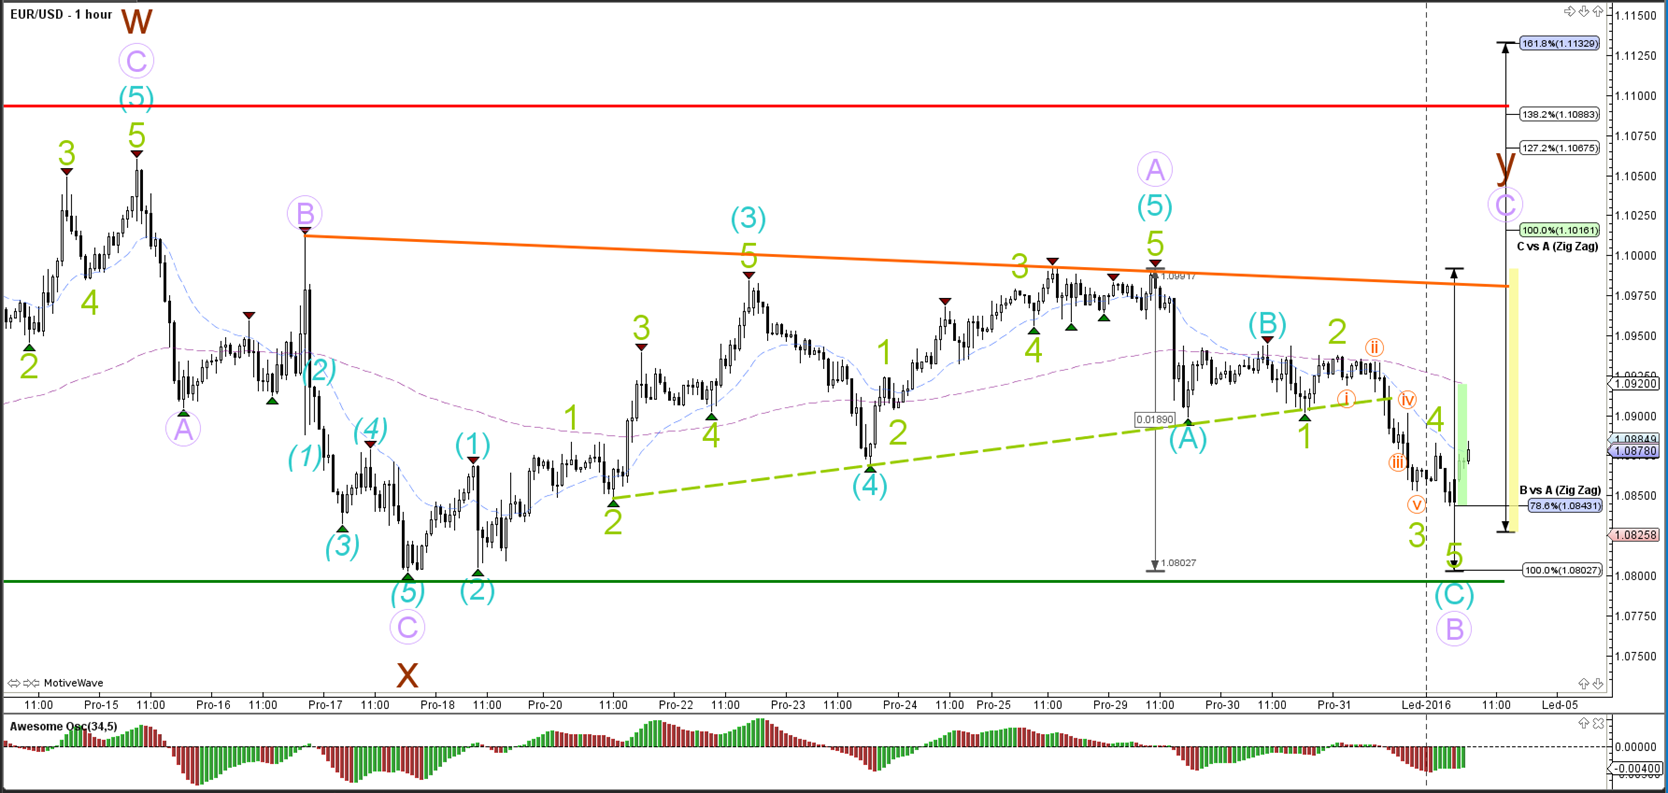
1 hour

The EUR/USD made a bearish break below the support trend line (dotted green) as part of a 5th wave (green), which could potential complete a wave C (blue) of a wave B (purple). Price has bounced at the 78.6% Fib and a break below the 100% mark invalidates this wave count.
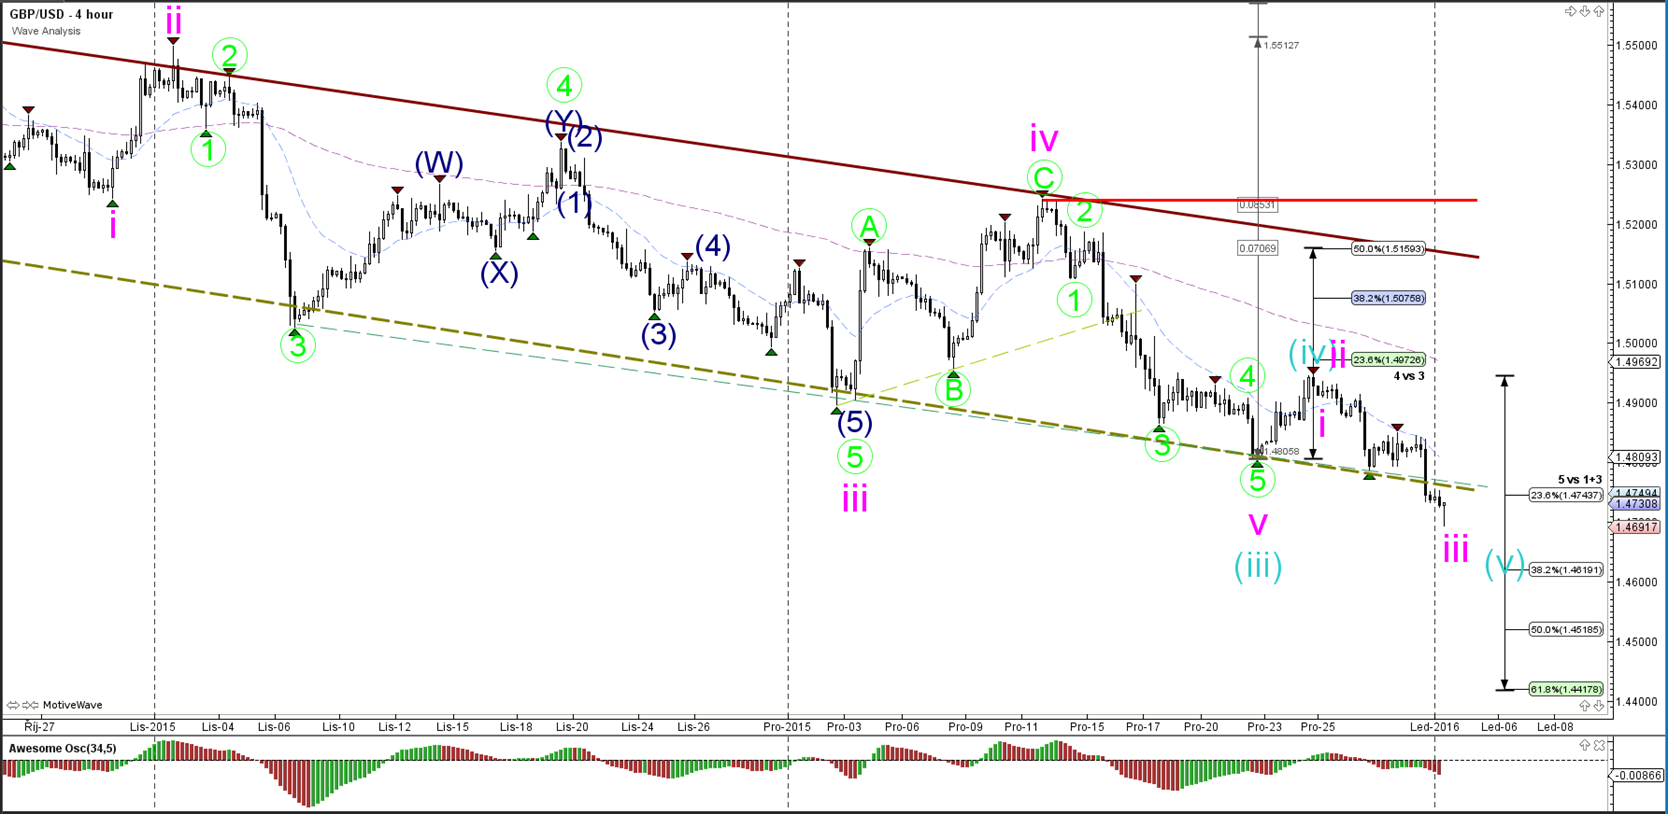
GBP/USD
4 hour

The GBP/USD is attempting to break below the downtrend channel, which could indicate wave 3 (pink) continuation.
1 hour

The GBP/USD broke below the support trend line (dotted green), which confirmed the completion of a shallow wave 4 (green) at the 50% Fibonacci level. Price has now moved down lower towards the Fibonacci targets of wave 5 (green).
USD/JPY
4 hour

The USD/JPY is showing signs of bearish trend continuation as price keeps pushing to make lower lows. The blue support levels are support levels from the daily chart.
1 hour
The USD/JPY has completed a shallow wave 4 (green) correction before breaking the support (blue) trend line and continuing lower as part of wave 5.
“Original analysis is provided by Admiral Markets”