Admiral Markets
AdmiralMarkets.com Representative
- Messages
- 95
Impact of massive bullish breaks on currency waves
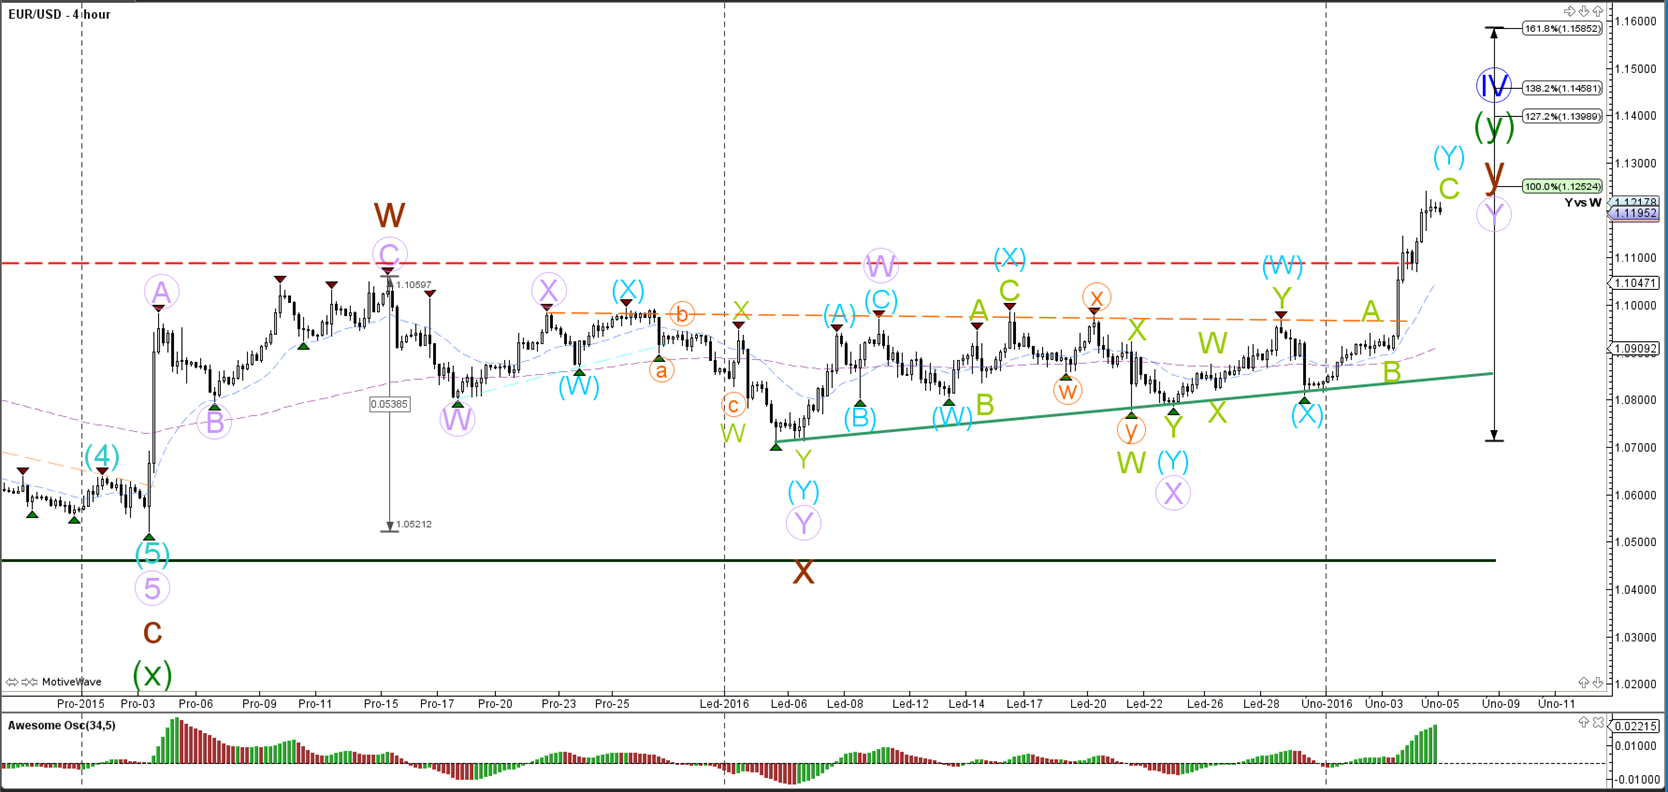
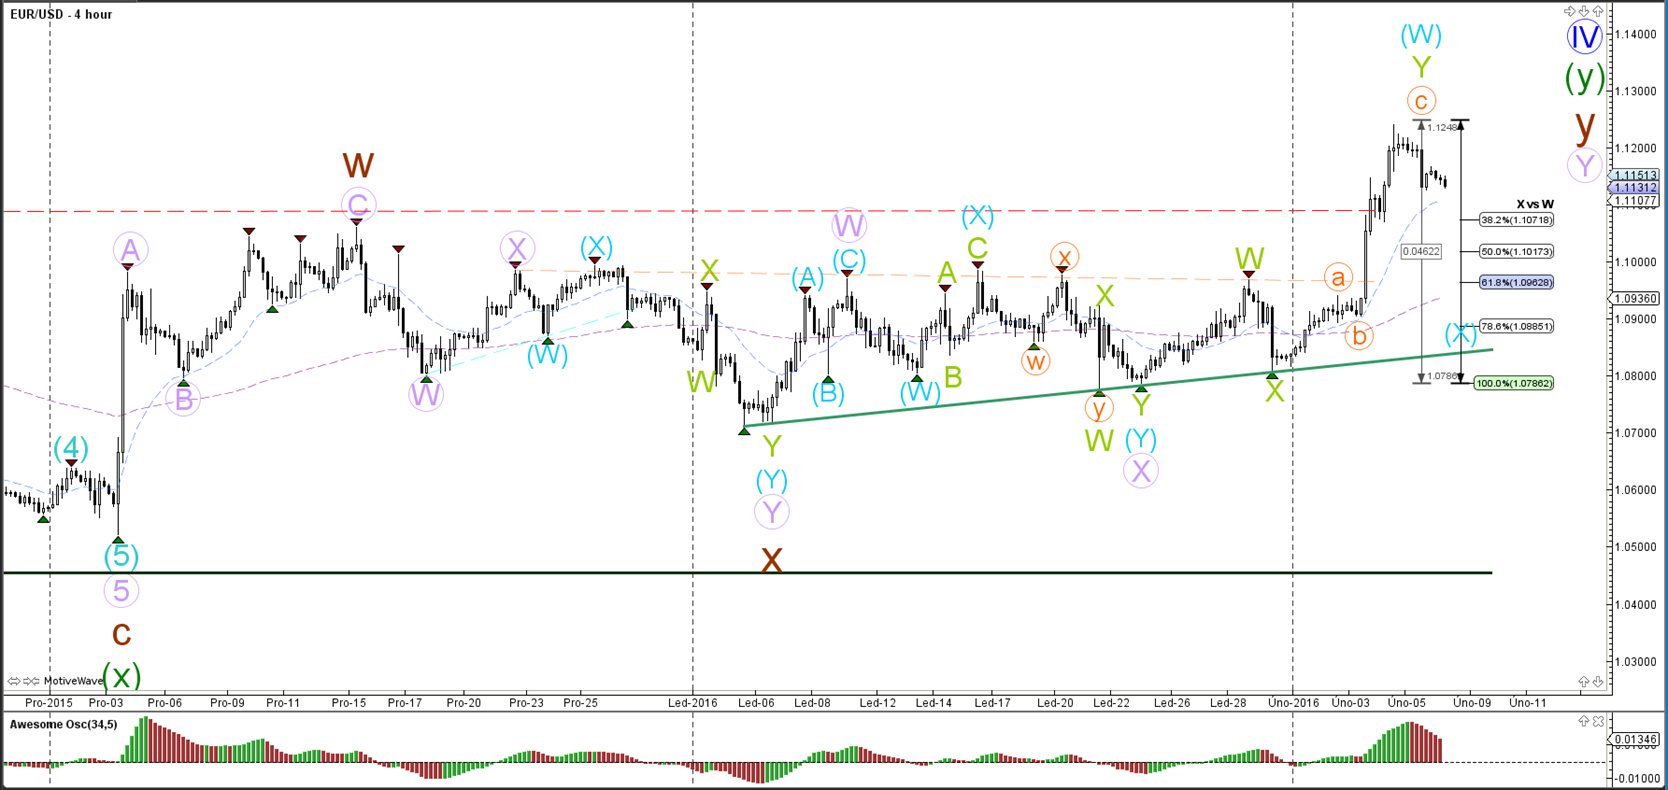
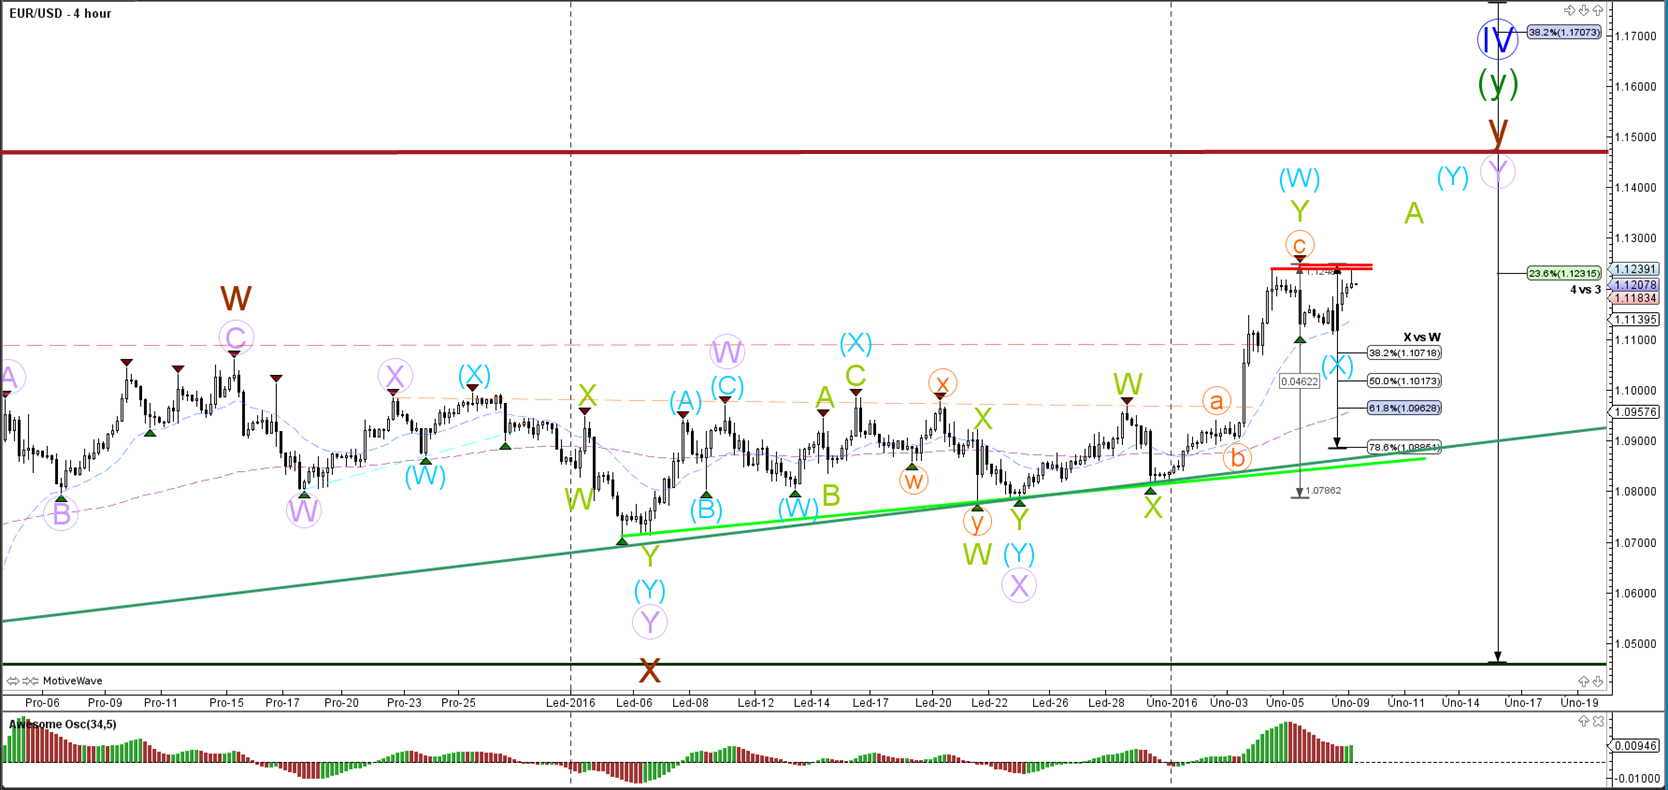
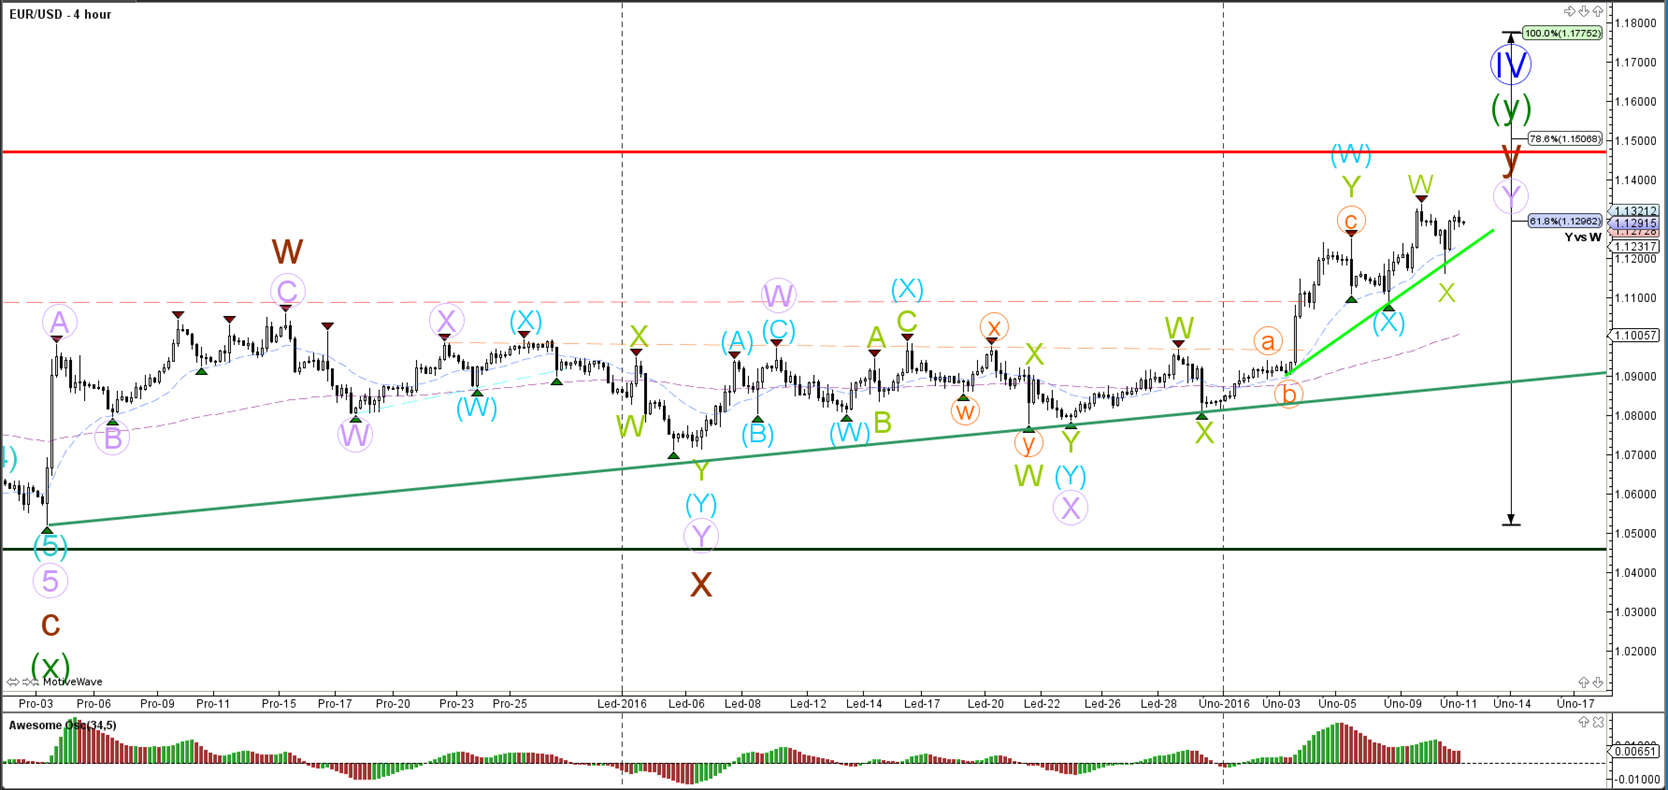
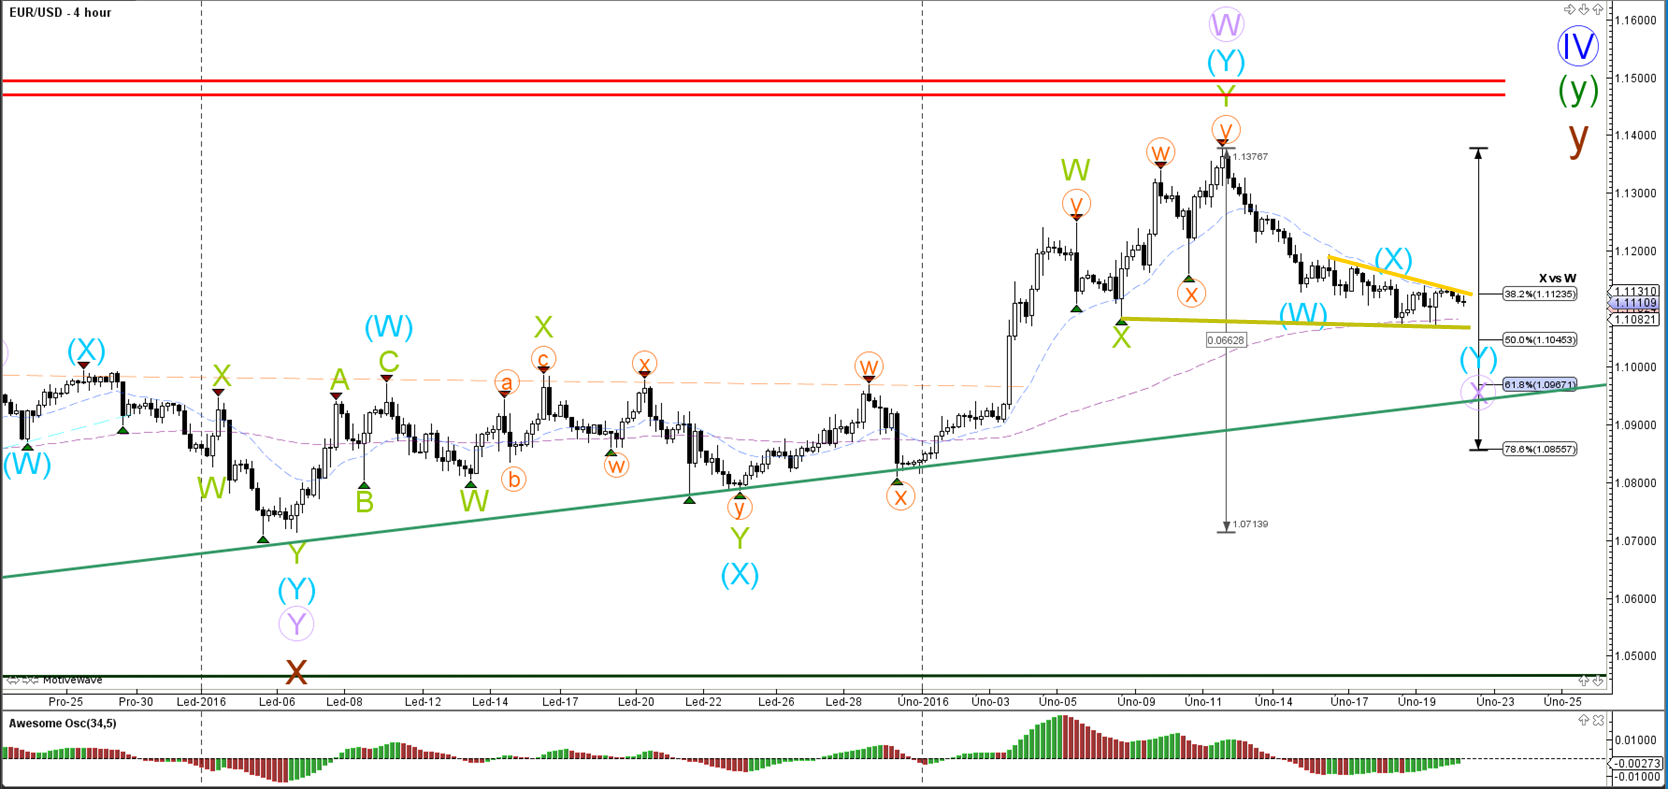
EUR/USD
4 hour

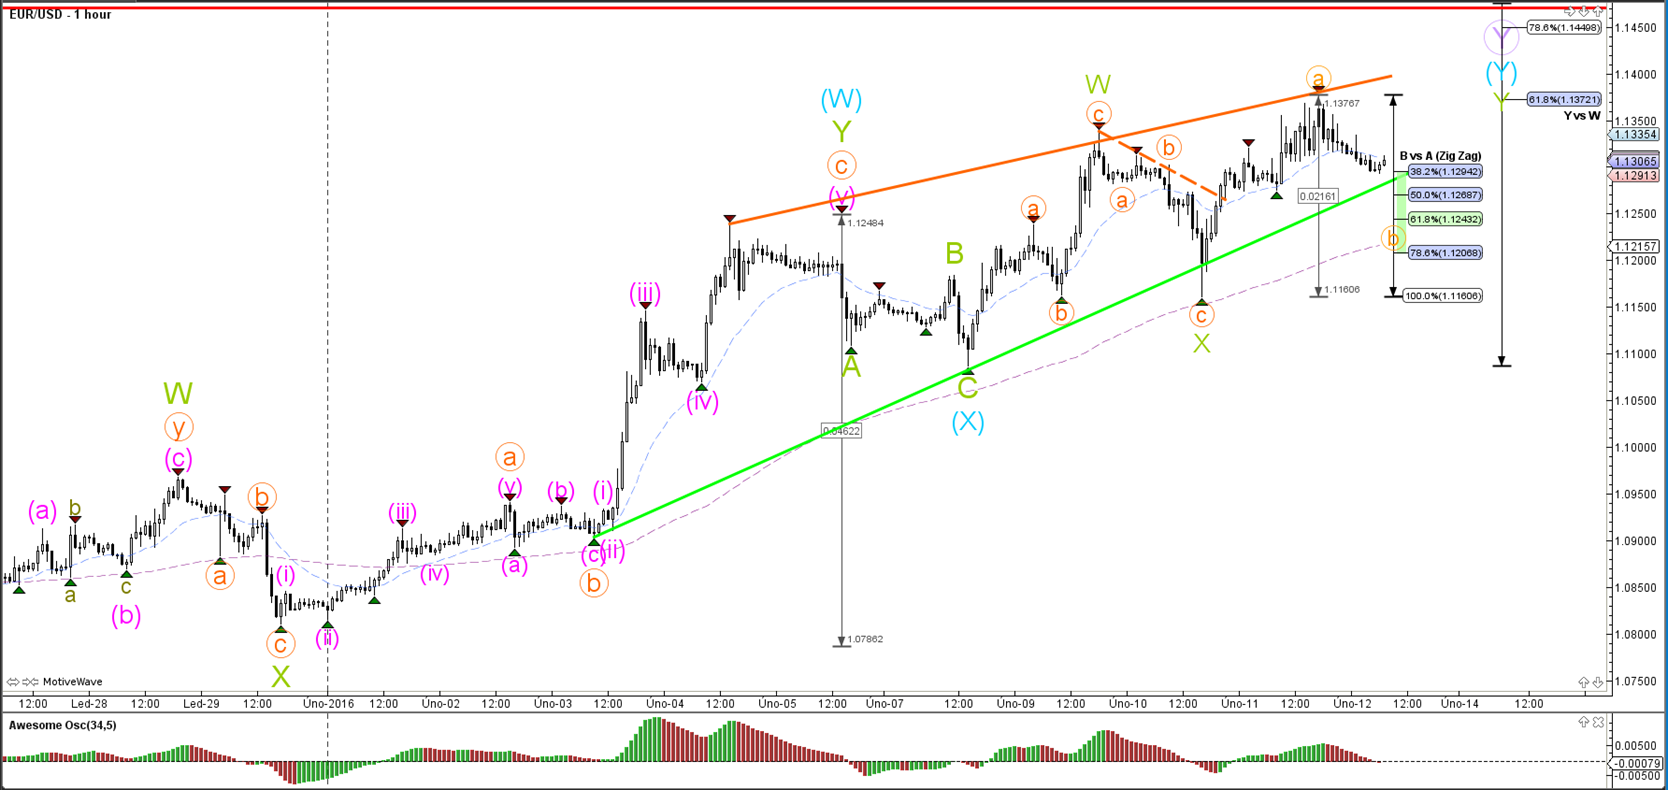
The EUR/USD showed strong bullish momentum yesterday as price broke above the resistance levels (dotted lines). The wave count of the previous days indicated the likelihood of a bullish ABC zigzag (green). The break through the red dotted trend line also confirms that the wave C (brown) of wave X (green) was a correct wave count and invalidates the wave 3 (grey), which will be removed in future analysis.
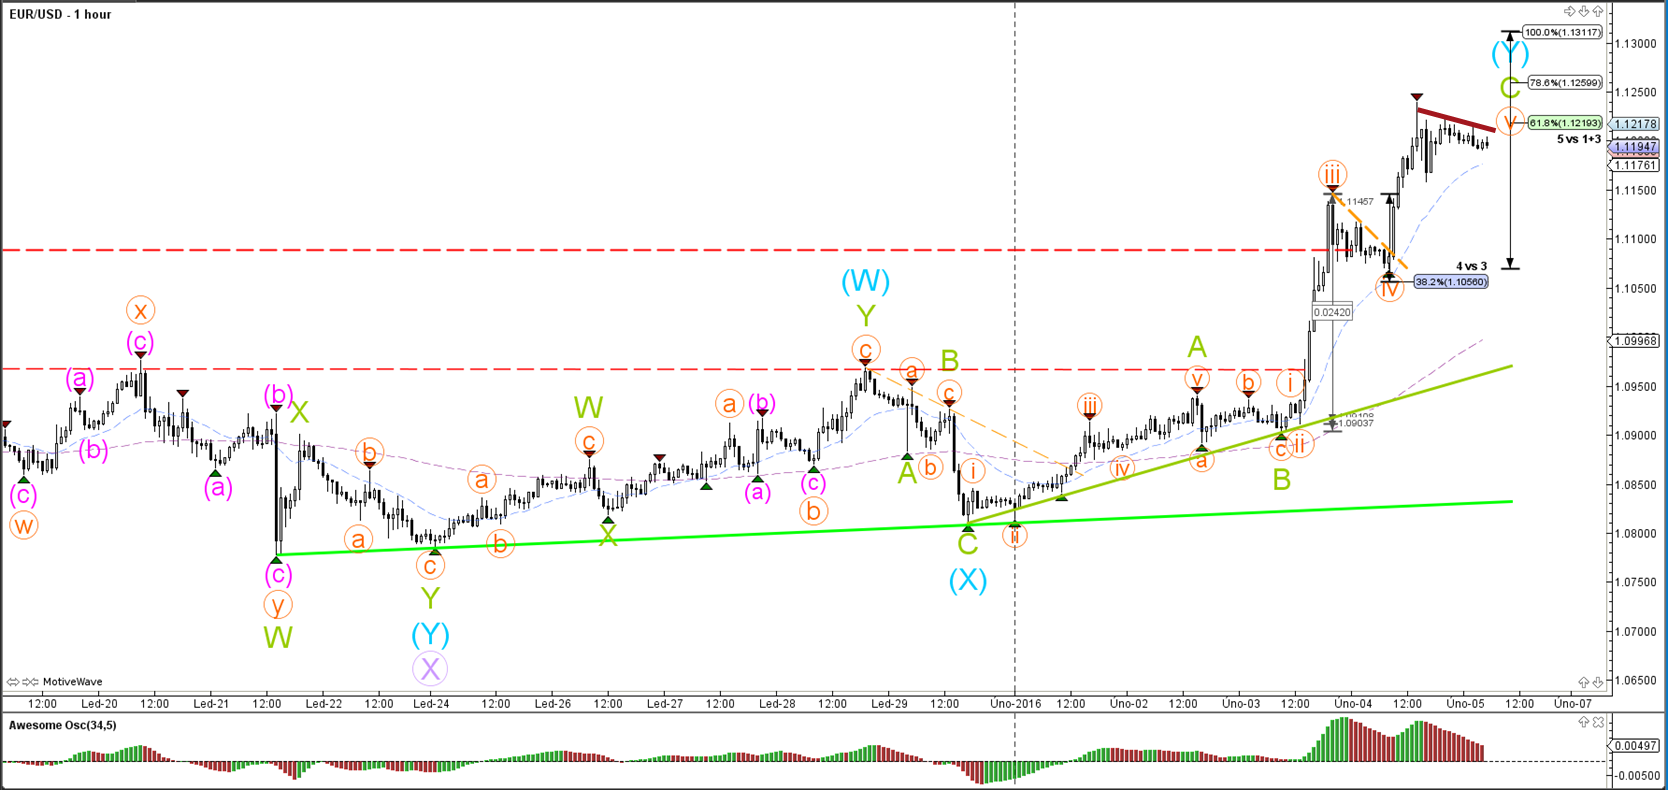
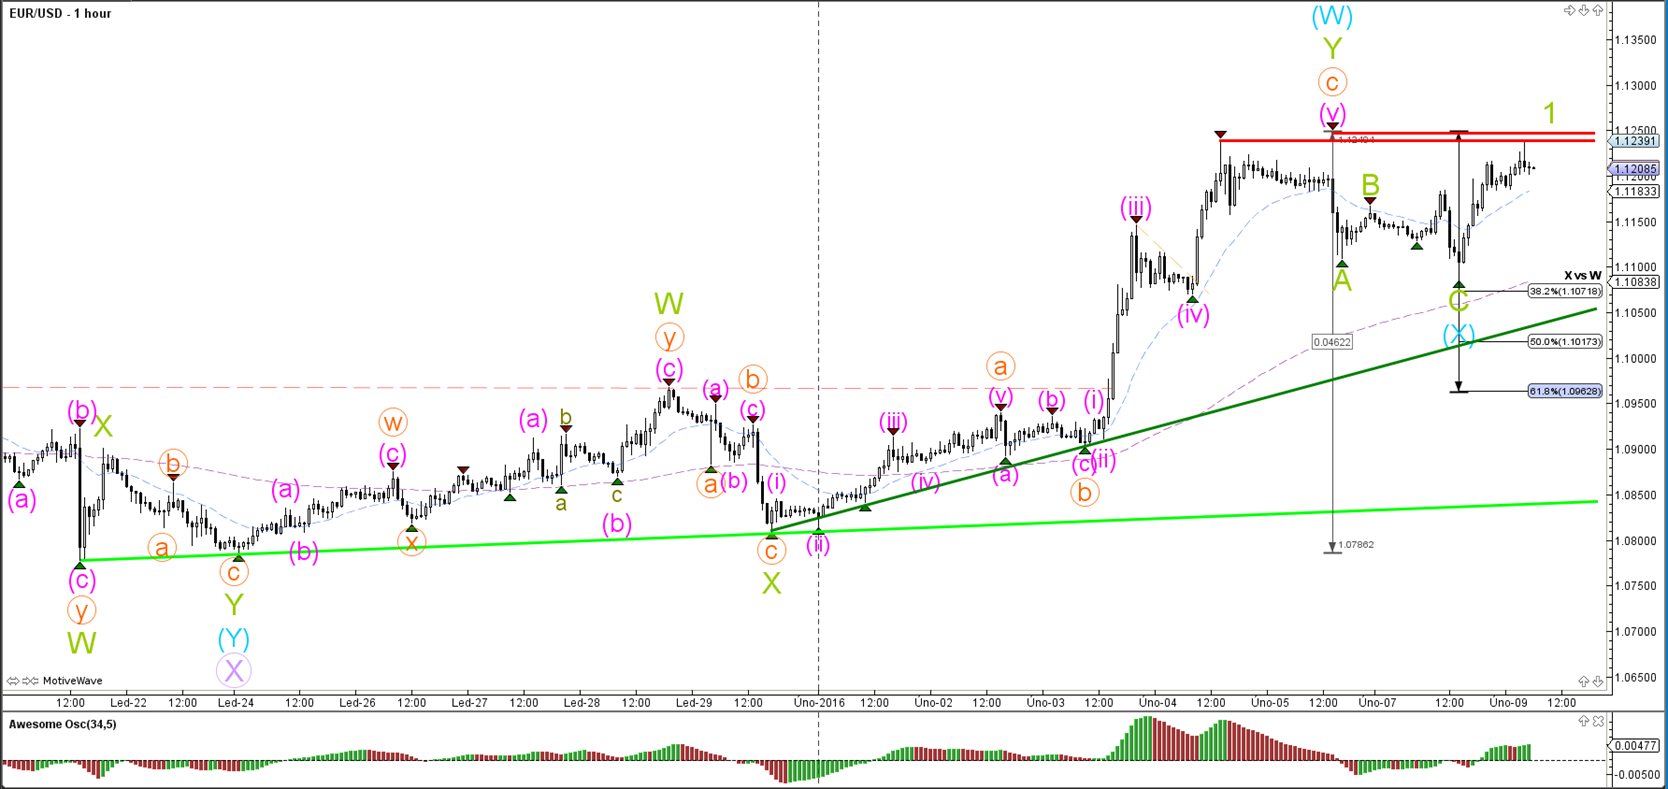
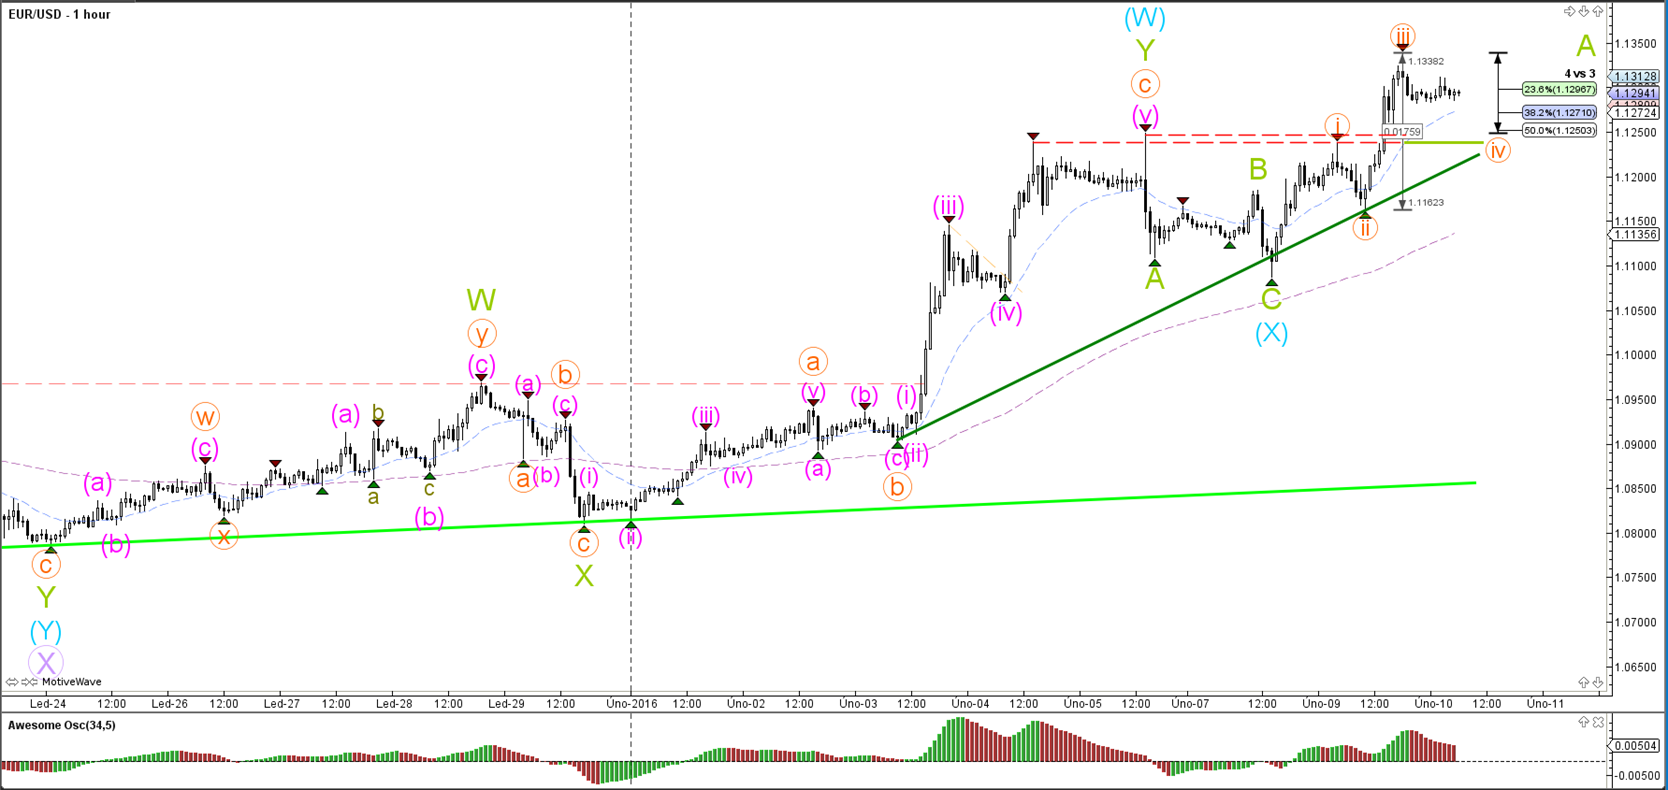
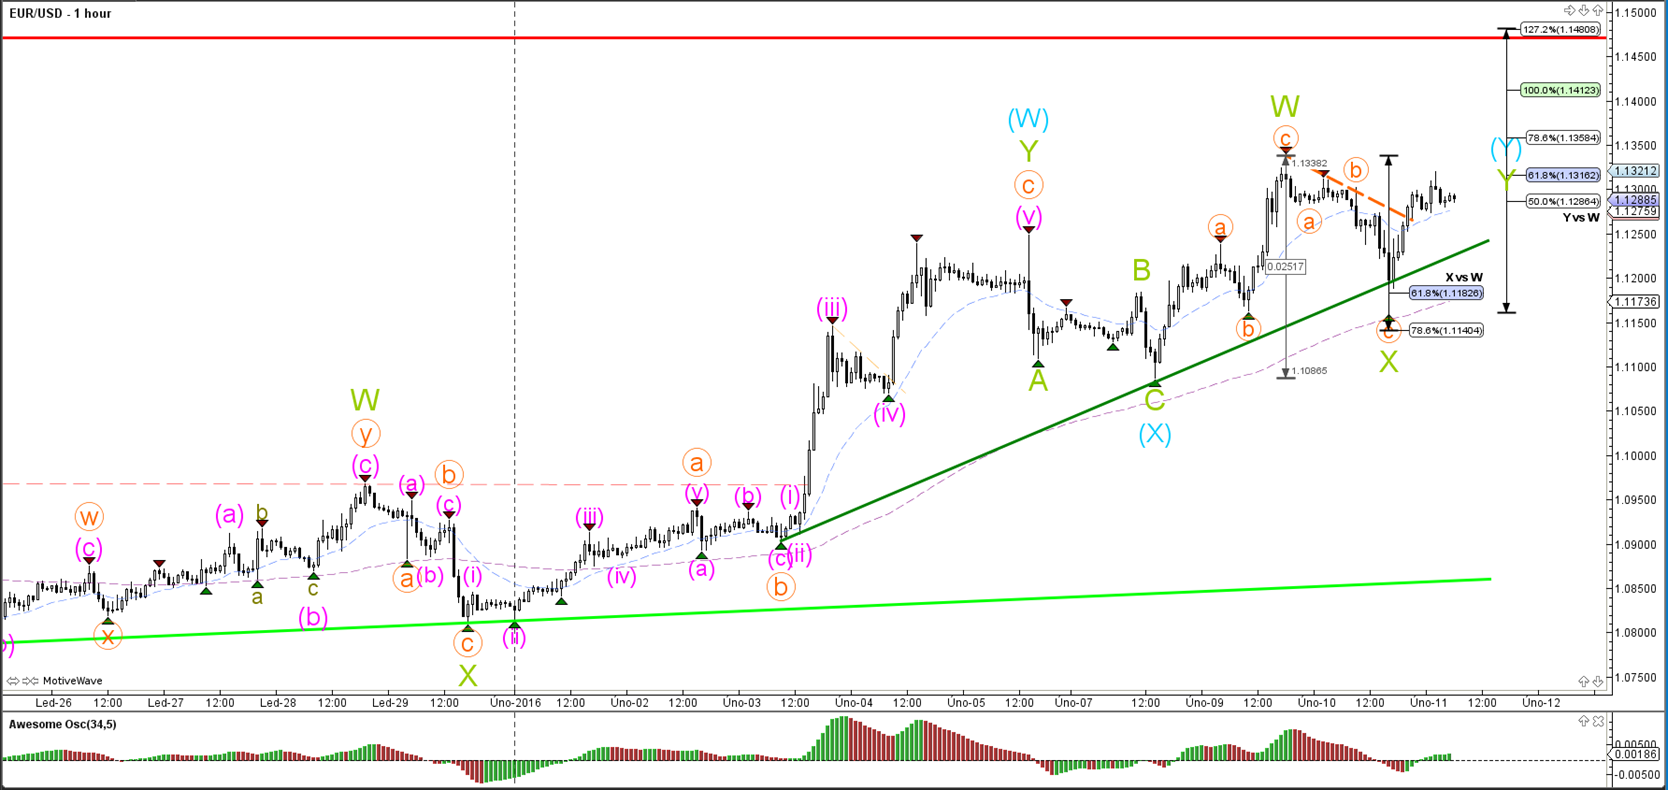
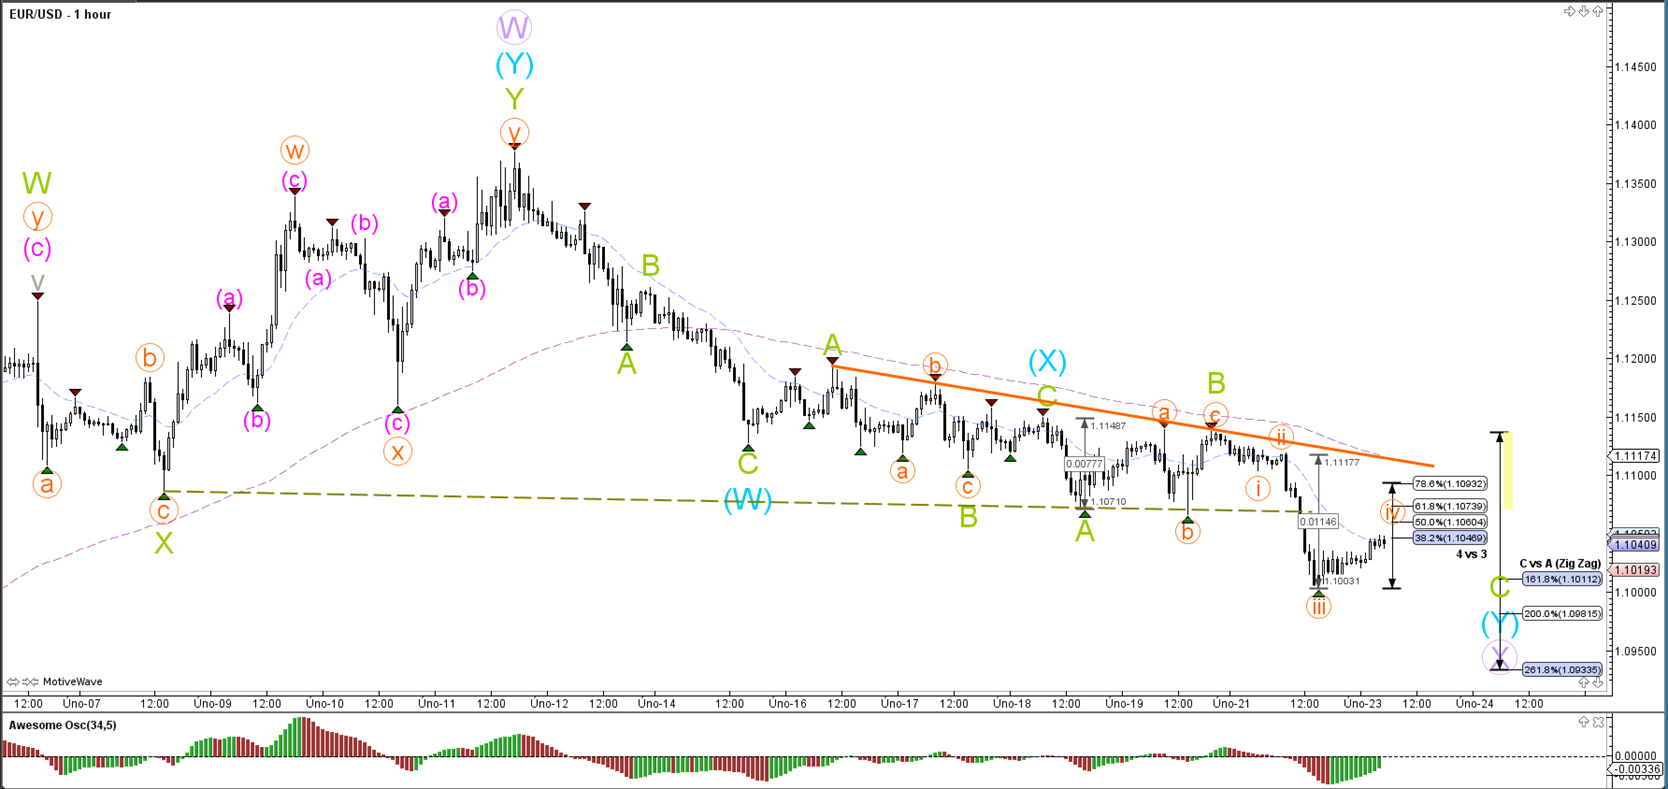
1 hour

The EUR/USD seems to have completed an impulsive wave 3 (orange) and is now building a triangle as part of a wave 4. The wave 4 could make a retracement but typically will stop around the 38.2% Fibonacci level.
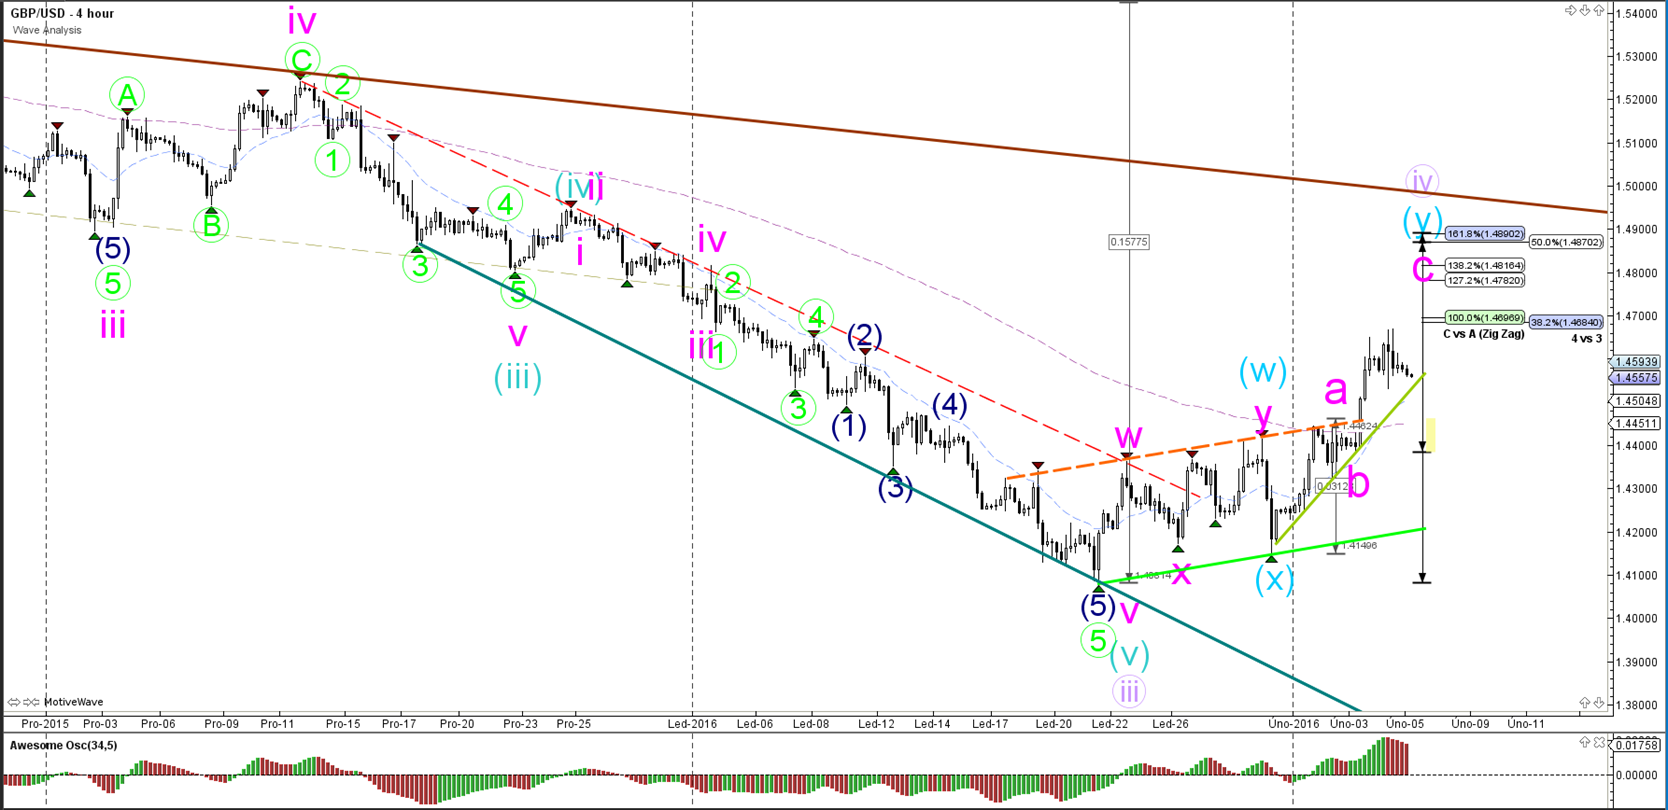
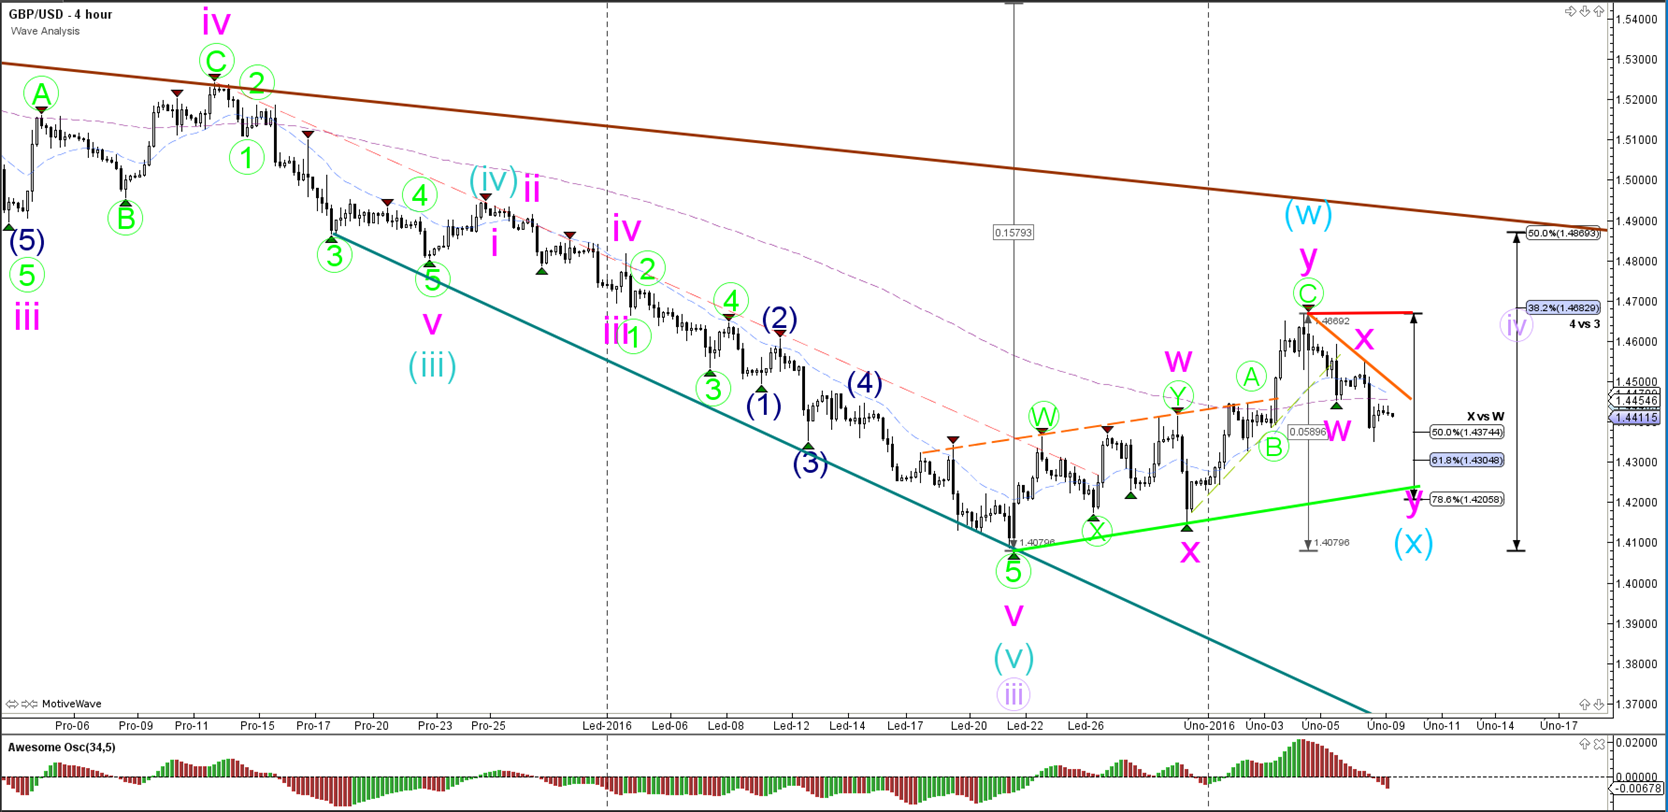
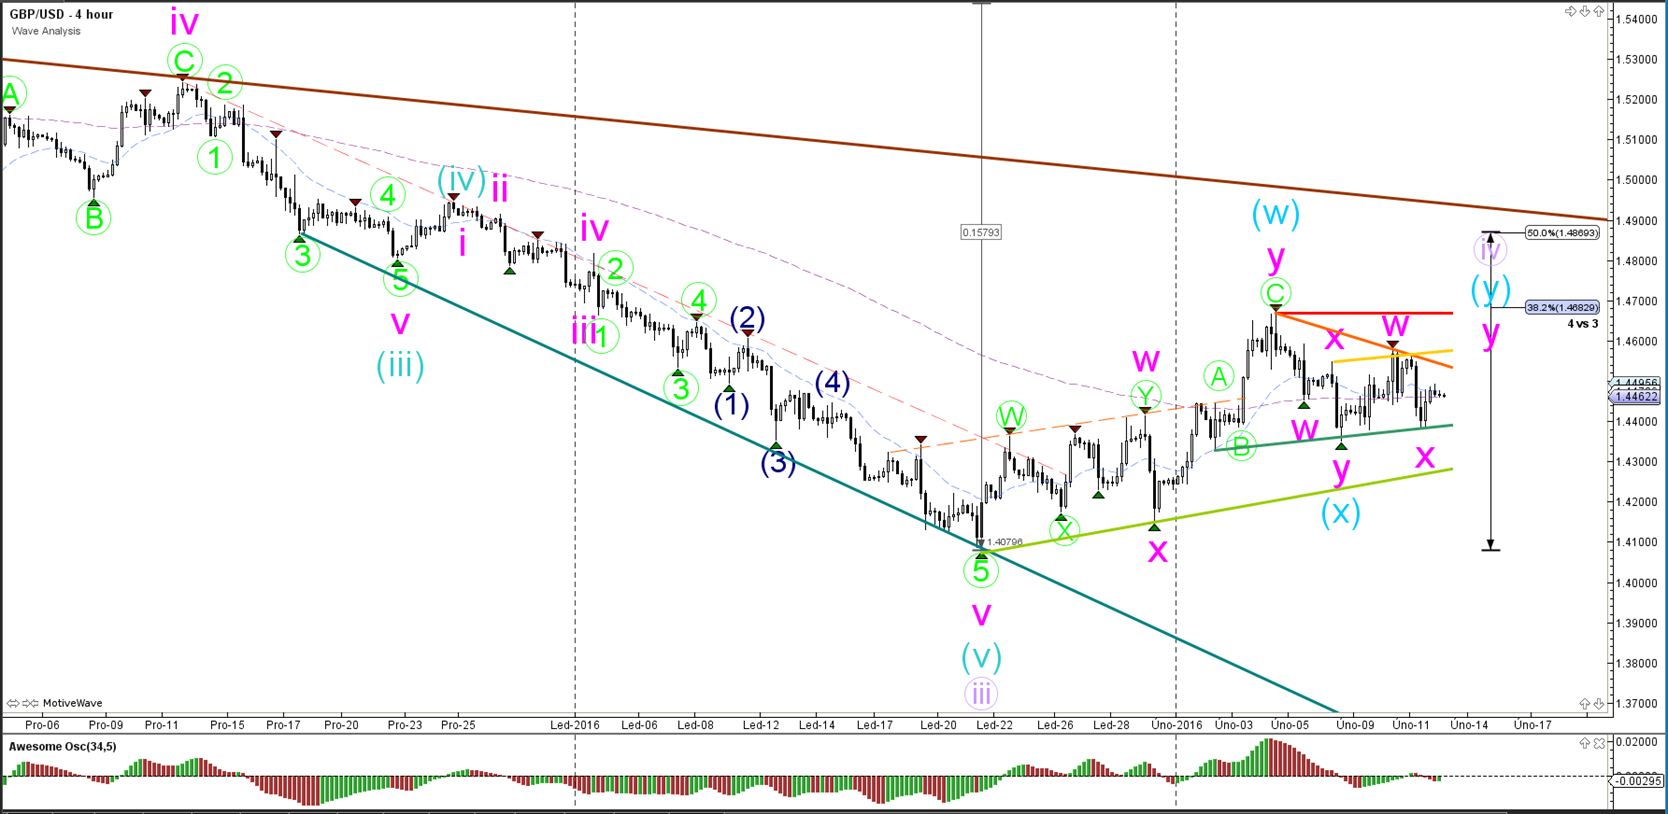
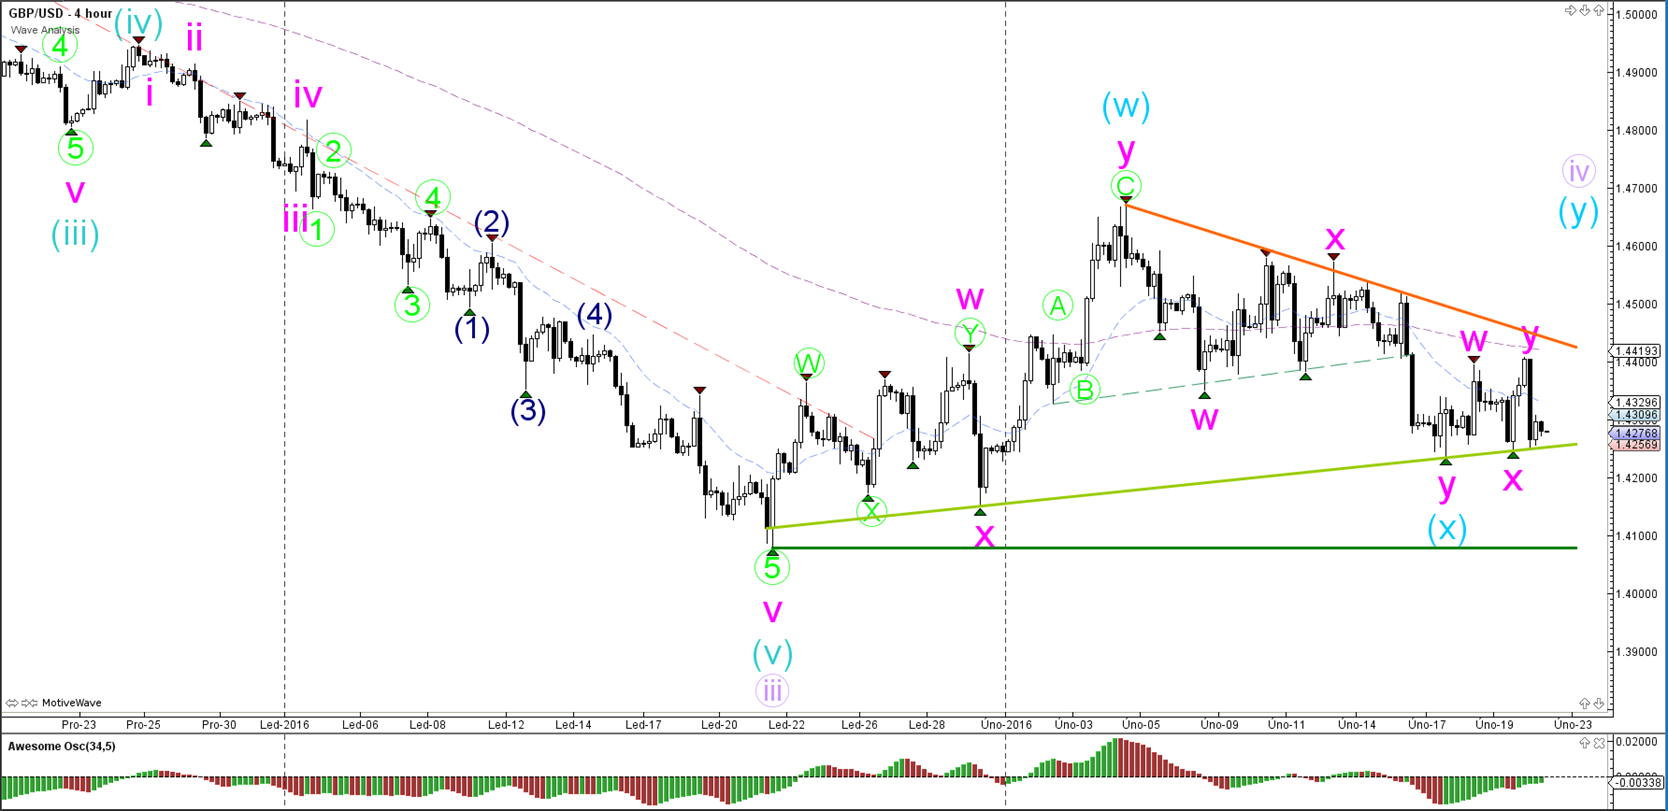
GBP/USD
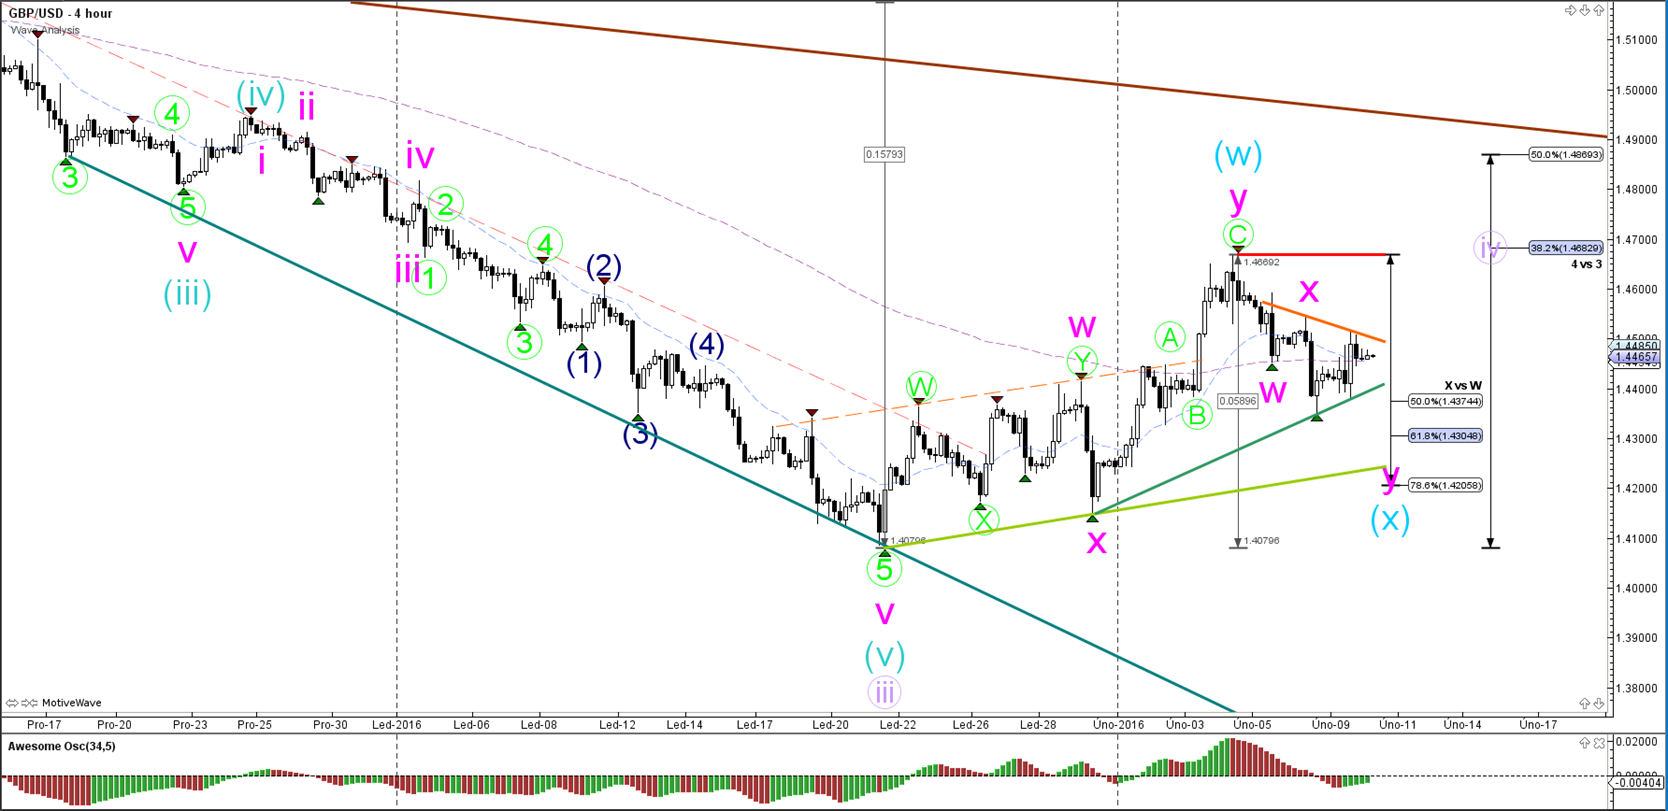
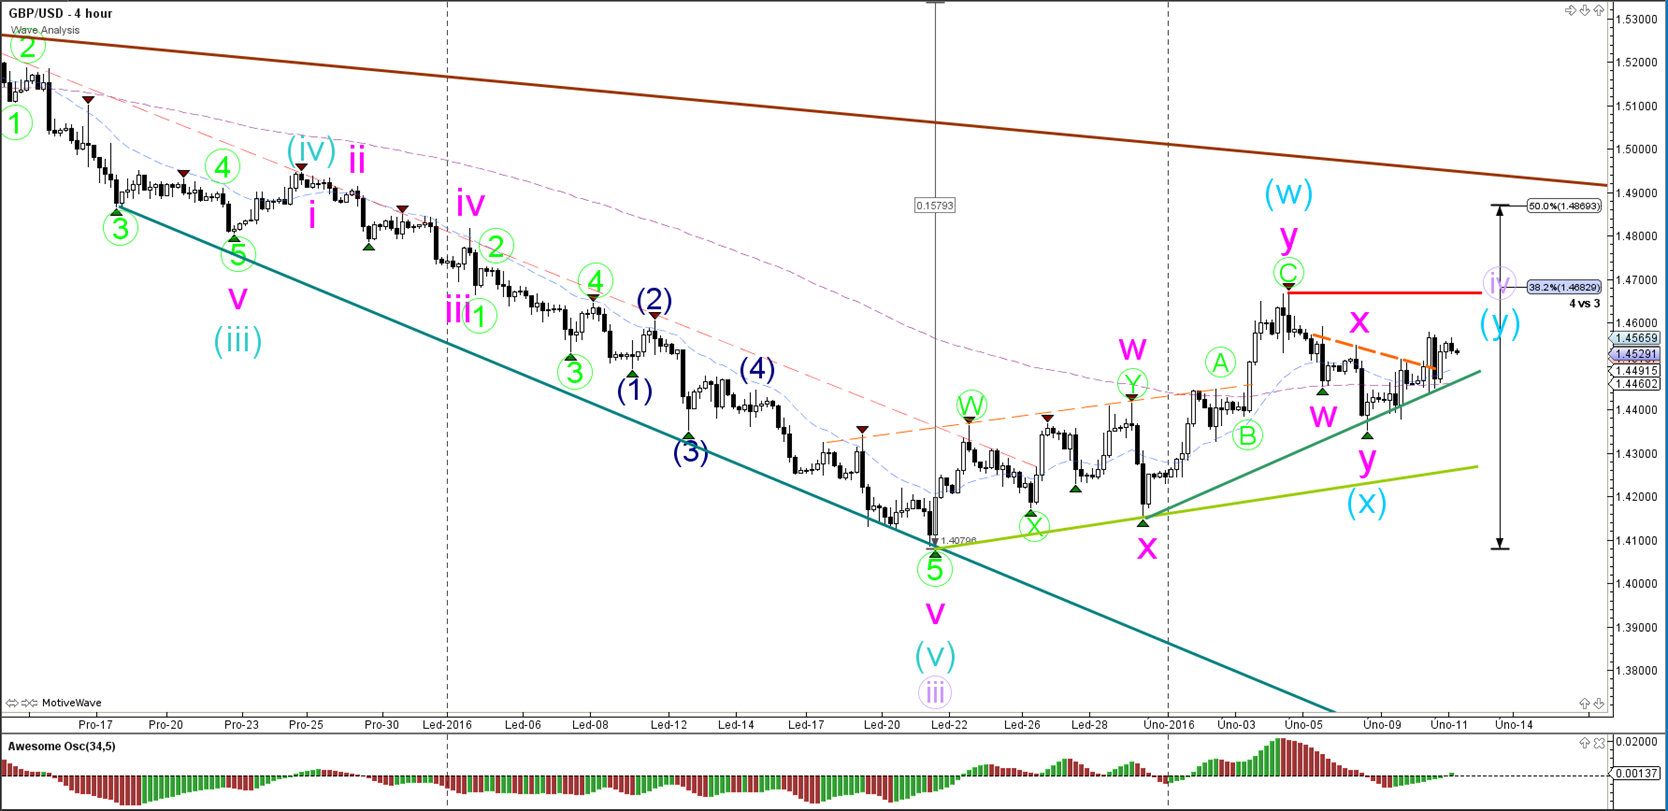
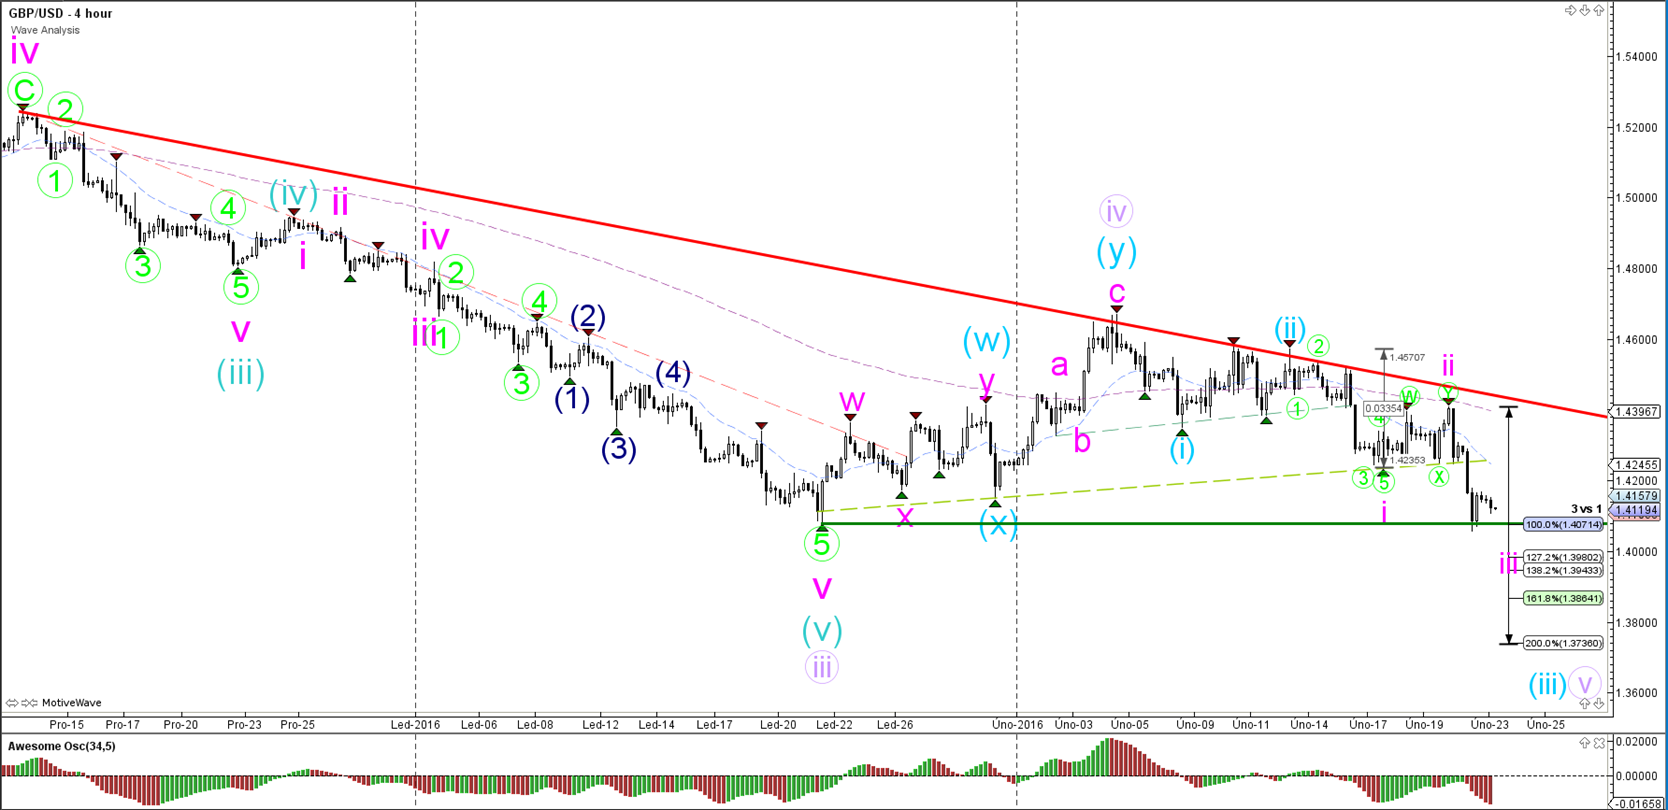
4 hour

The GBP/USD is also showing bullish momentum similar to that of the EUR/USD. Also in this case an expected ABC zigzag (pink) unfolded to enlarge the correction of the wave 4 (purple). Price (almost) hit the 38.2% Fibonacci level of wave 4, which could be a bearish bouncing spot. The maximum retracement I would expect for a wave 4 is the 50% Fib.
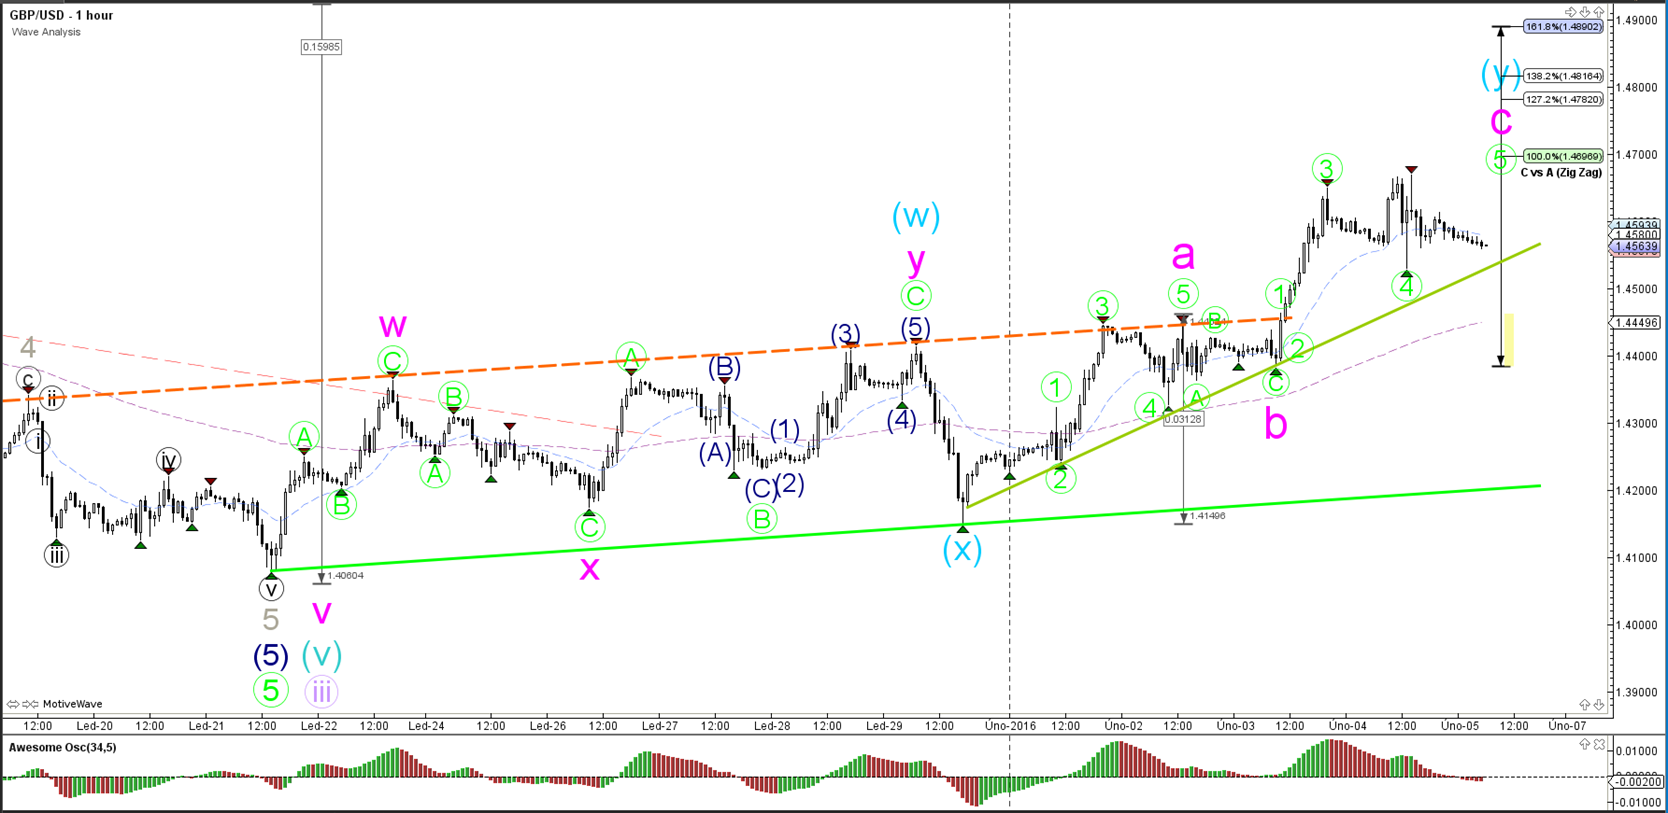
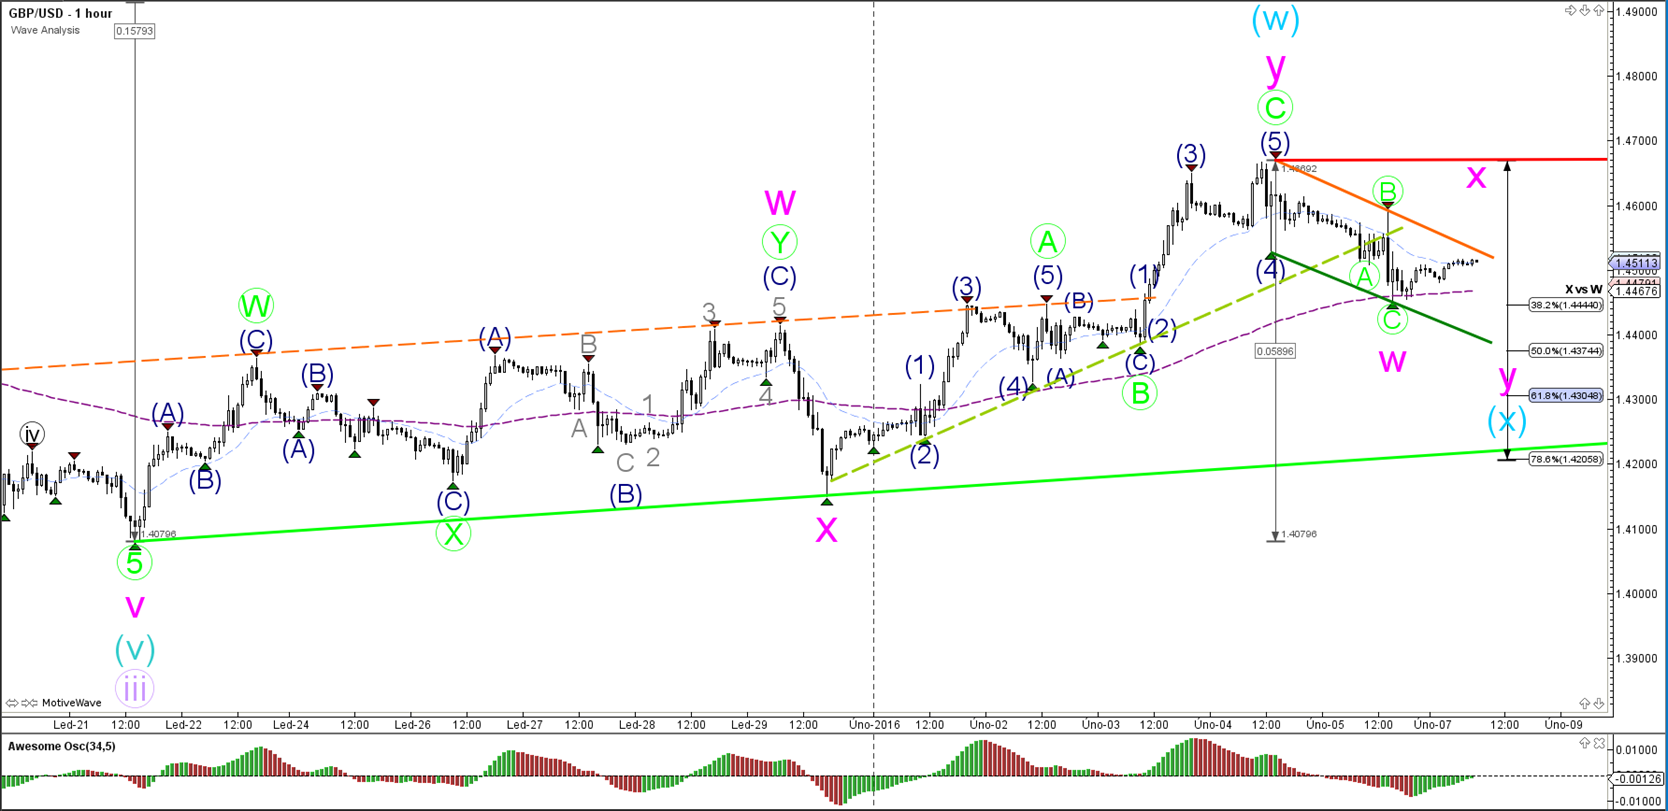
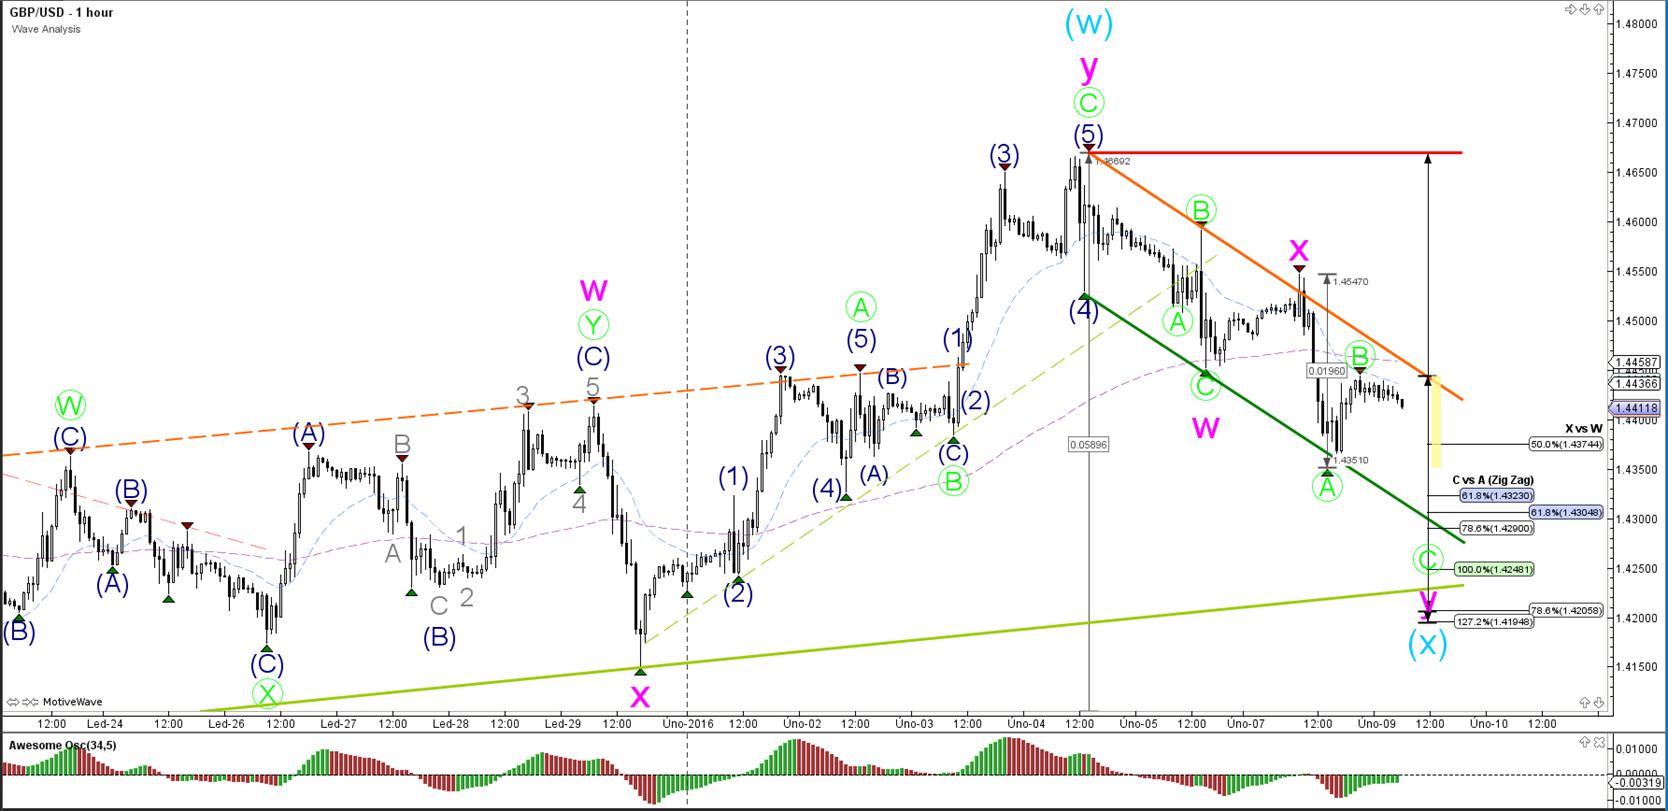
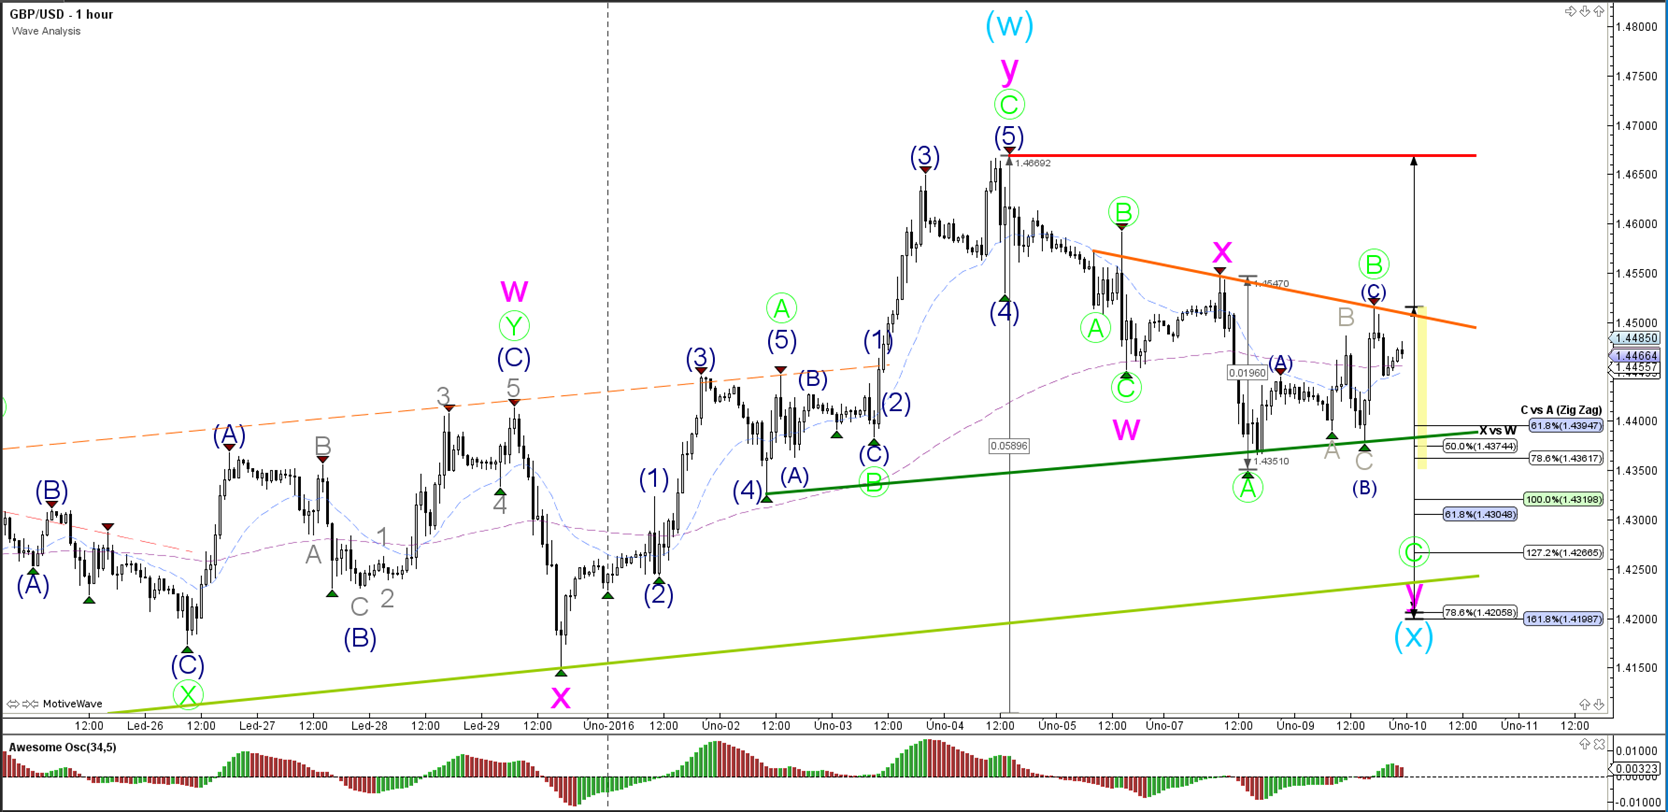
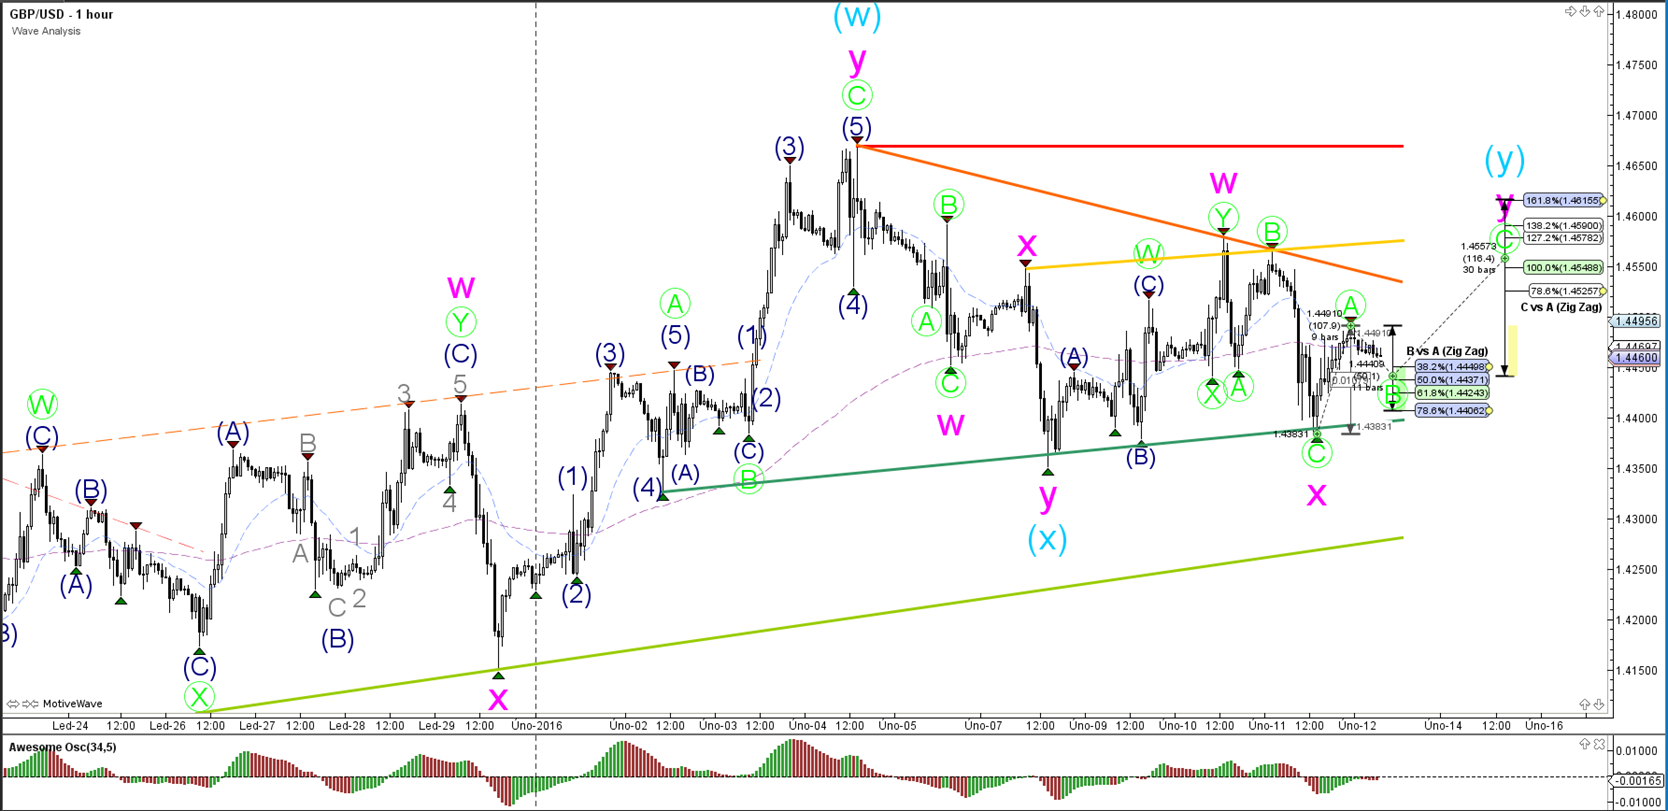
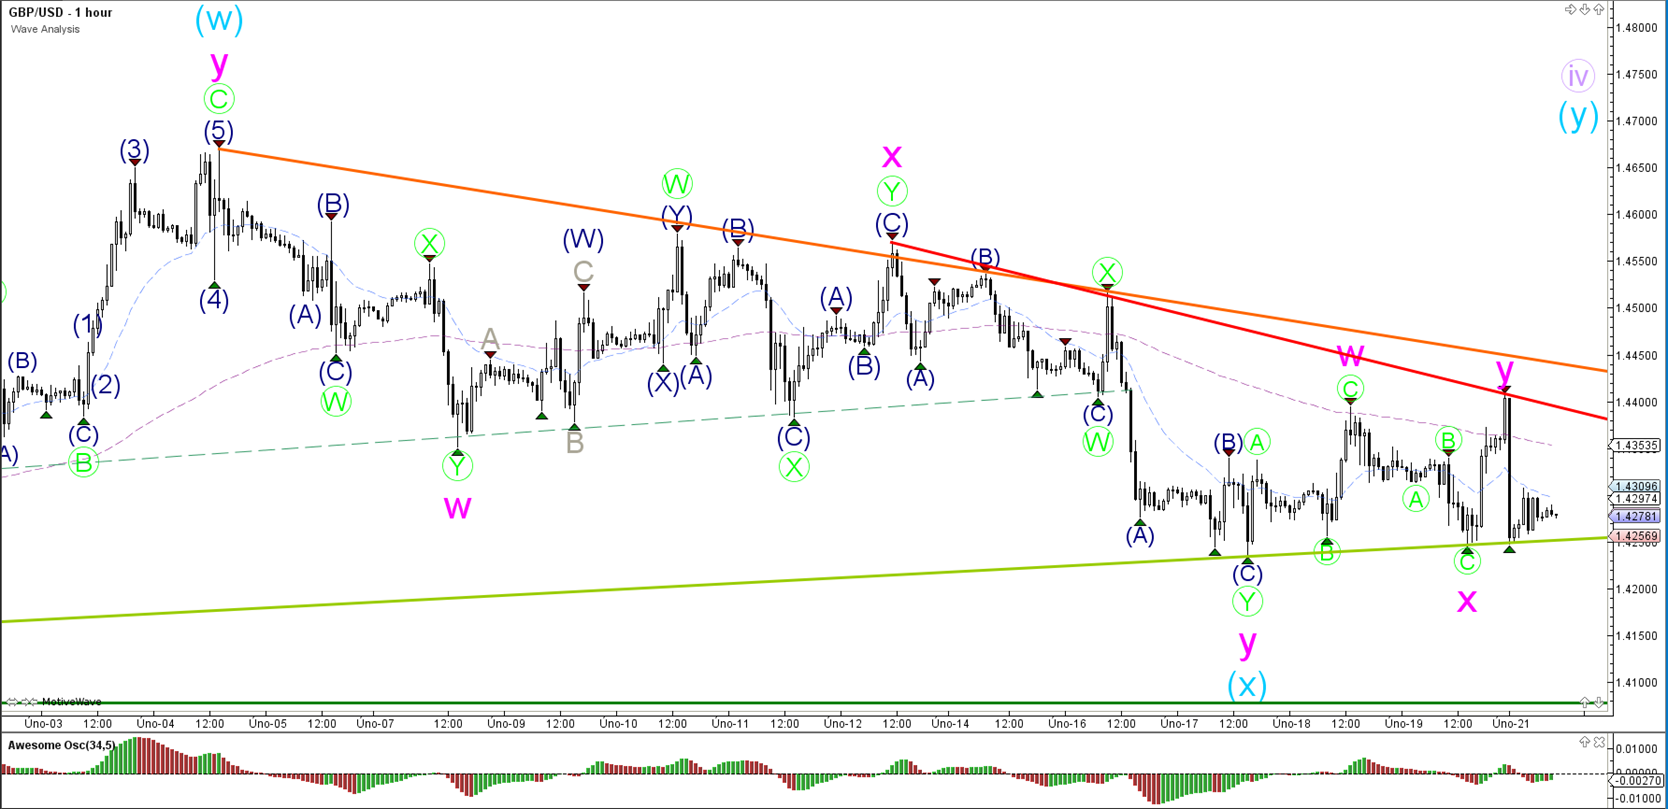
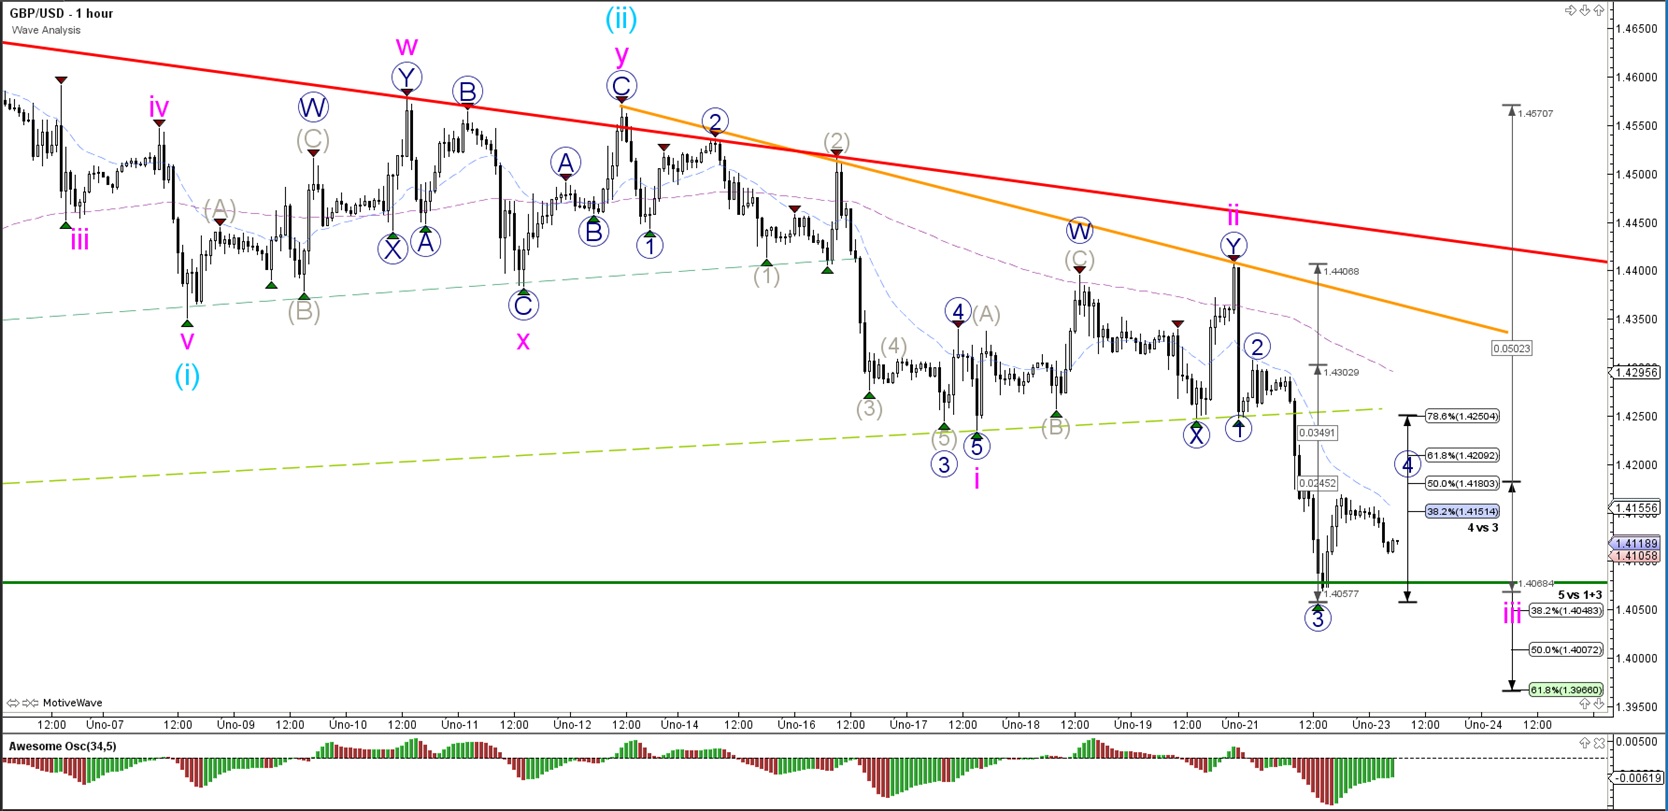
1 hour

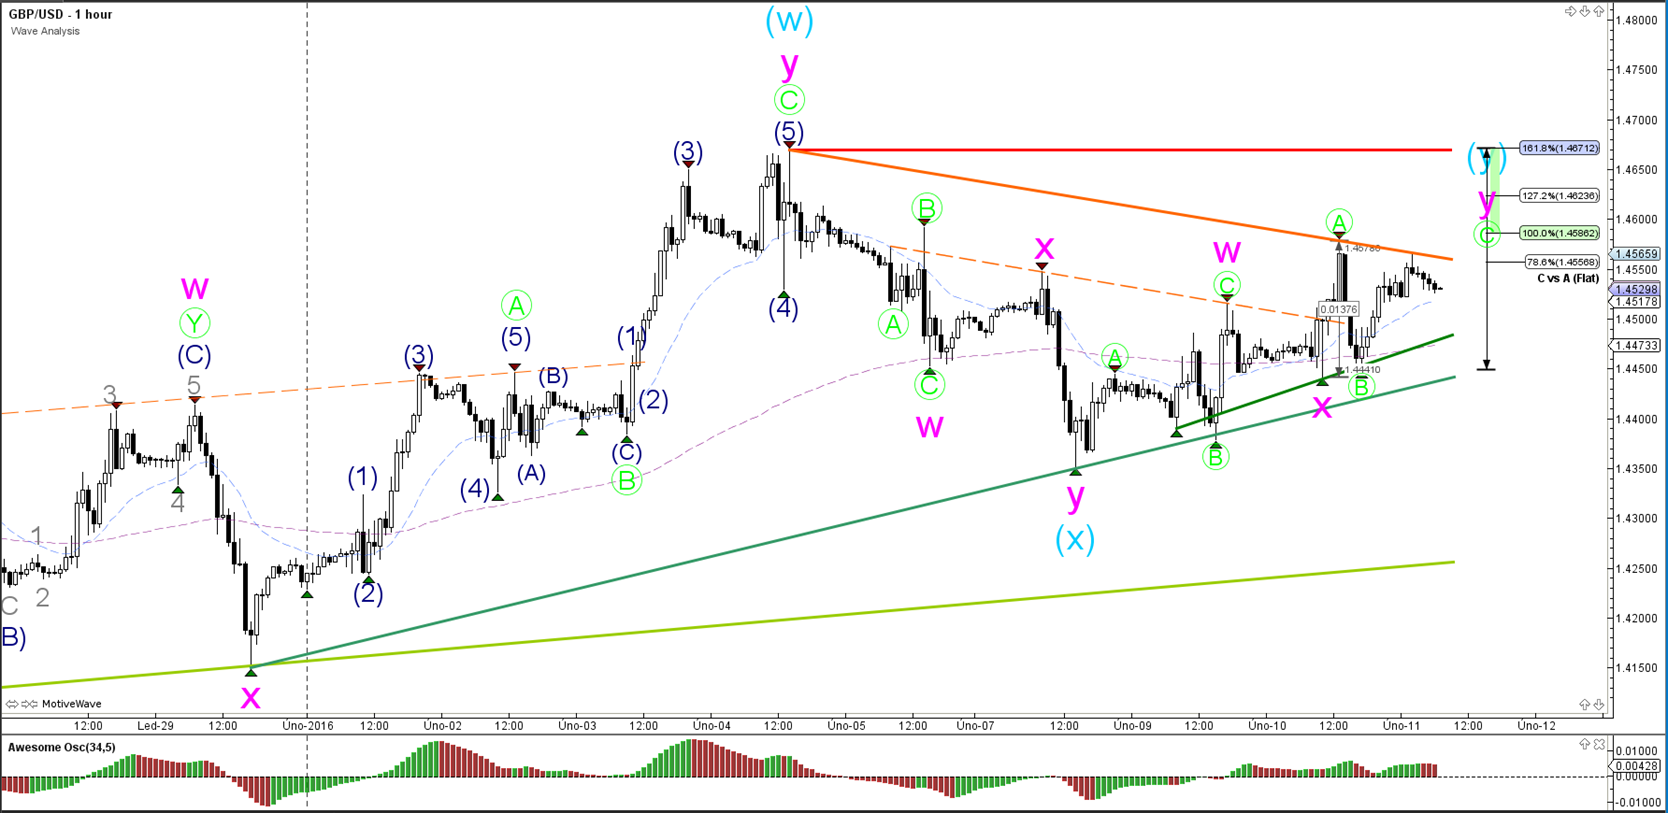
The GBP/USD 1 hour is unclear at the moment whether wave C (pink) is completed or will still push higher. There could be one more bullish push remaining similar to the 5 wave (orange) on the EUR/USD. The alternative is an ABC (blue) correction.
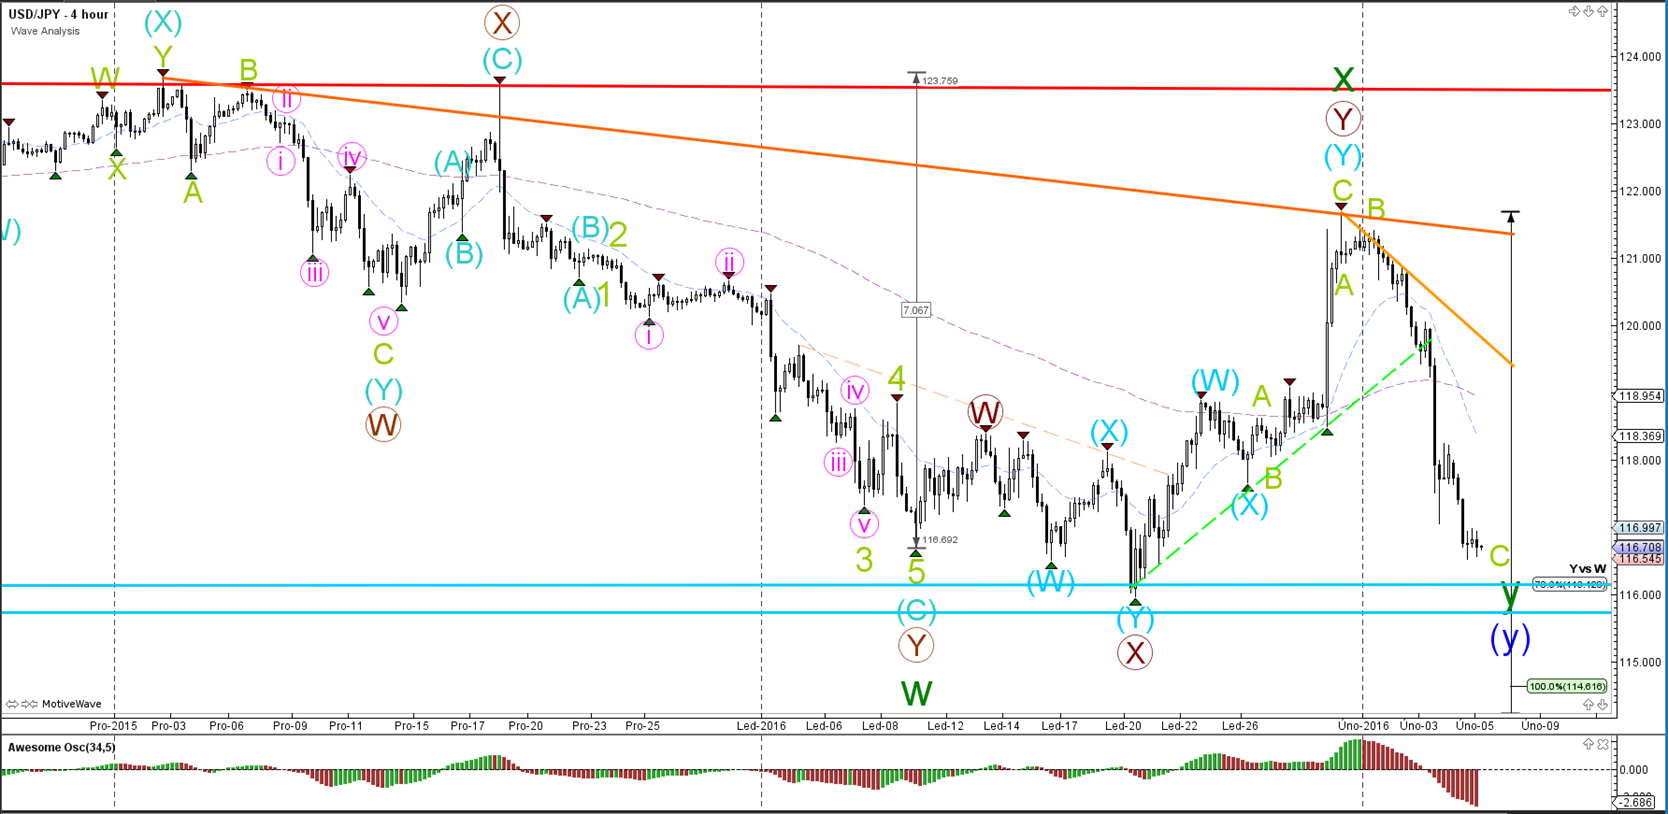
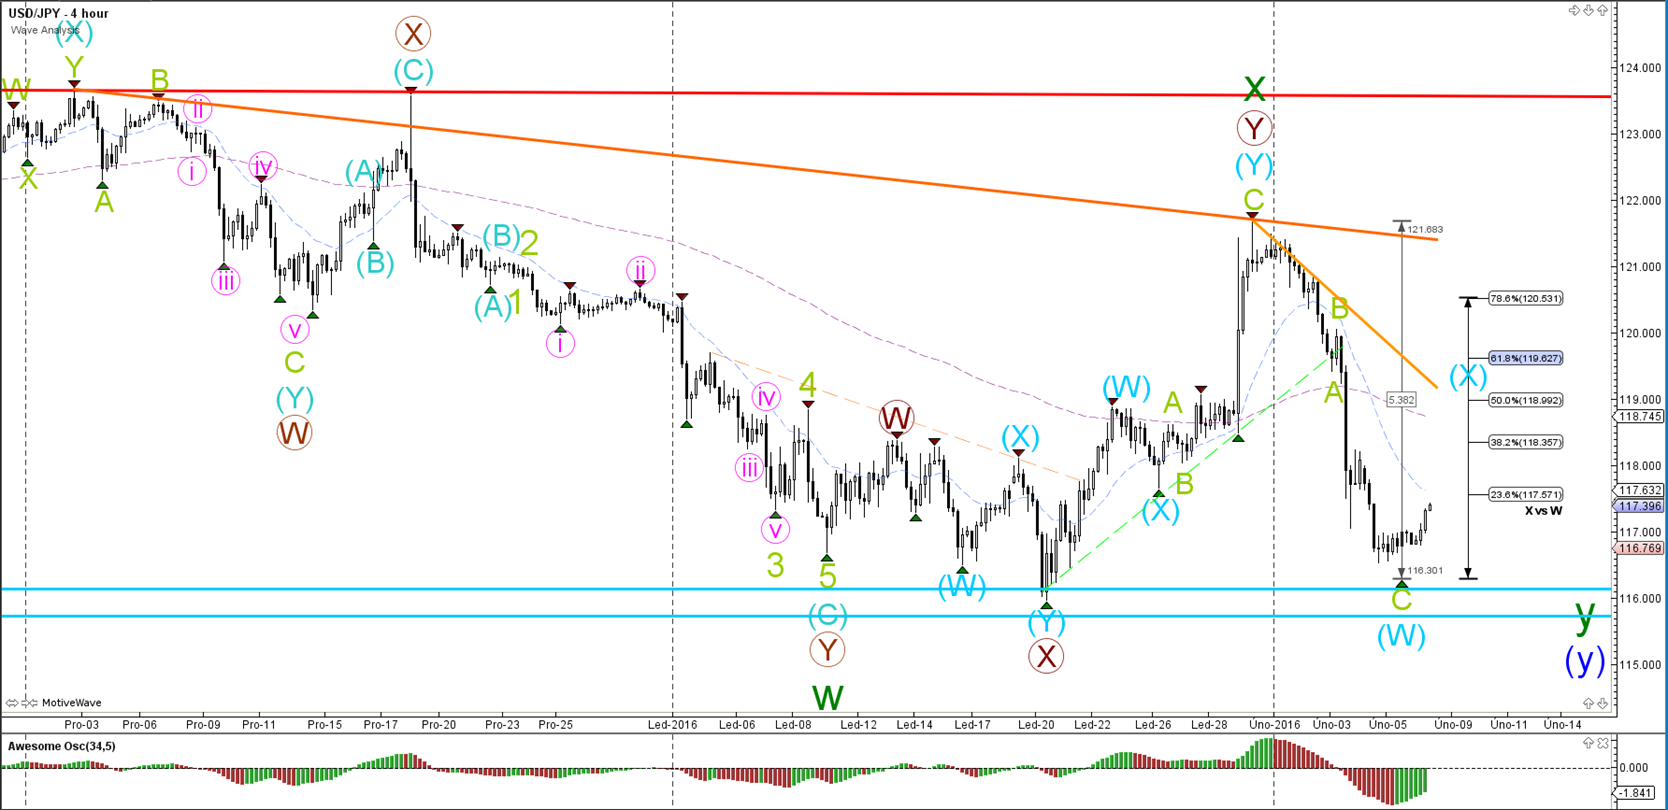
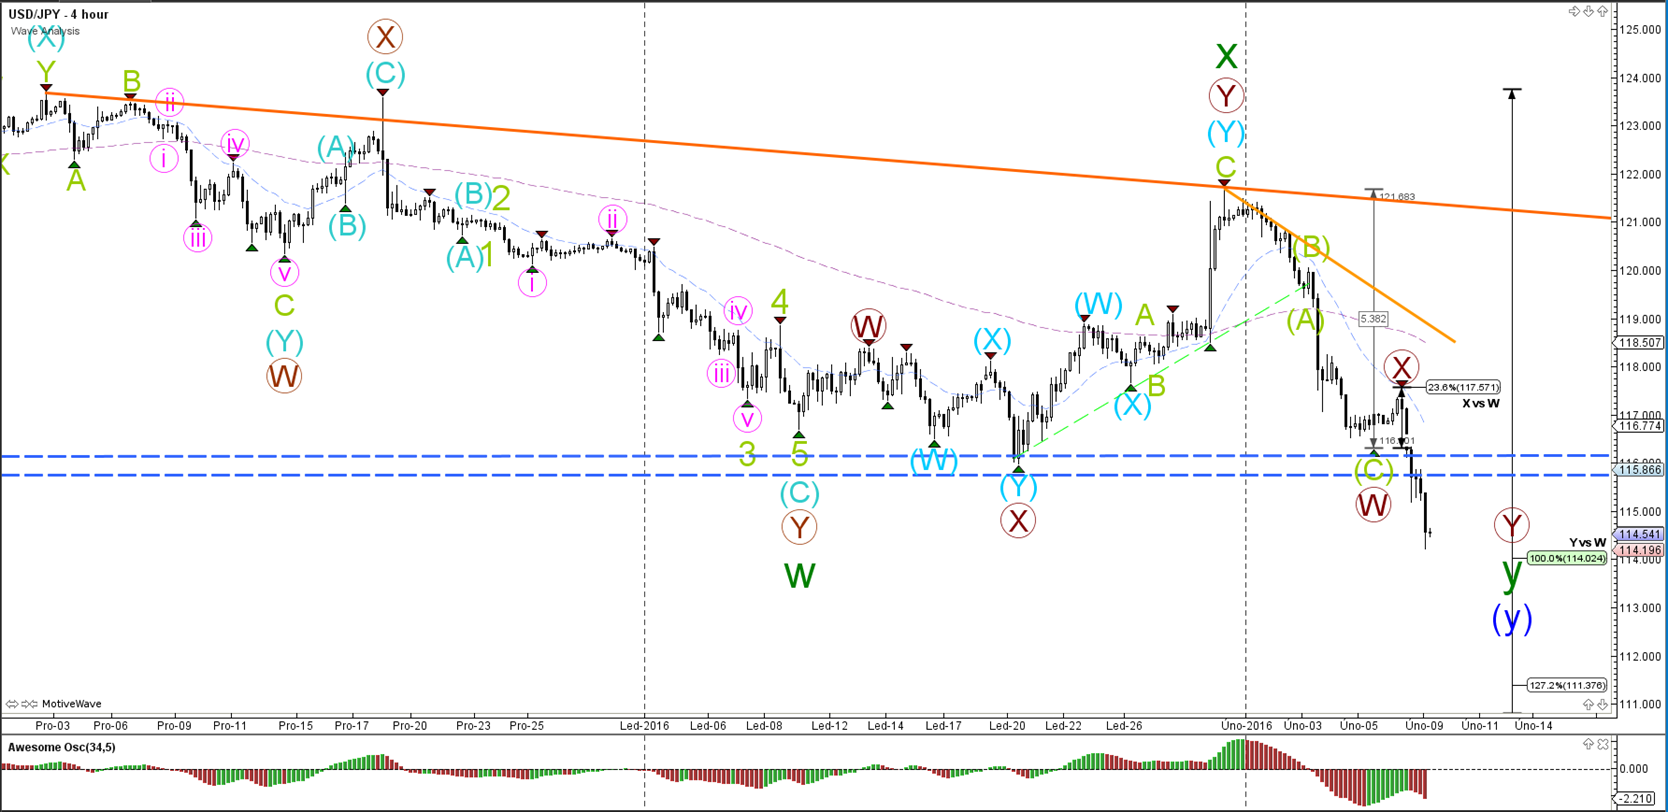
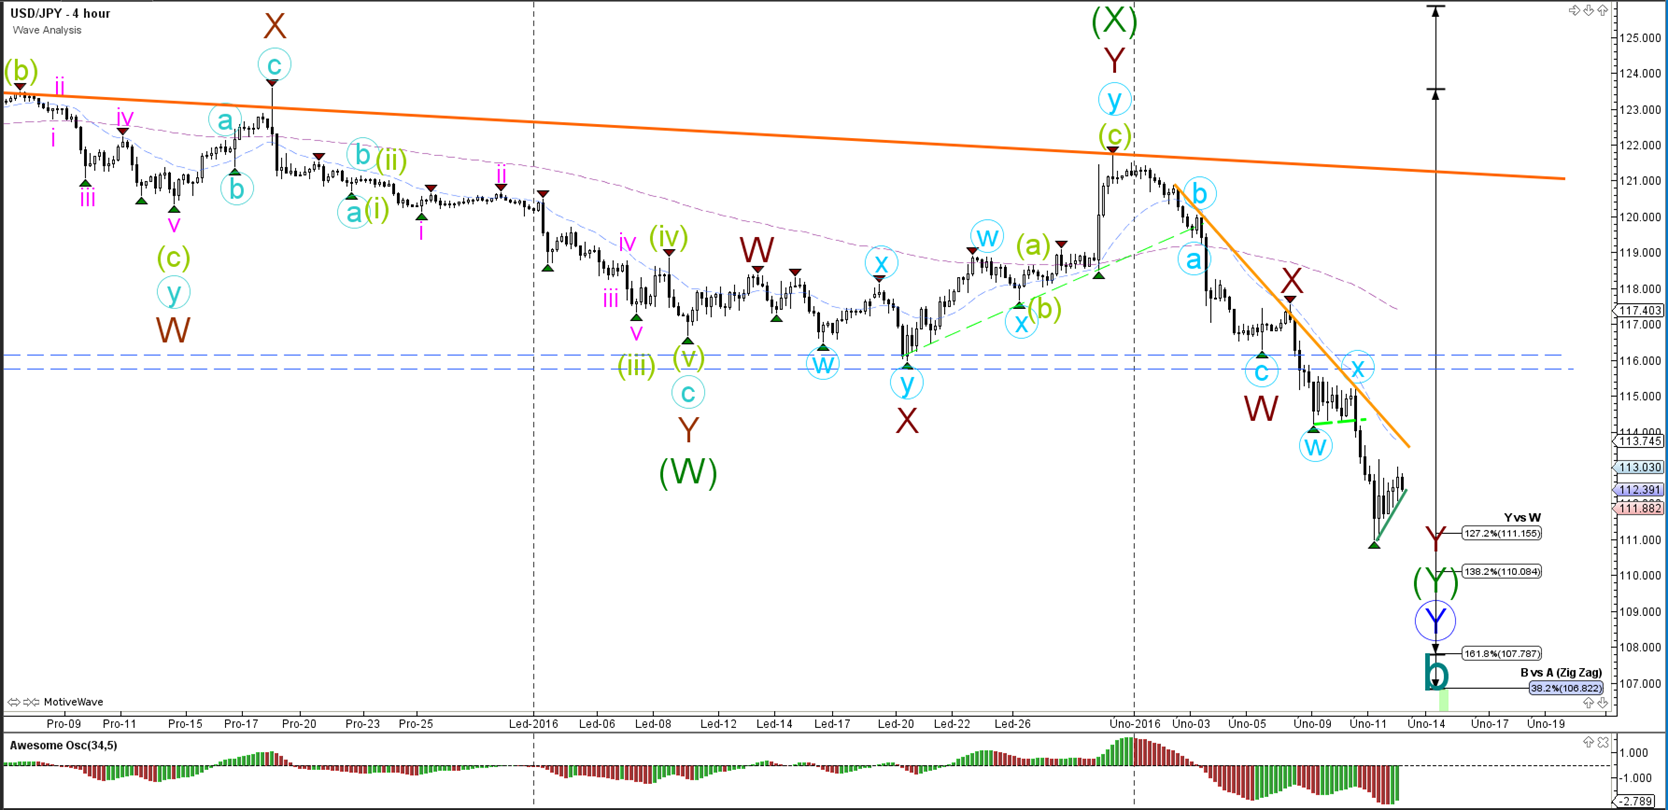
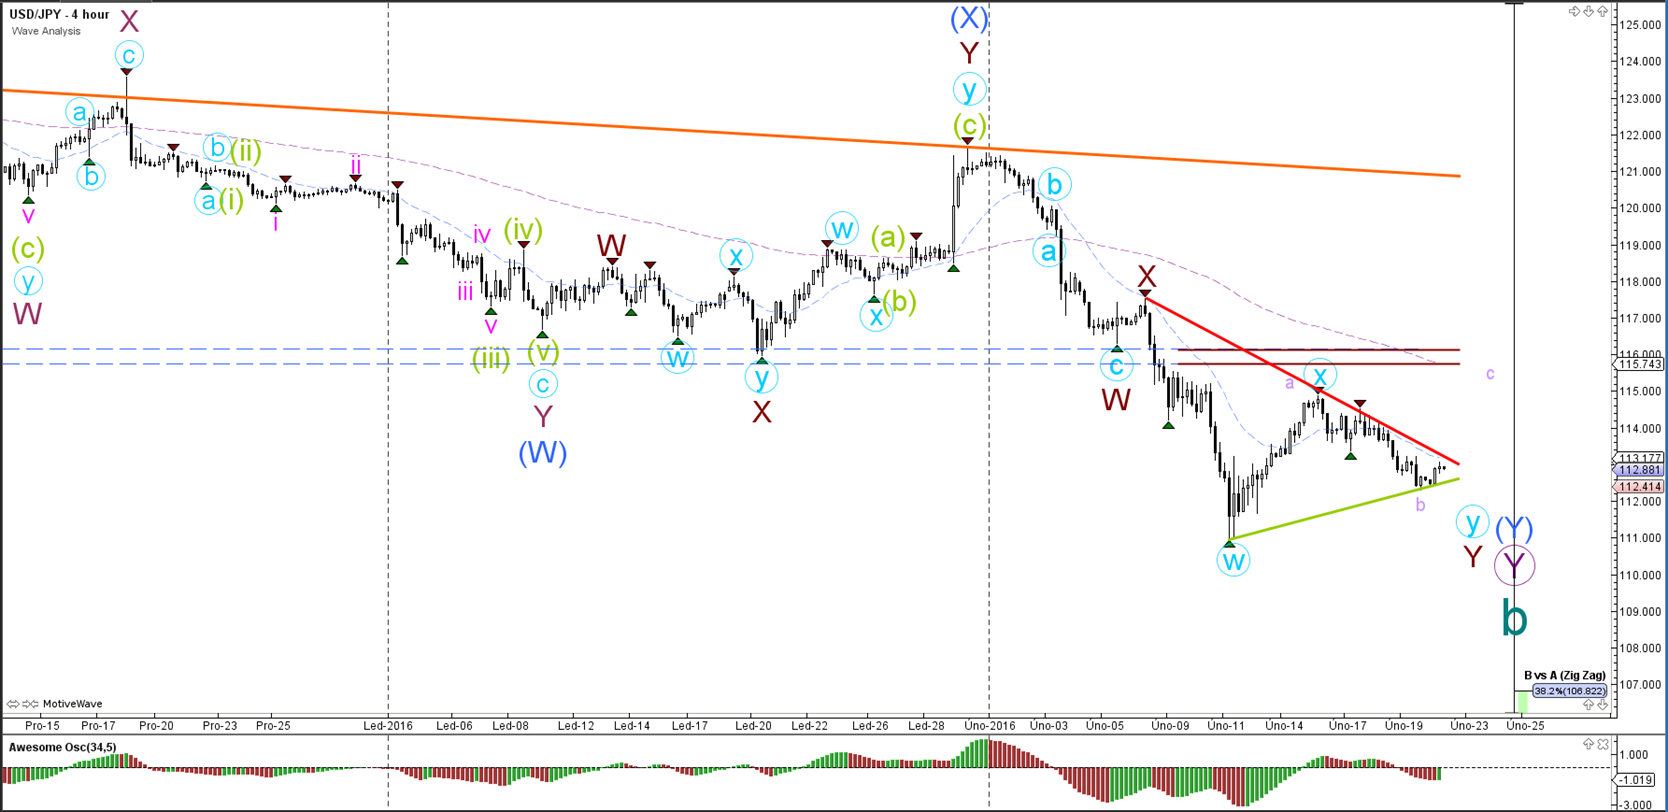
USD/JPY
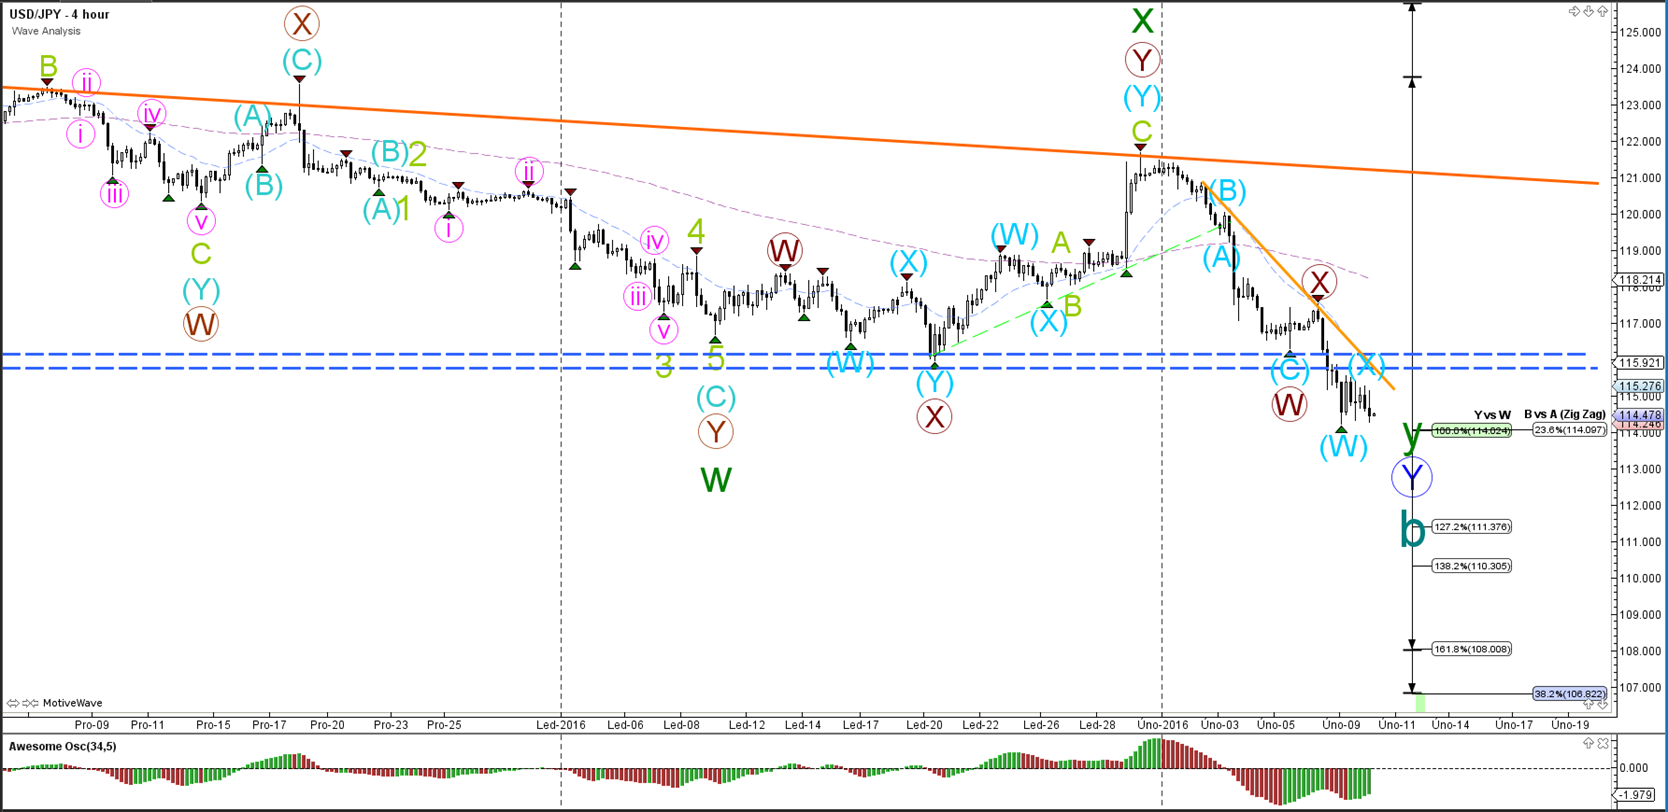
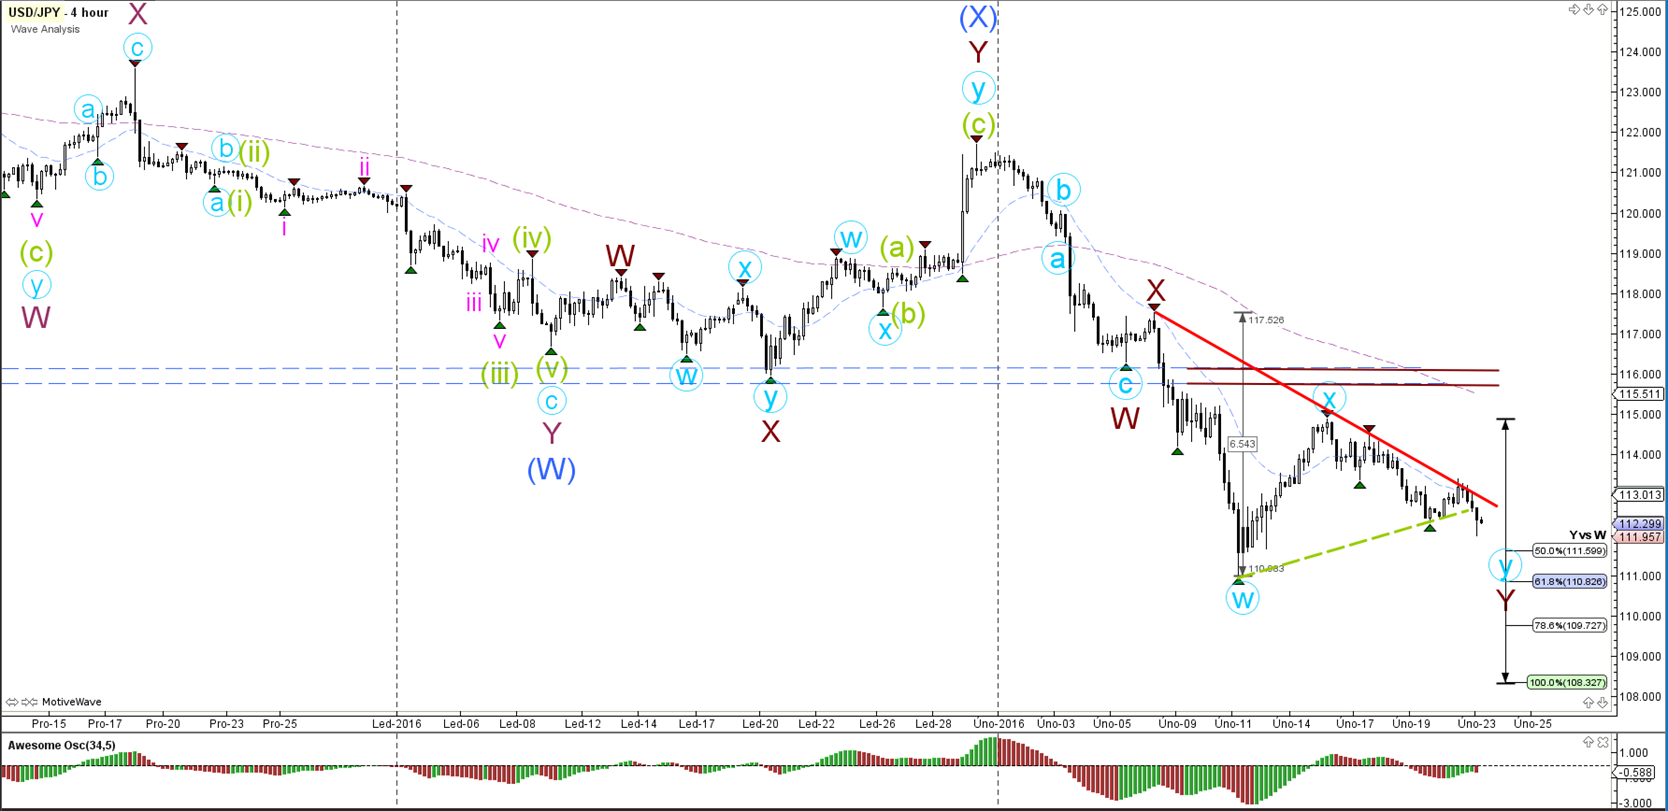
4 hour

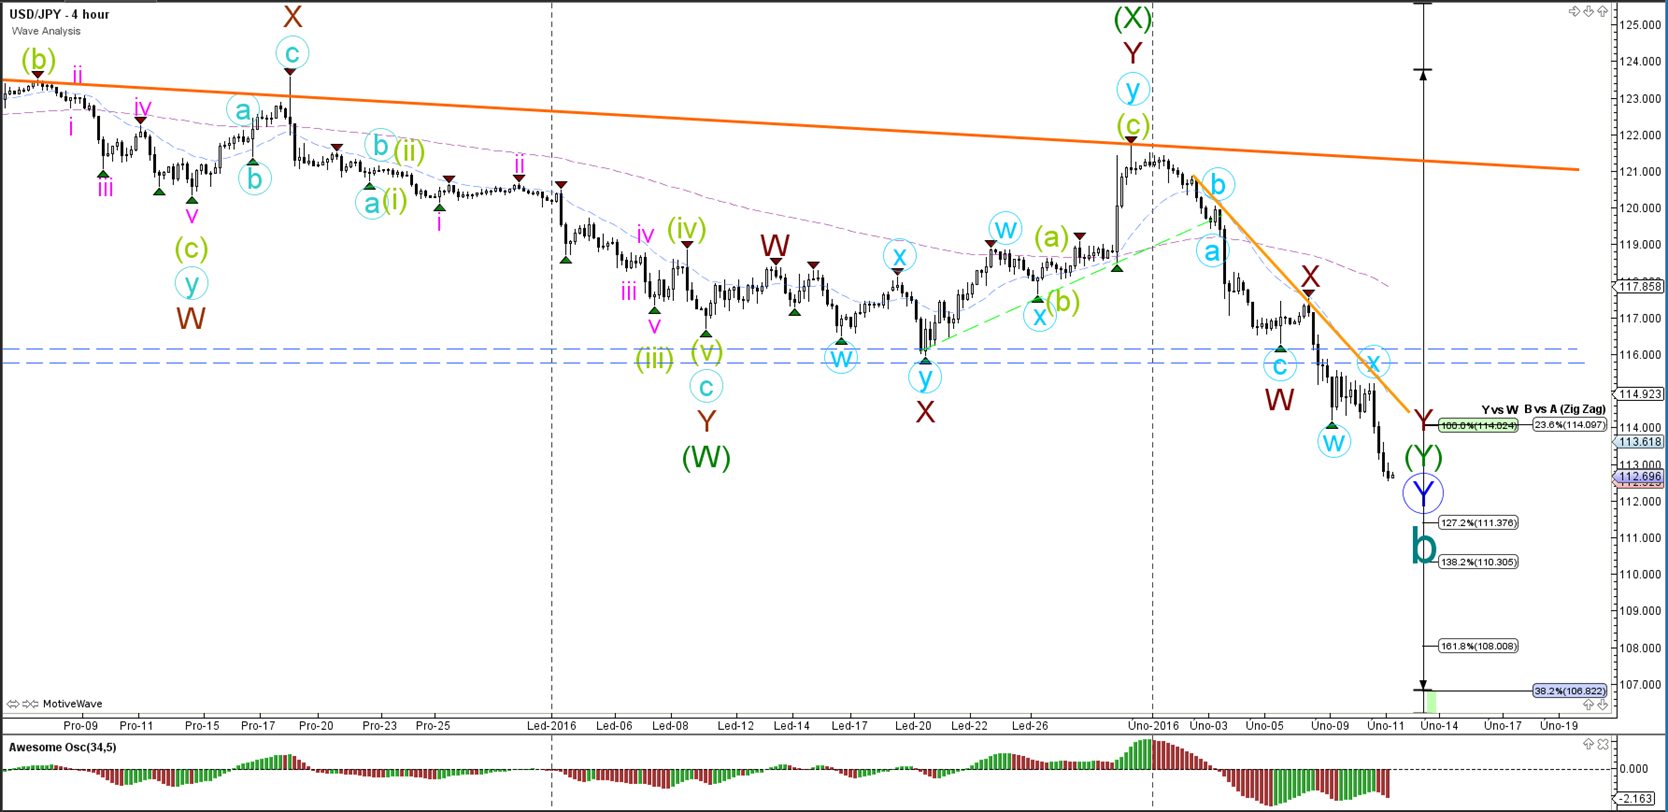
The USD/JPY broke the support trend line (green) and is moving down lower quickly to retest the bottoms (blue).
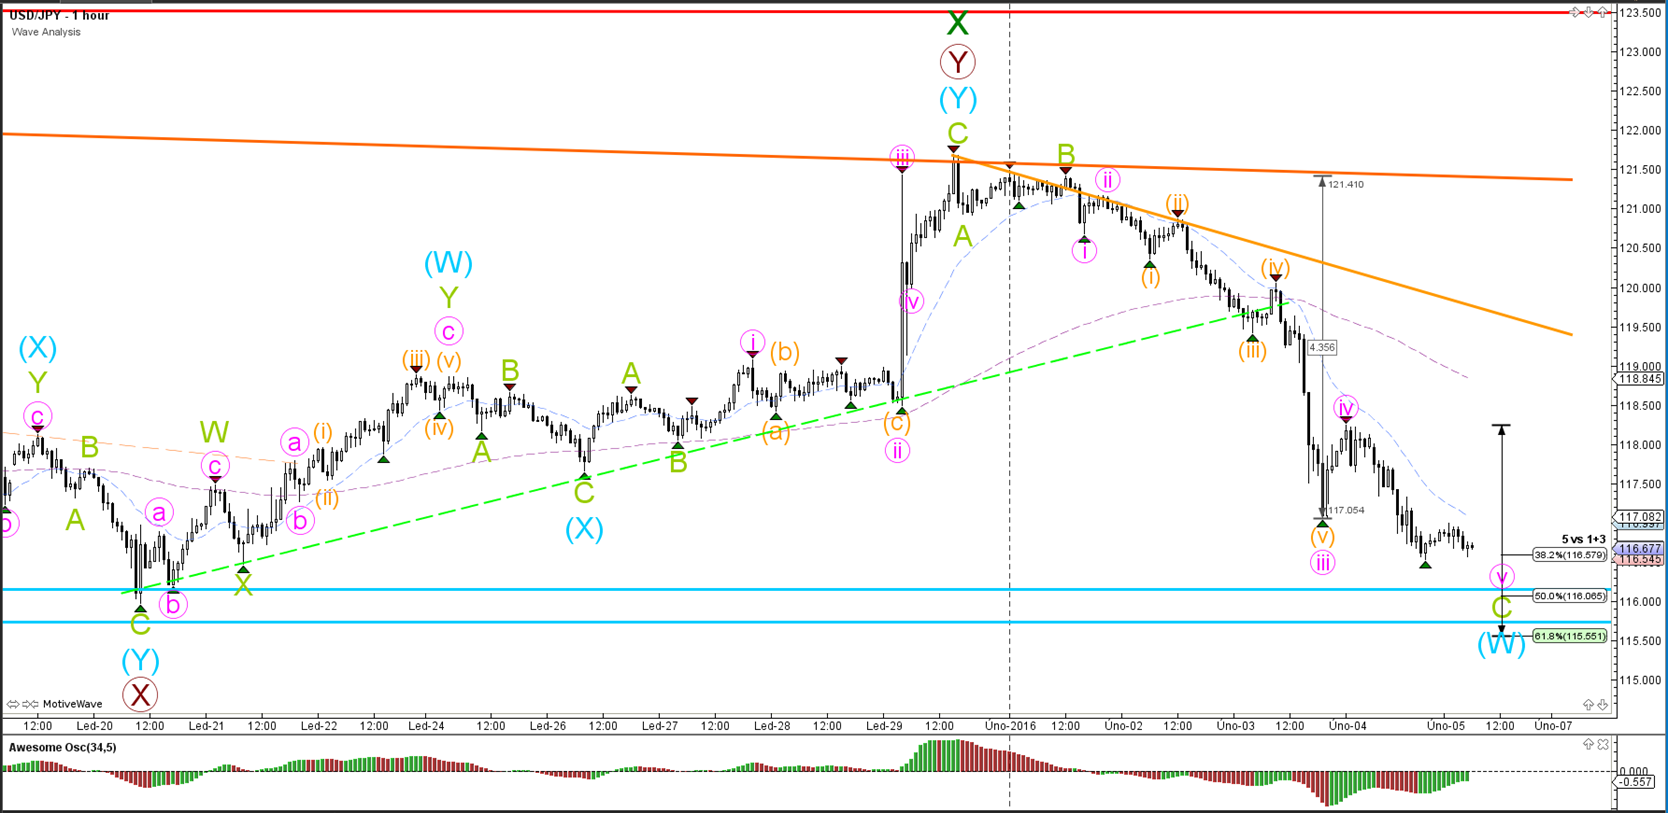
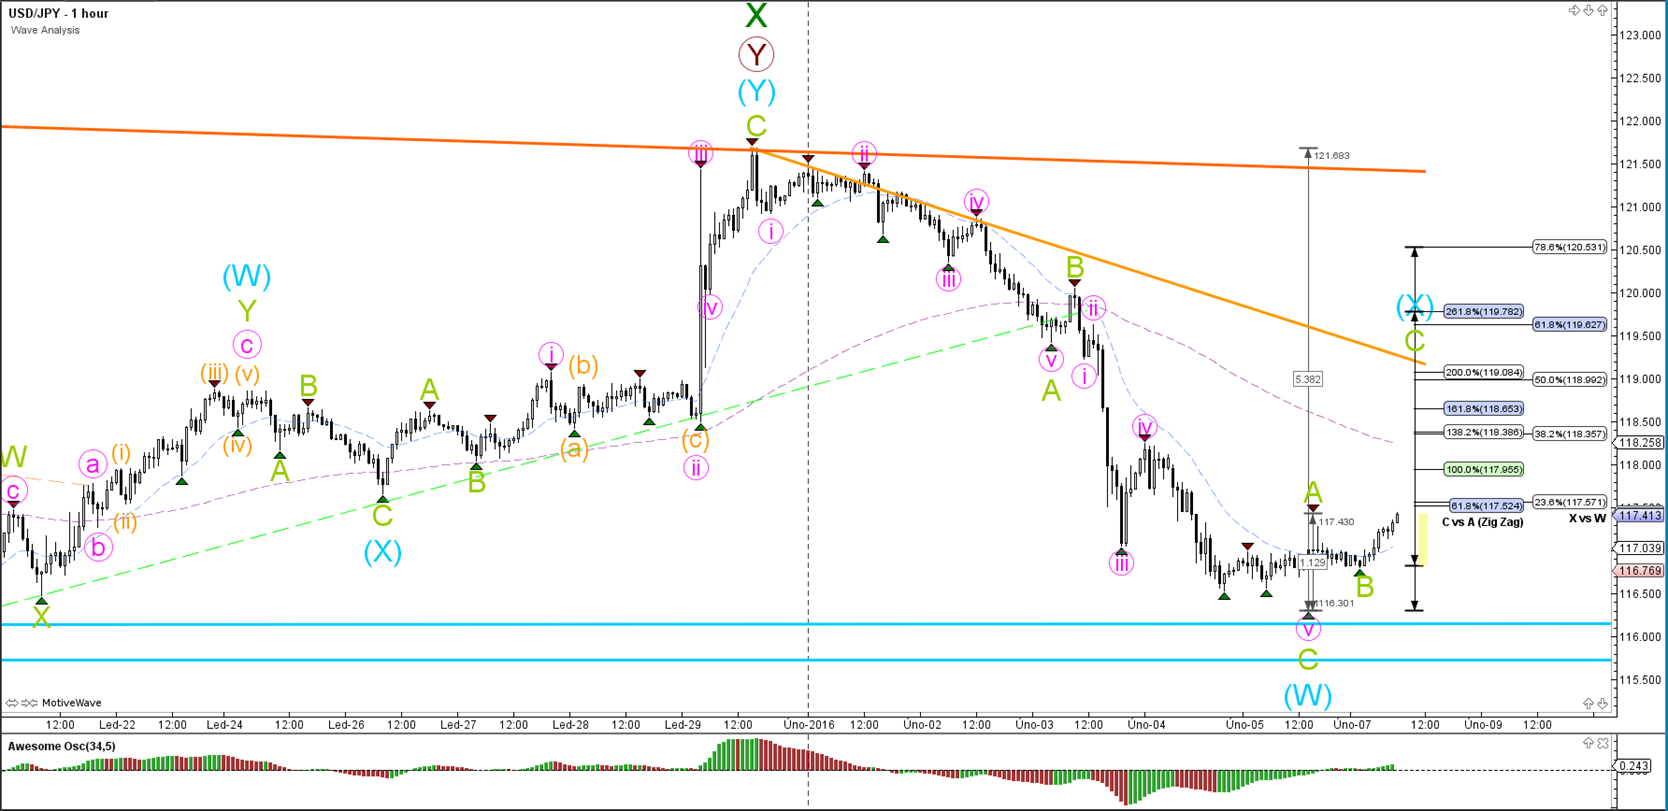
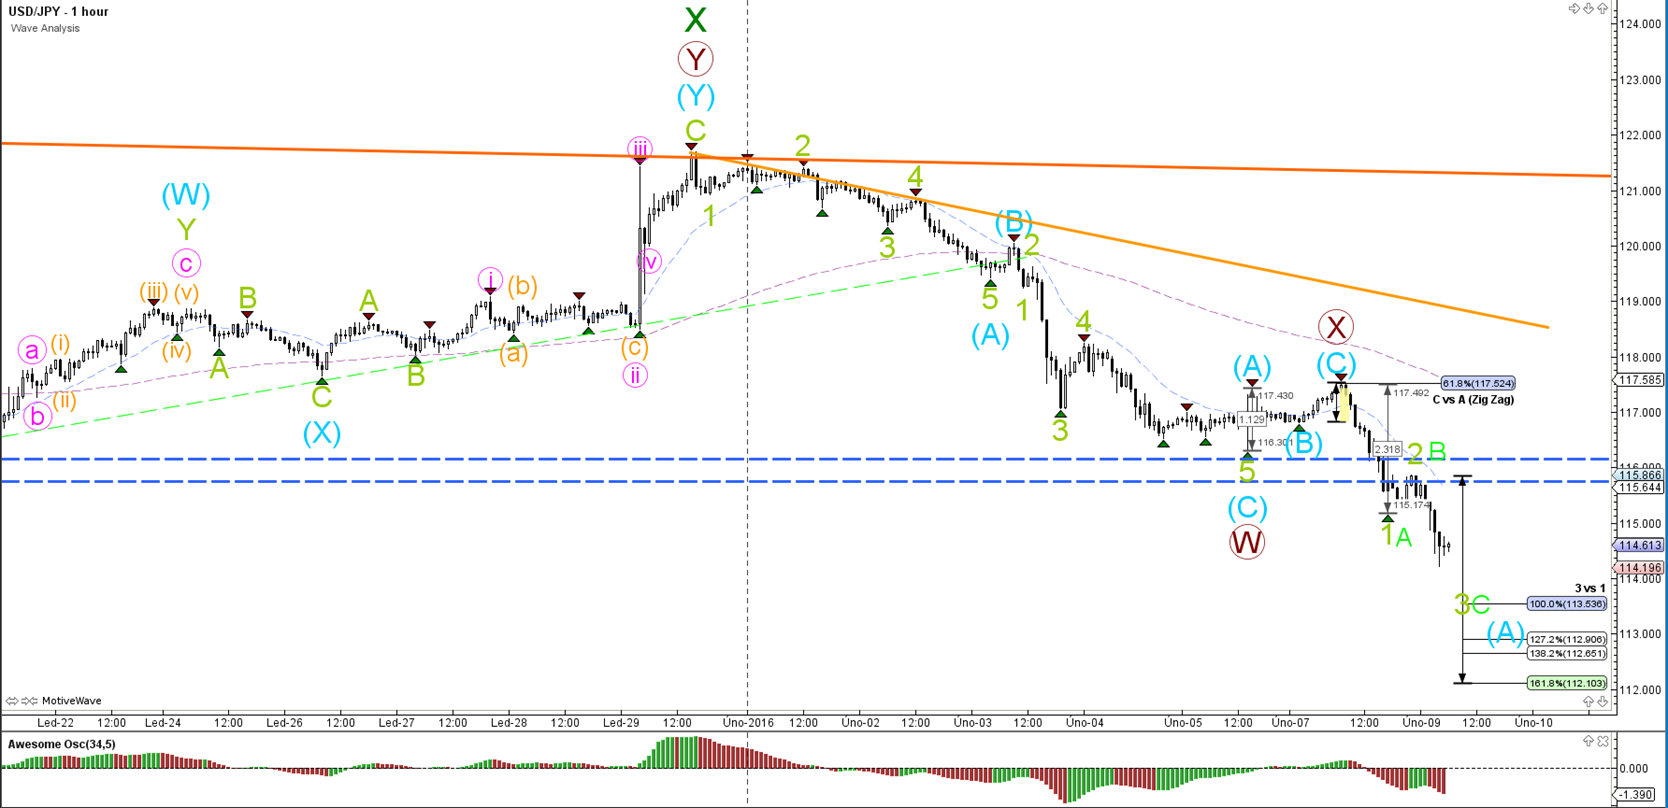
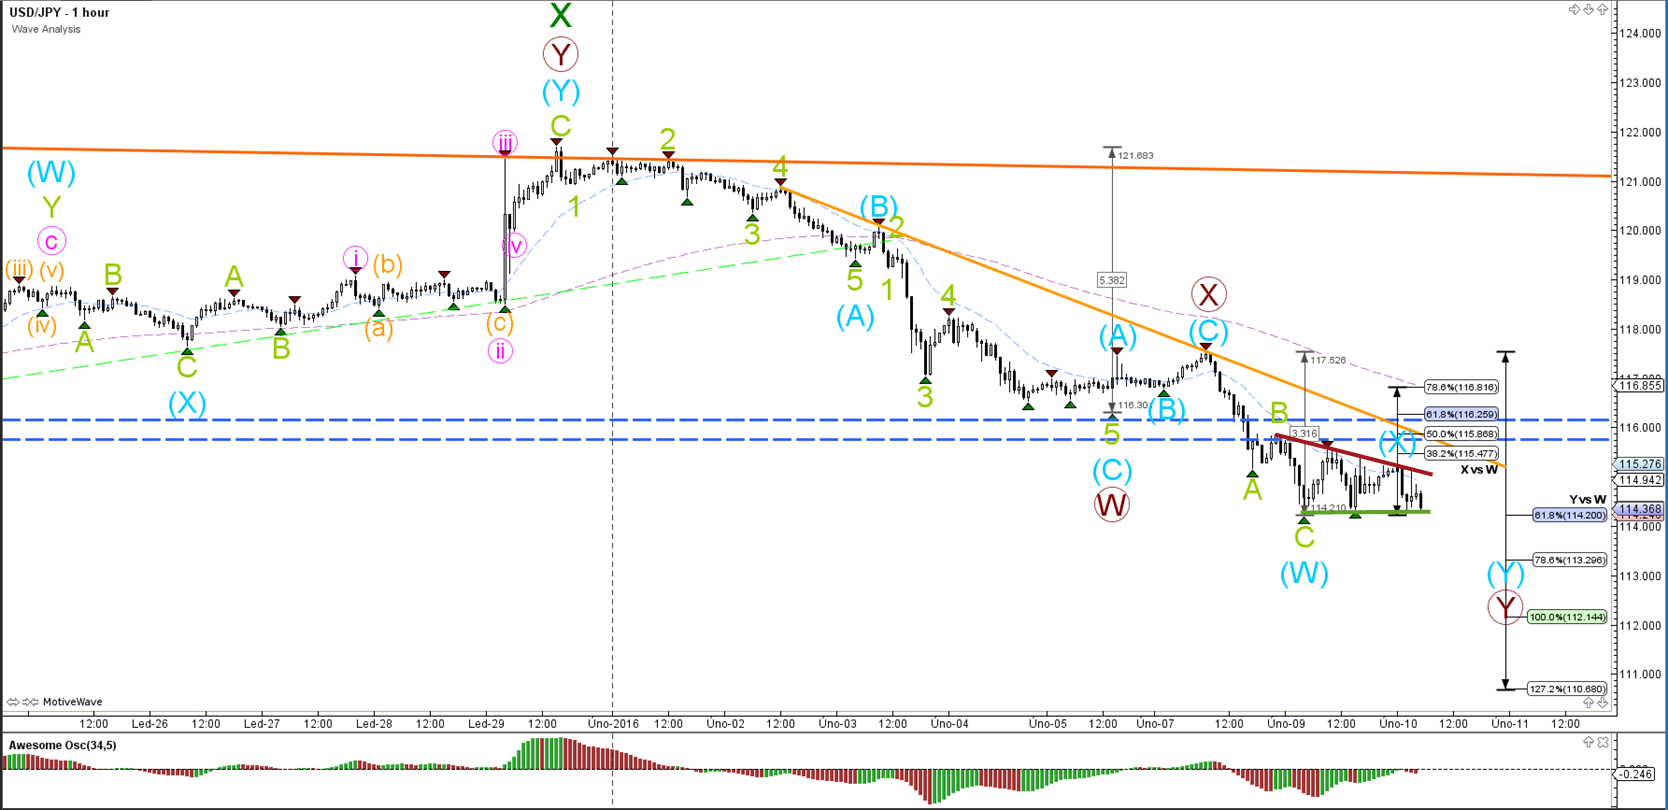
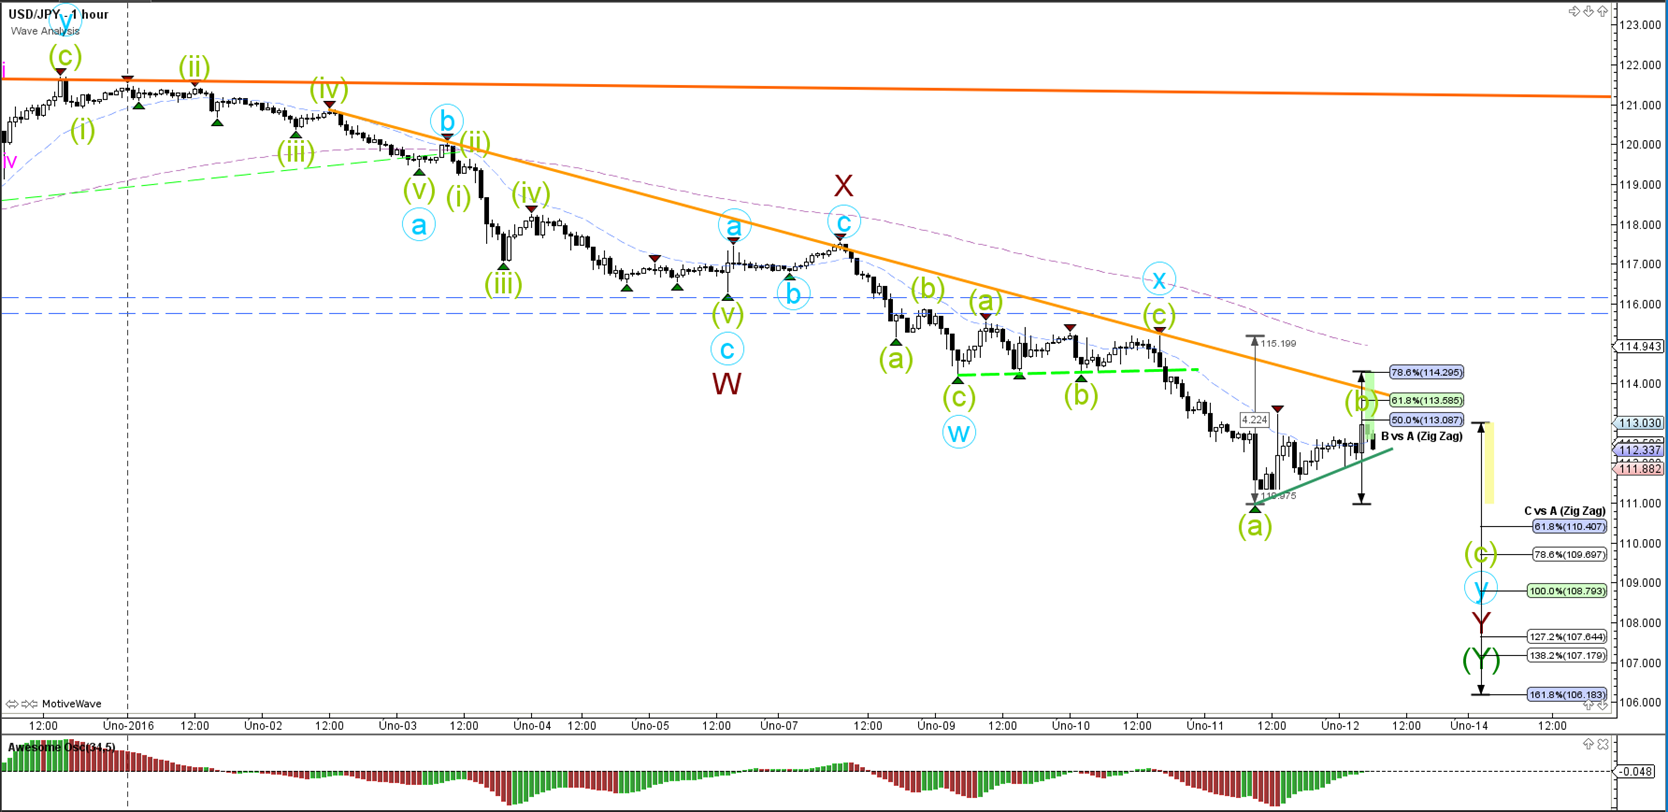
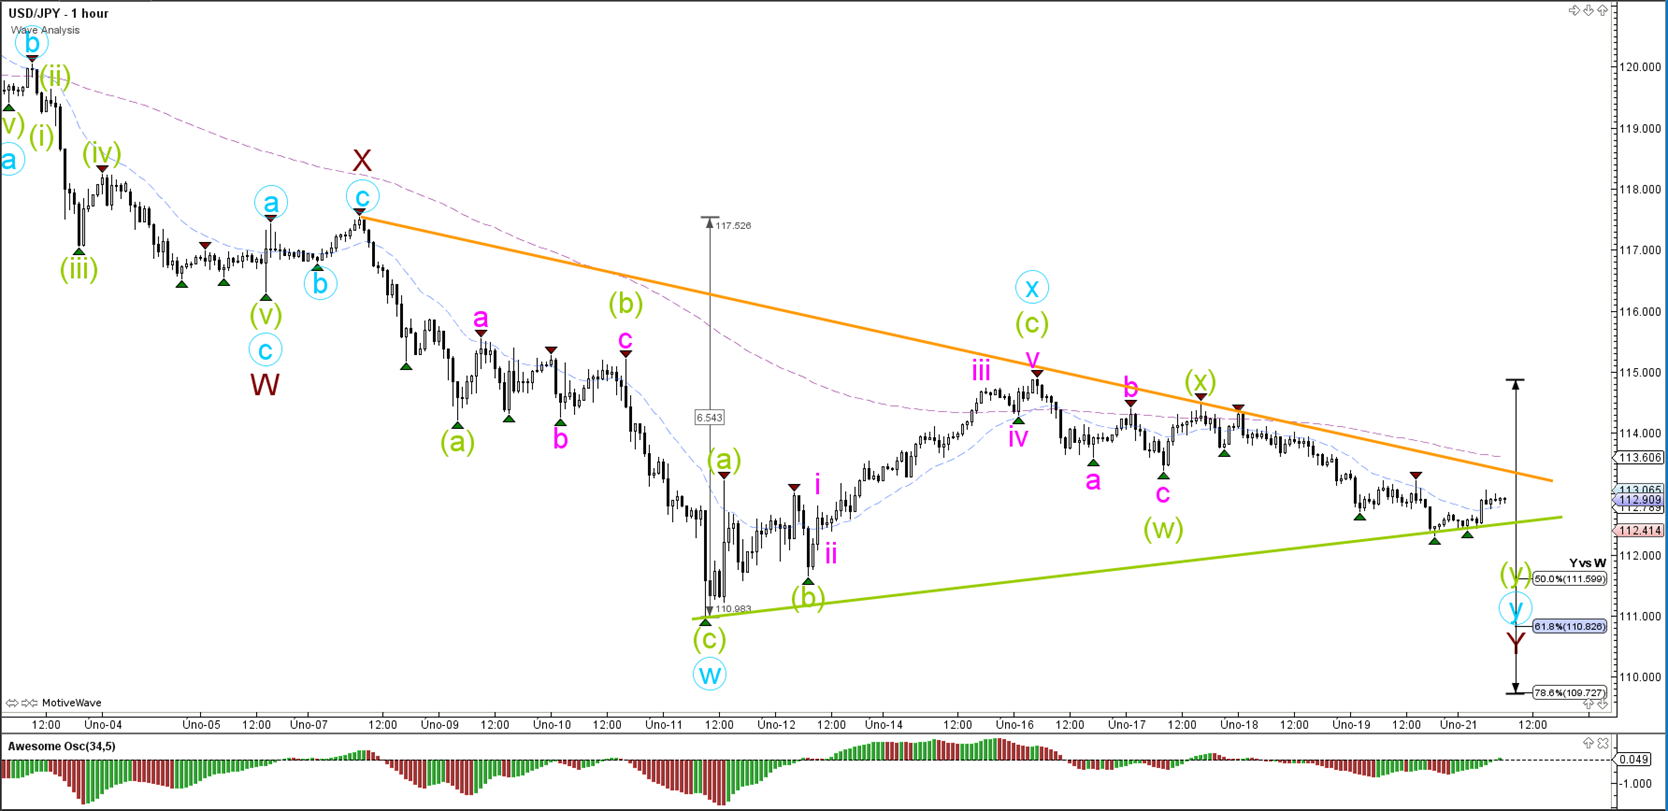
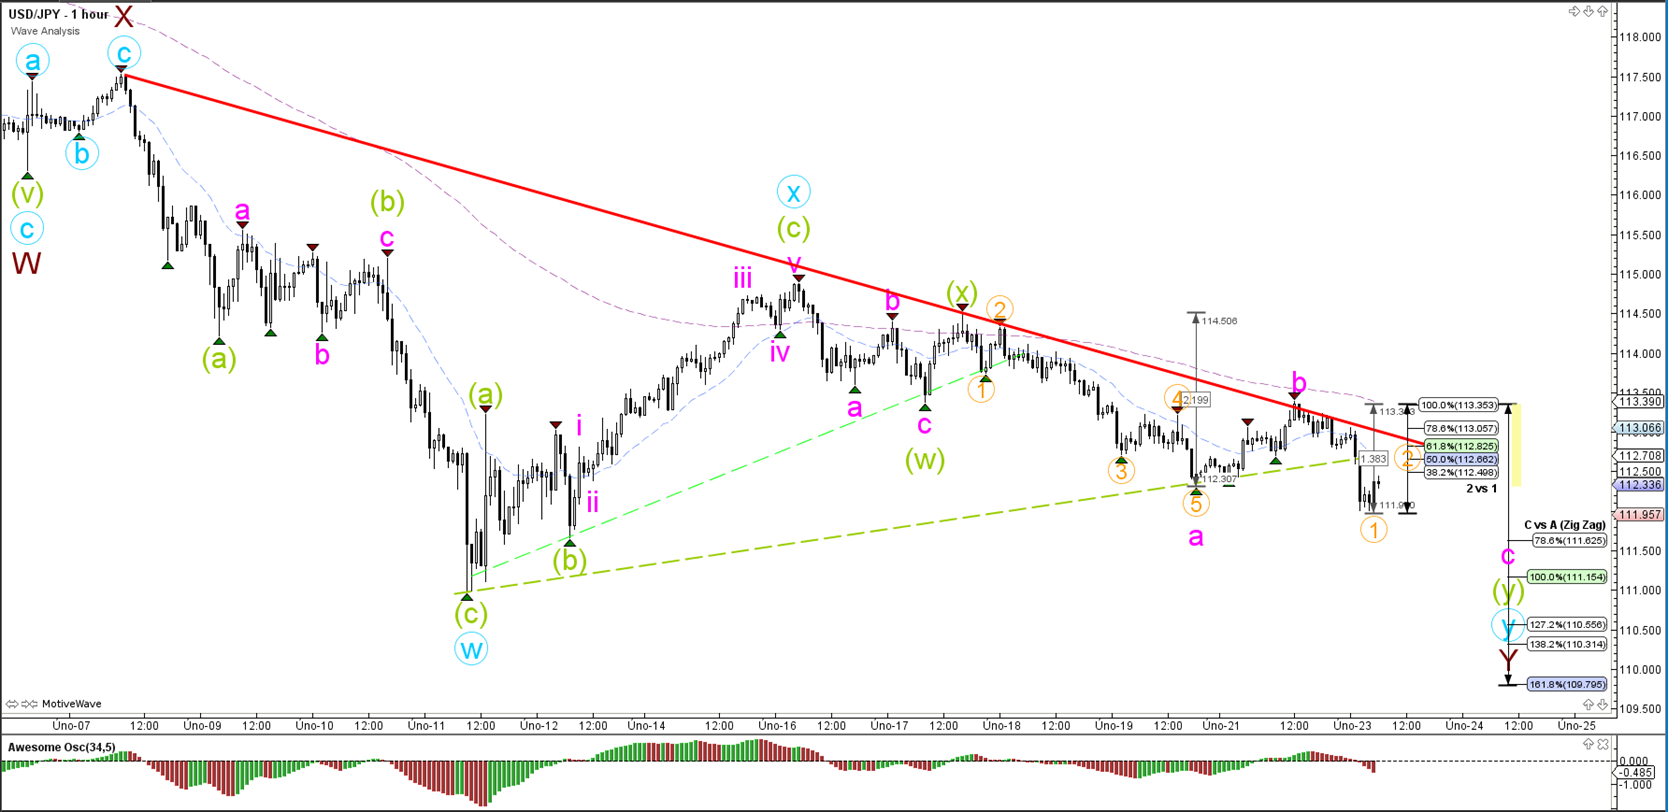
1 hour

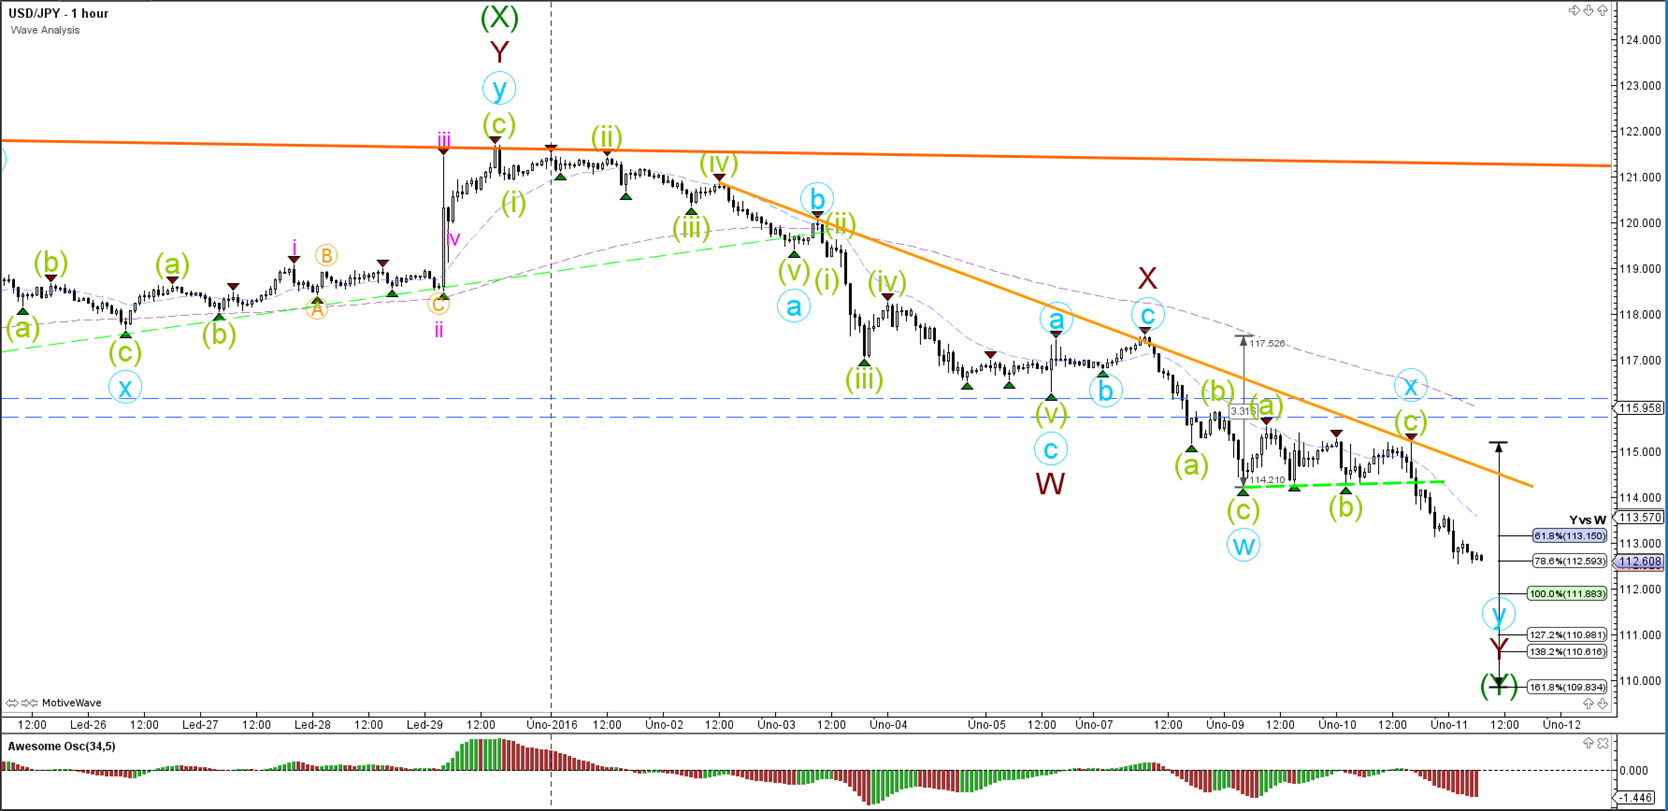
The USD/JPY has continued with bearish momentum and could now be in a wave 4 (pink) correction.
“Original analysis is provided by Admiral Markets”
EUR/USD
4 hour

The EUR/USD showed strong bullish momentum yesterday as price broke above the resistance levels (dotted lines). The wave count of the previous days indicated the likelihood of a bullish ABC zigzag (green). The break through the red dotted trend line also confirms that the wave C (brown) of wave X (green) was a correct wave count and invalidates the wave 3 (grey), which will be removed in future analysis.
1 hour
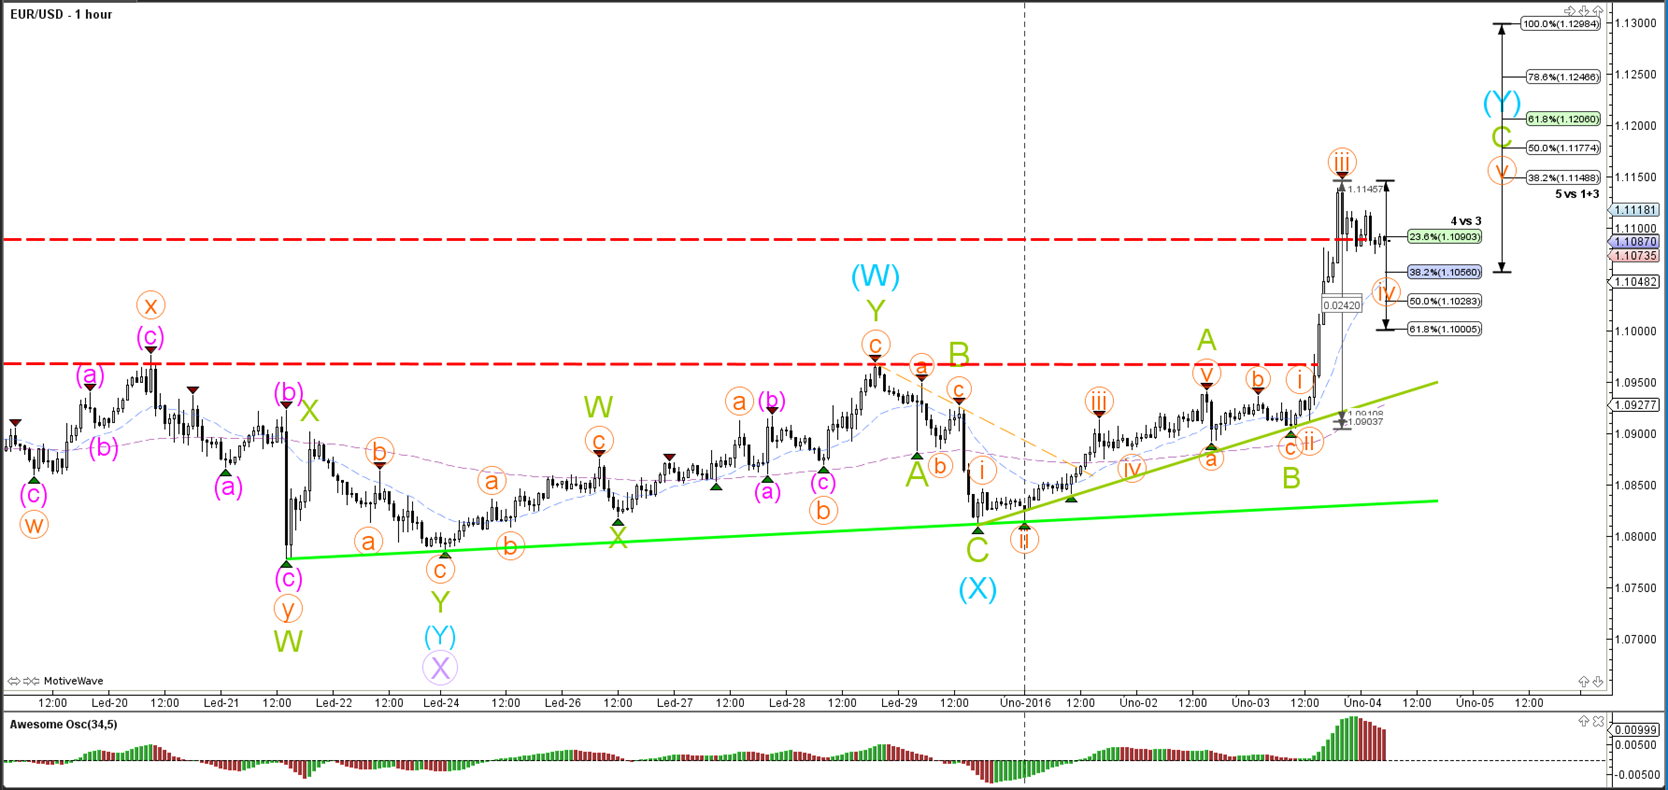
The EUR/USD seems to have completed an impulsive wave 3 (orange) and is now building a triangle as part of a wave 4. The wave 4 could make a retracement but typically will stop around the 38.2% Fibonacci level.
GBP/USD
4 hour
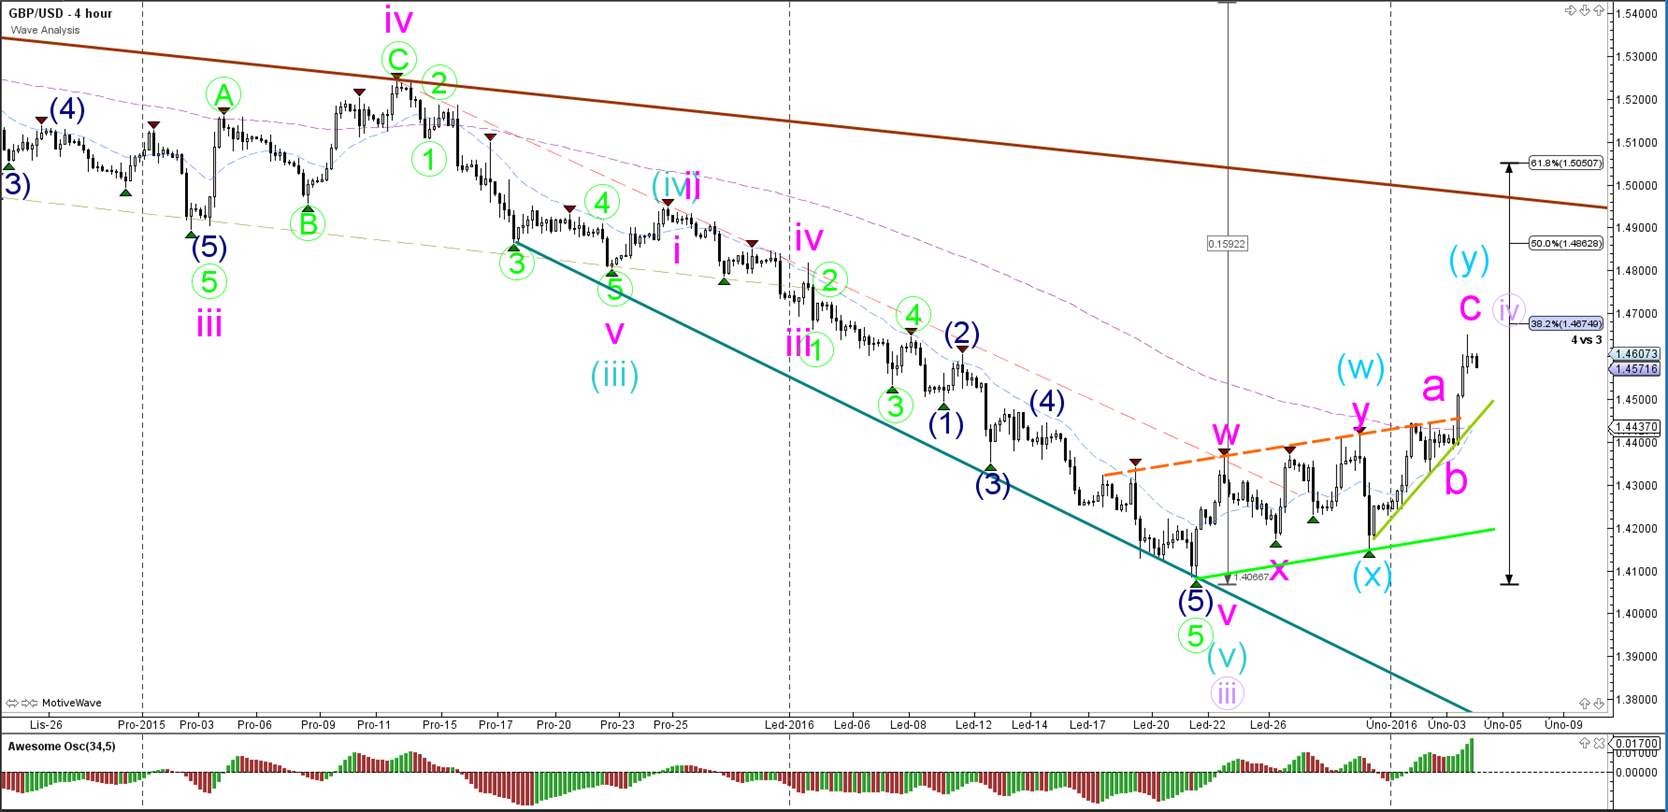
The GBP/USD is also showing bullish momentum similar to that of the EUR/USD. Also in this case an expected ABC zigzag (pink) unfolded to enlarge the correction of the wave 4 (purple). Price (almost) hit the 38.2% Fibonacci level of wave 4, which could be a bearish bouncing spot. The maximum retracement I would expect for a wave 4 is the 50% Fib.
1 hour
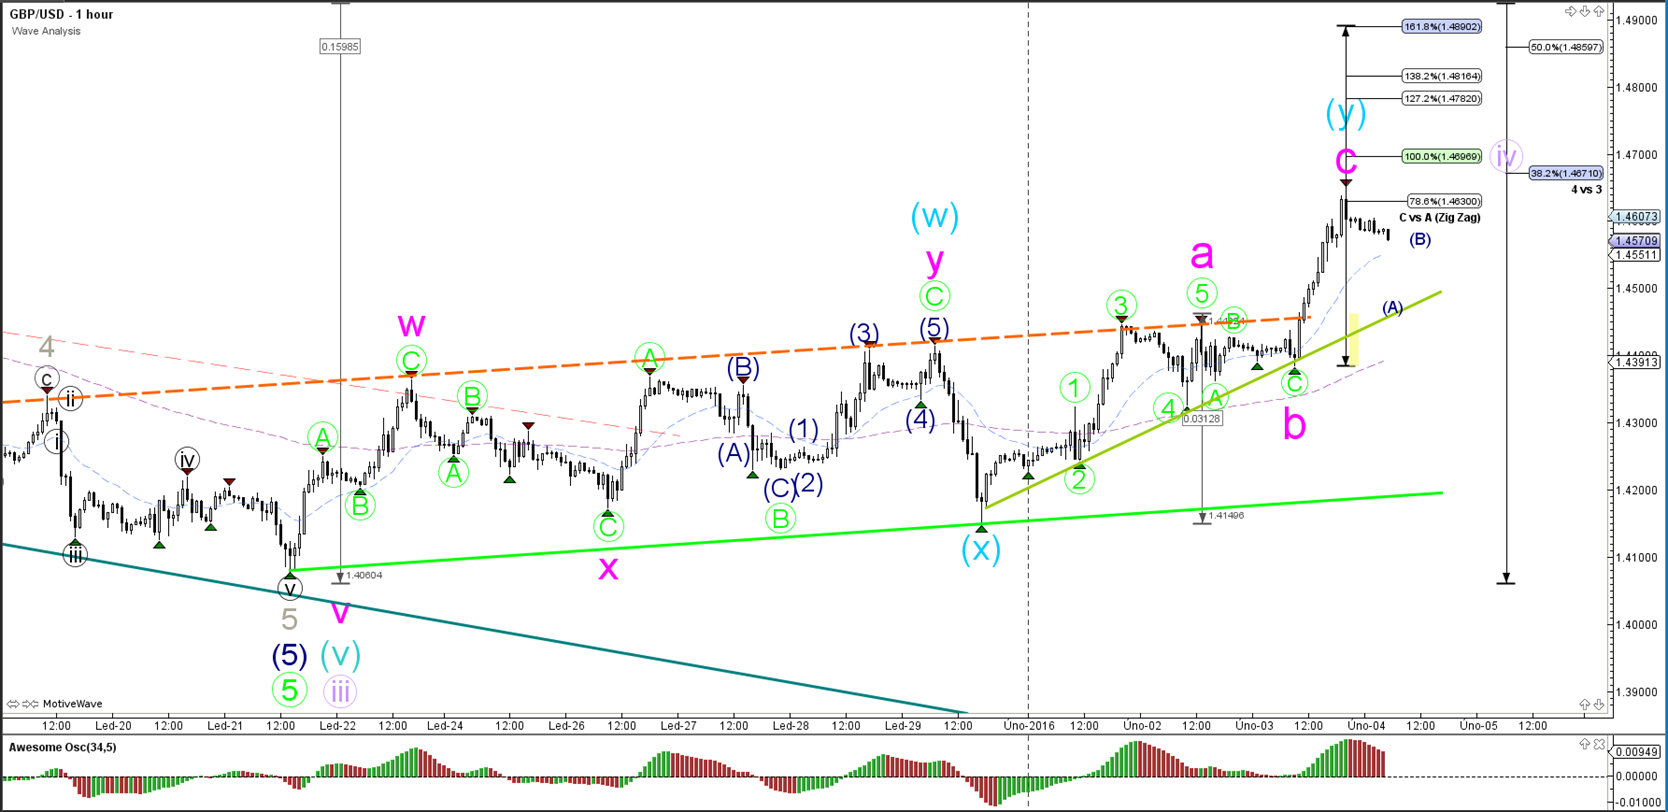
The GBP/USD 1 hour is unclear at the moment whether wave C (pink) is completed or will still push higher. There could be one more bullish push remaining similar to the 5 wave (orange) on the EUR/USD. The alternative is an ABC (blue) correction.
USD/JPY
4 hour
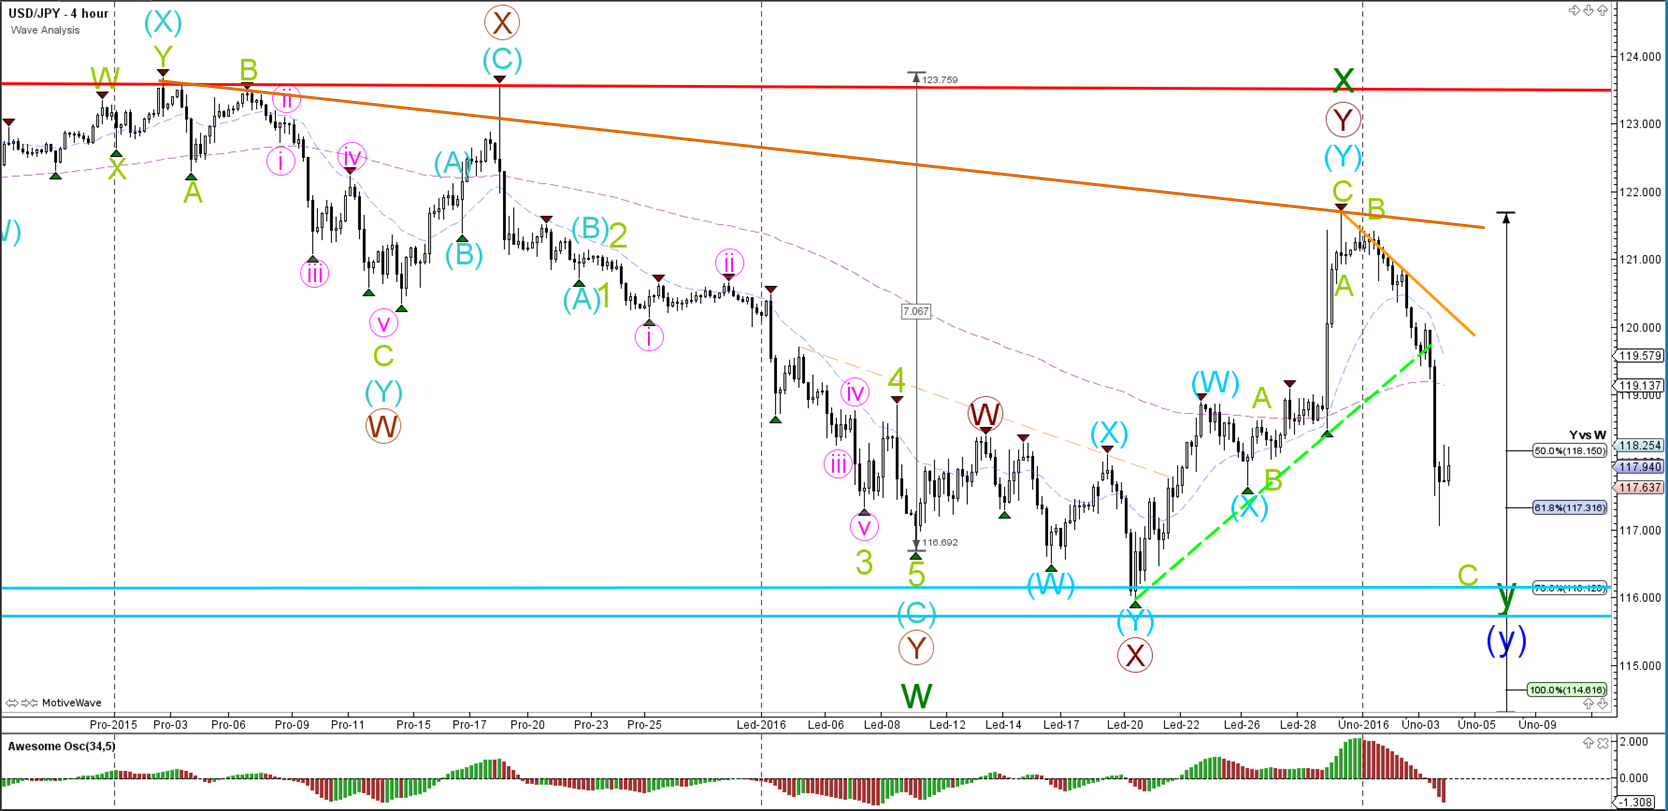
The USD/JPY broke the support trend line (green) and is moving down lower quickly to retest the bottoms (blue).
1 hour
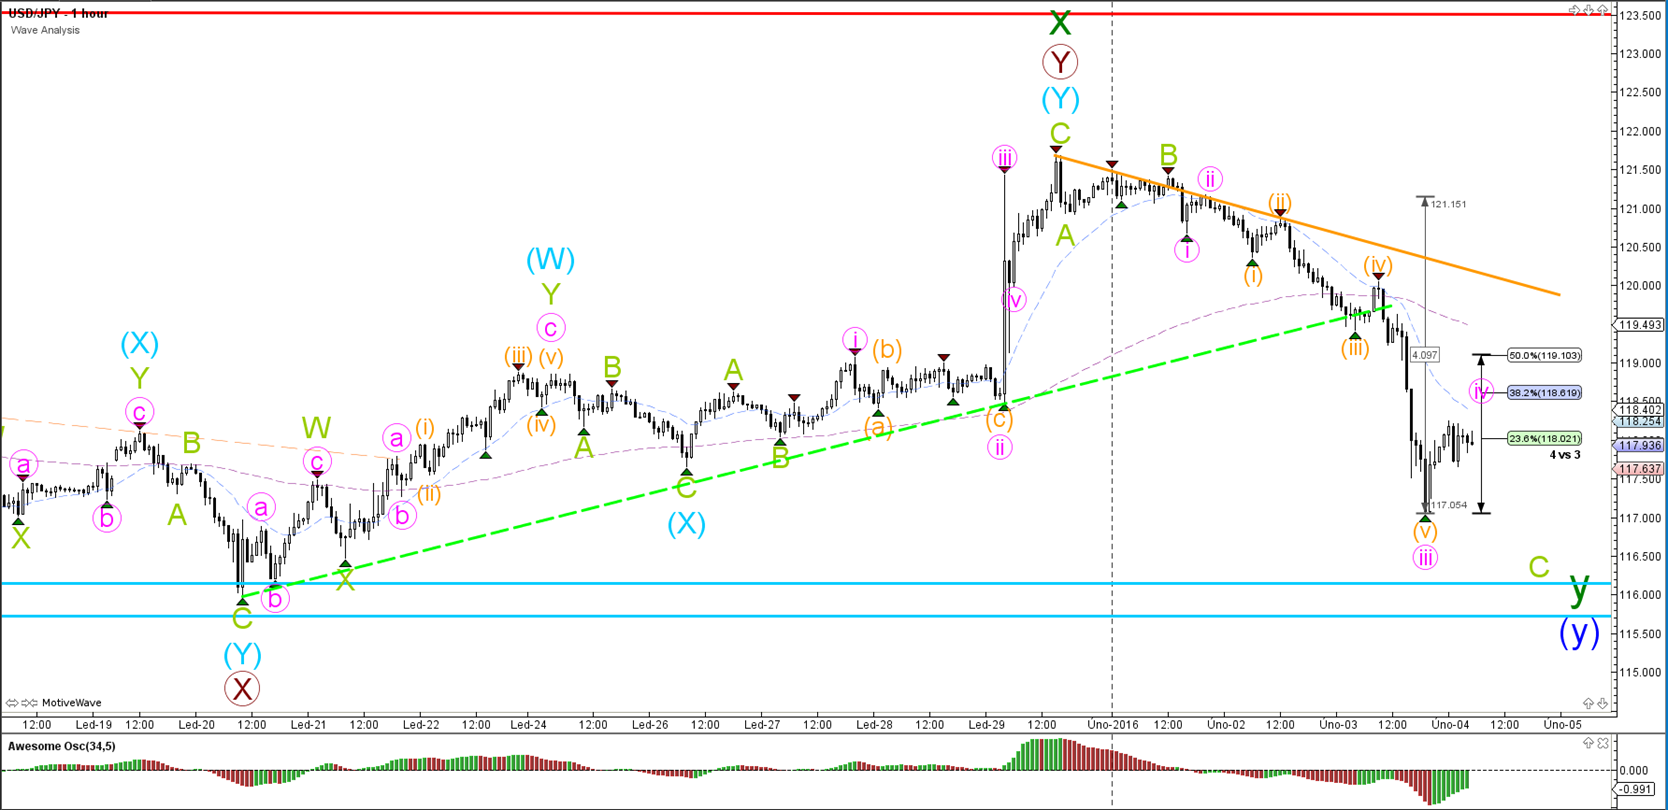
The USD/JPY has continued with bearish momentum and could now be in a wave 4 (pink) correction.
“Original analysis is provided by Admiral Markets”