Admiral Markets
AdmiralMarkets.com Representative
- Messages
- 95
US Dollar trapped between support and resistance
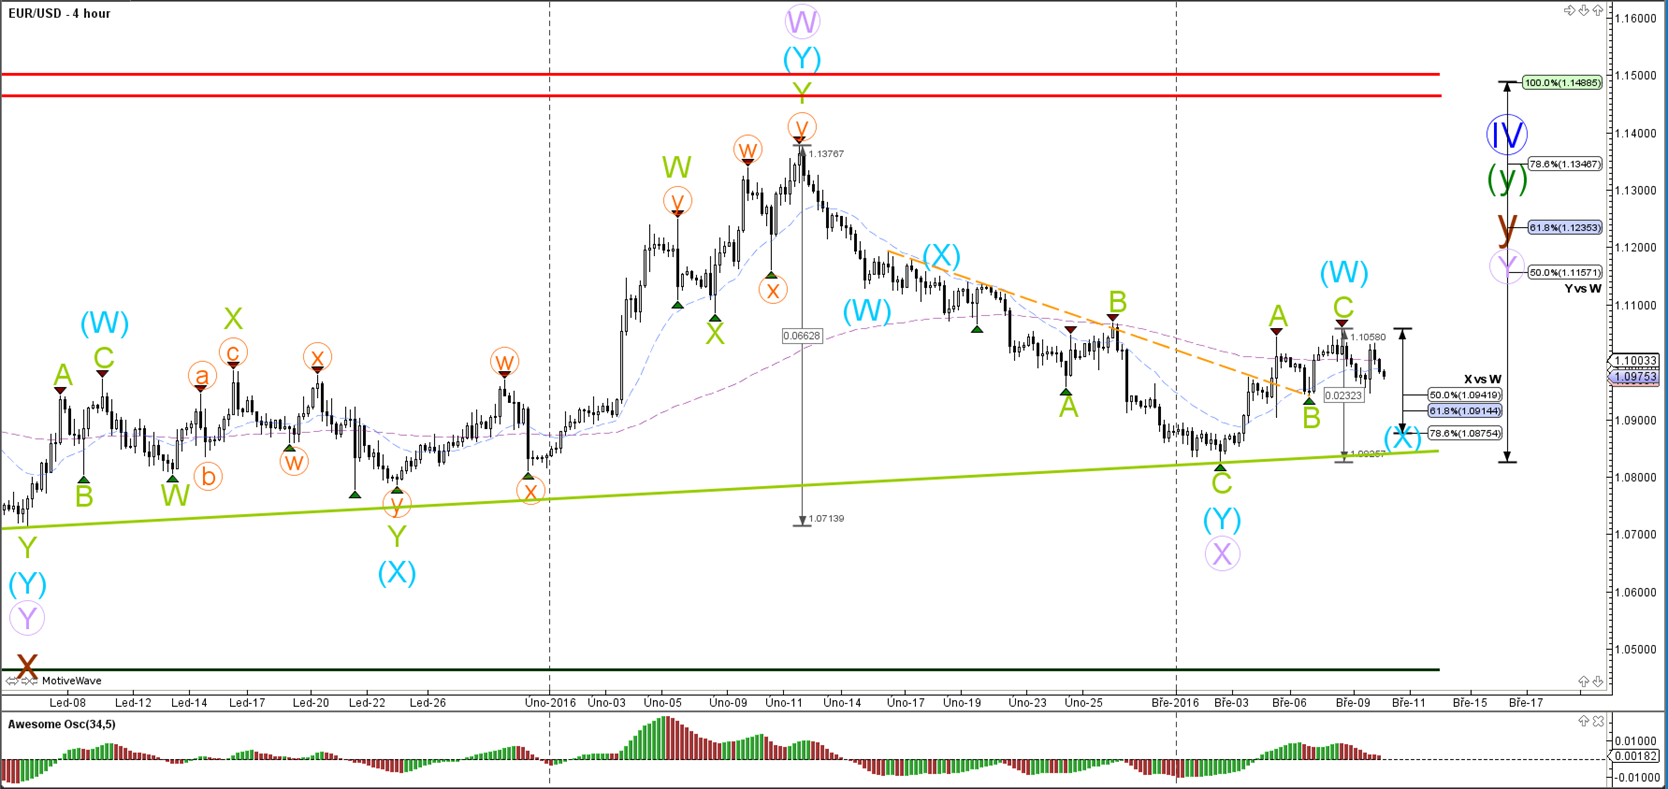
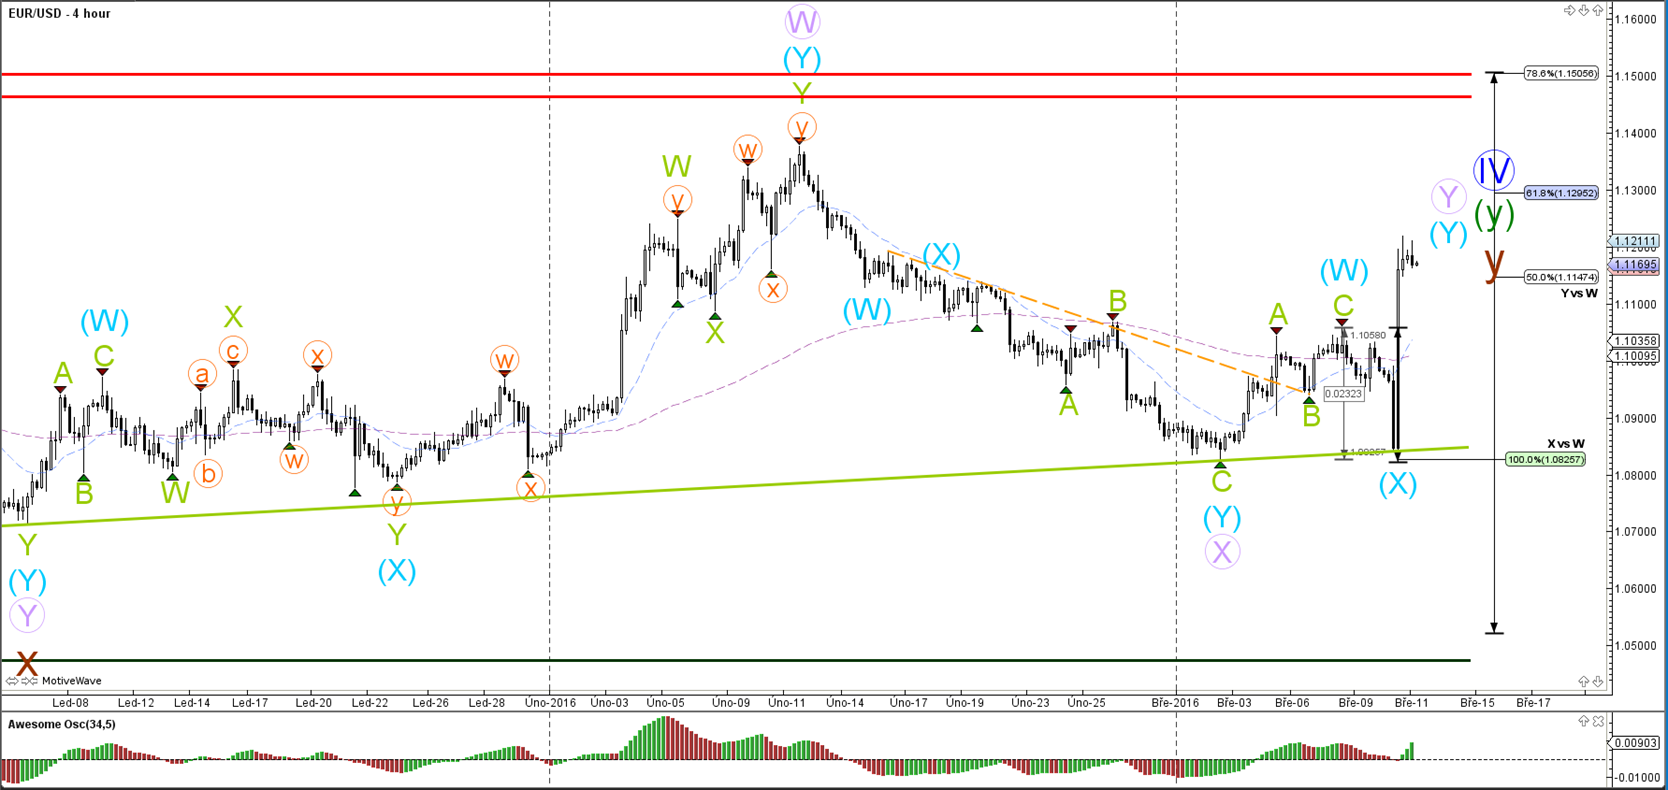
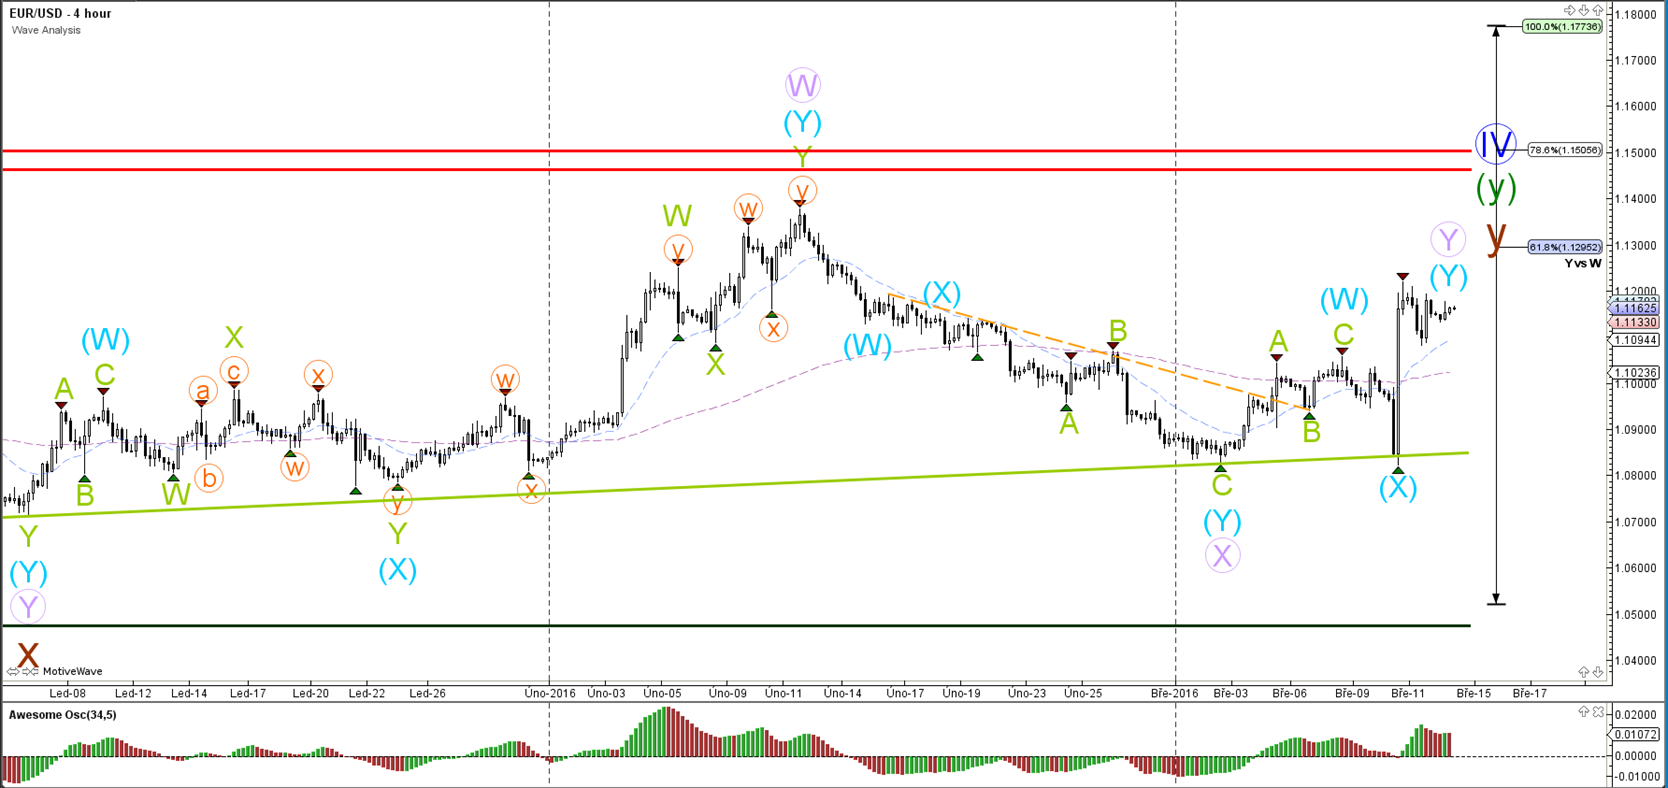
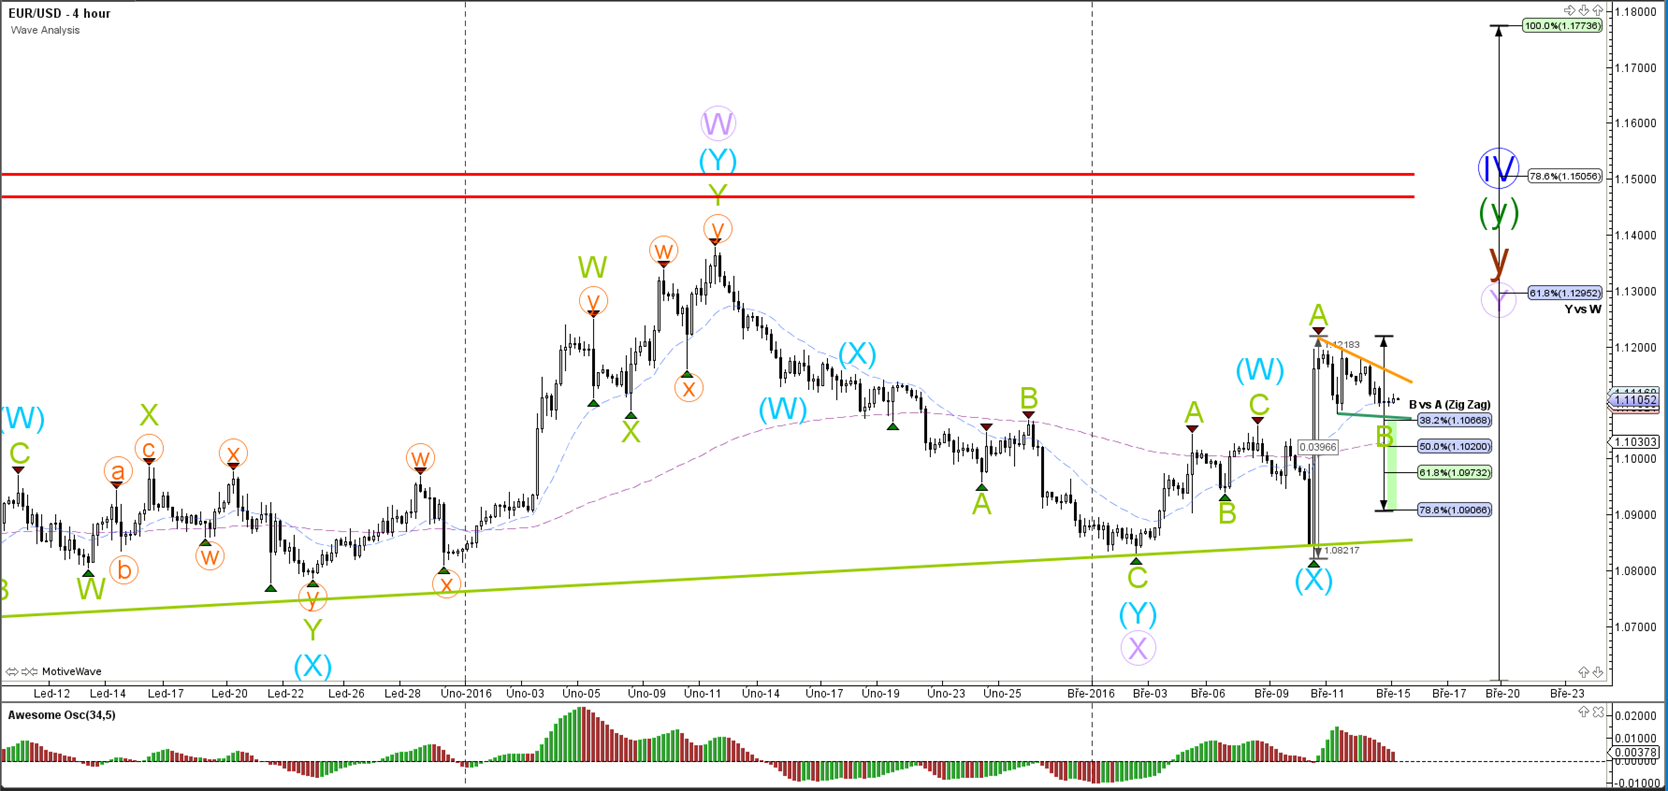
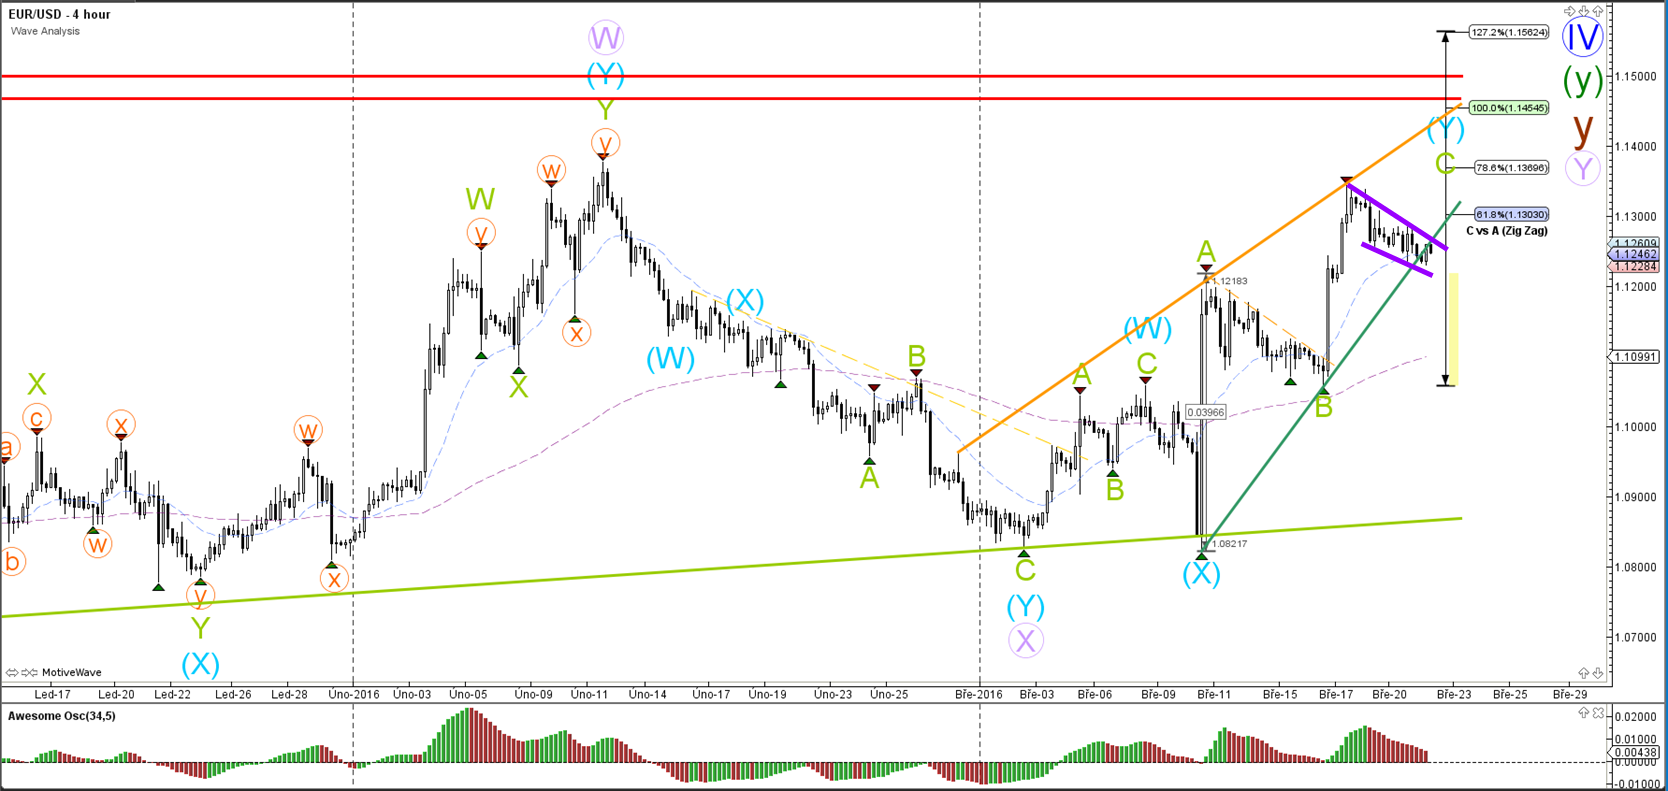
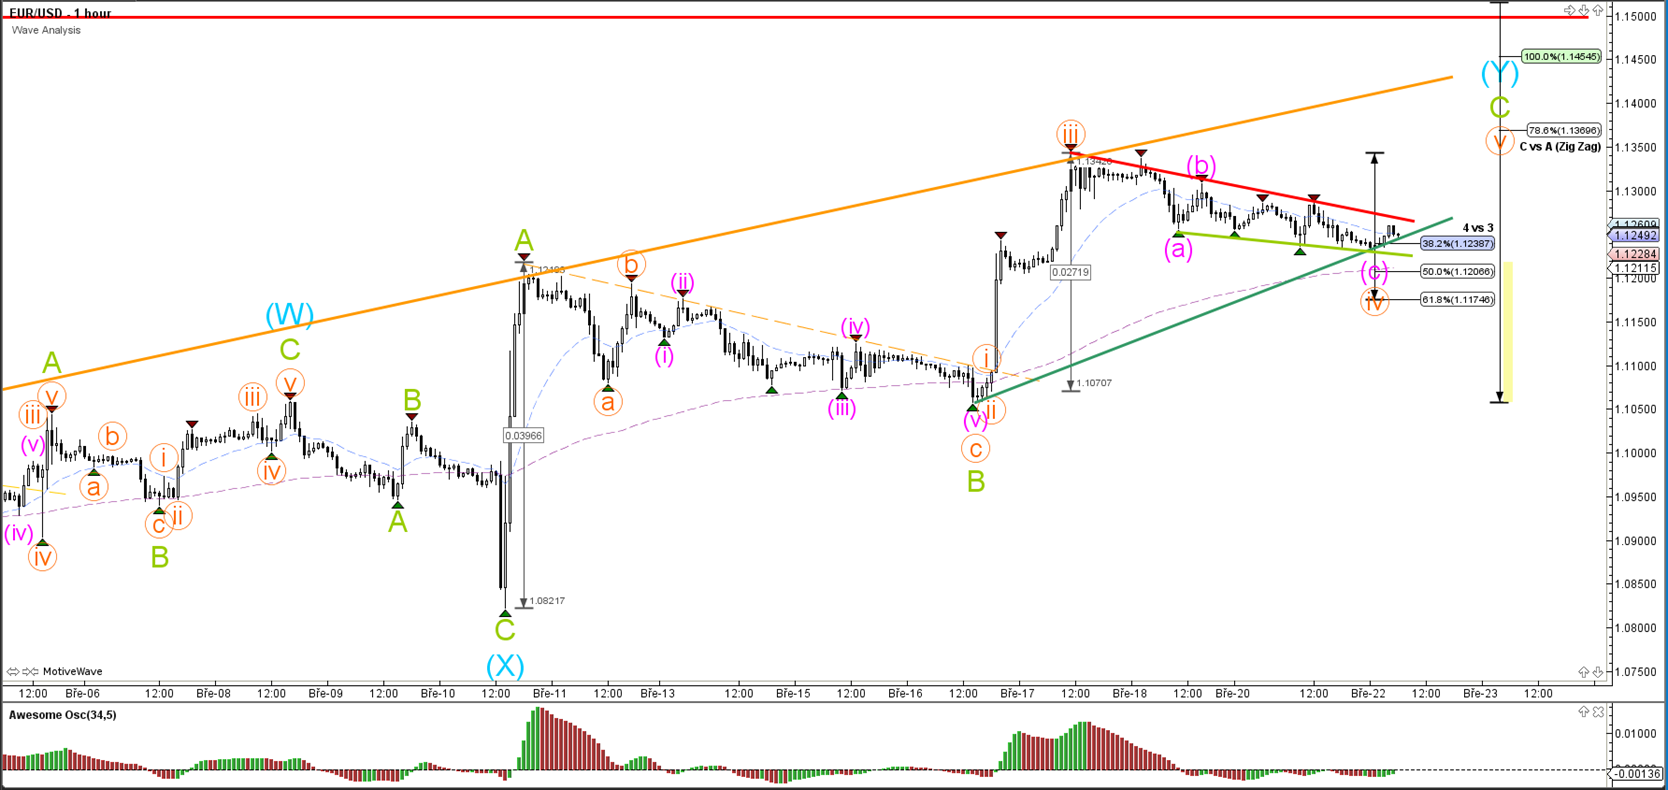
EUR/USD
4 hour

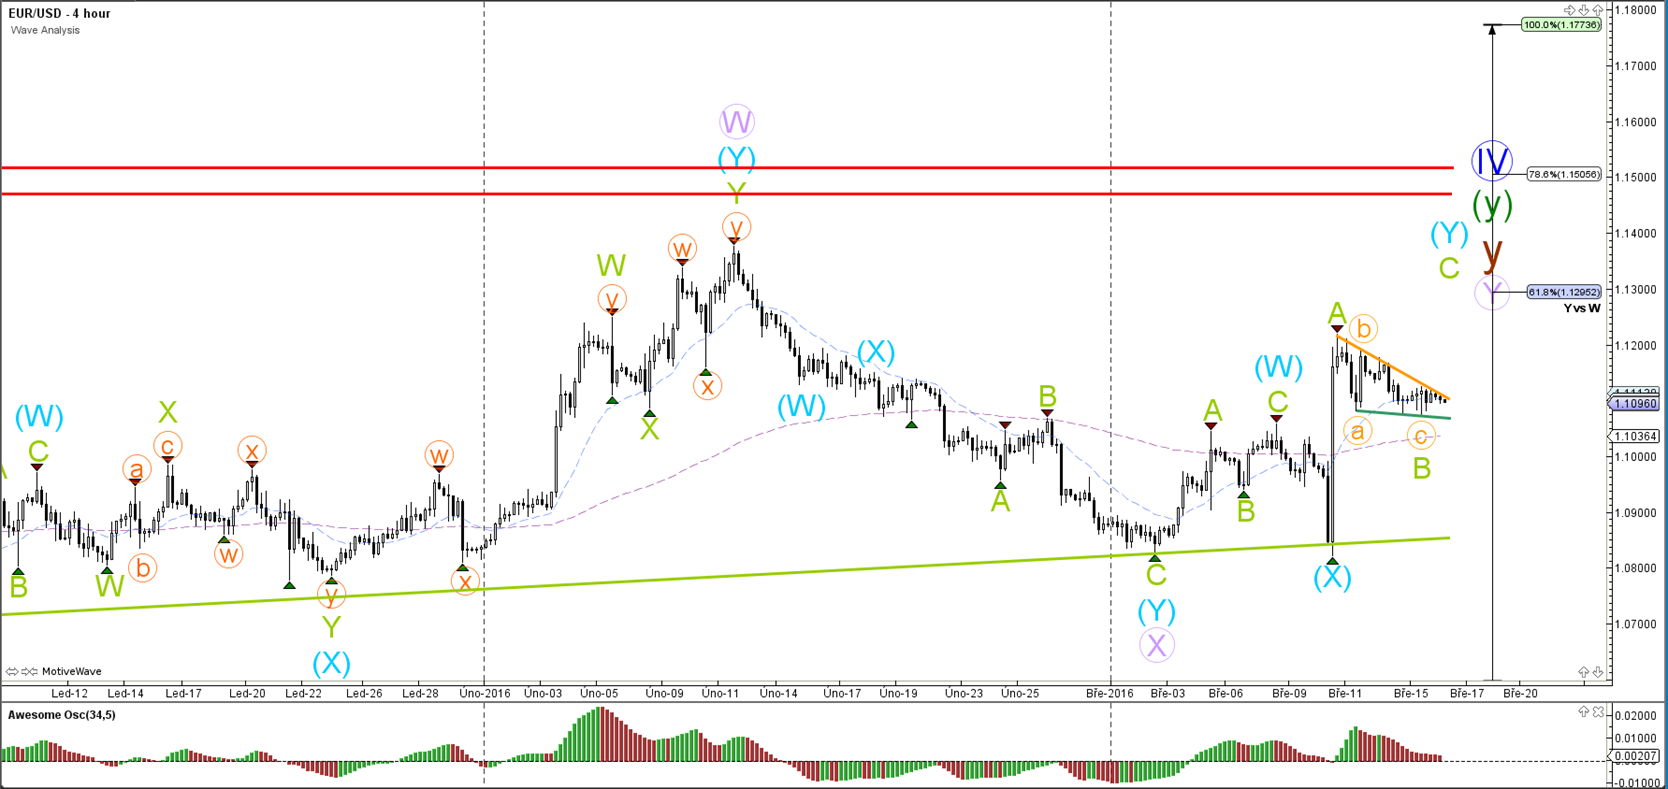
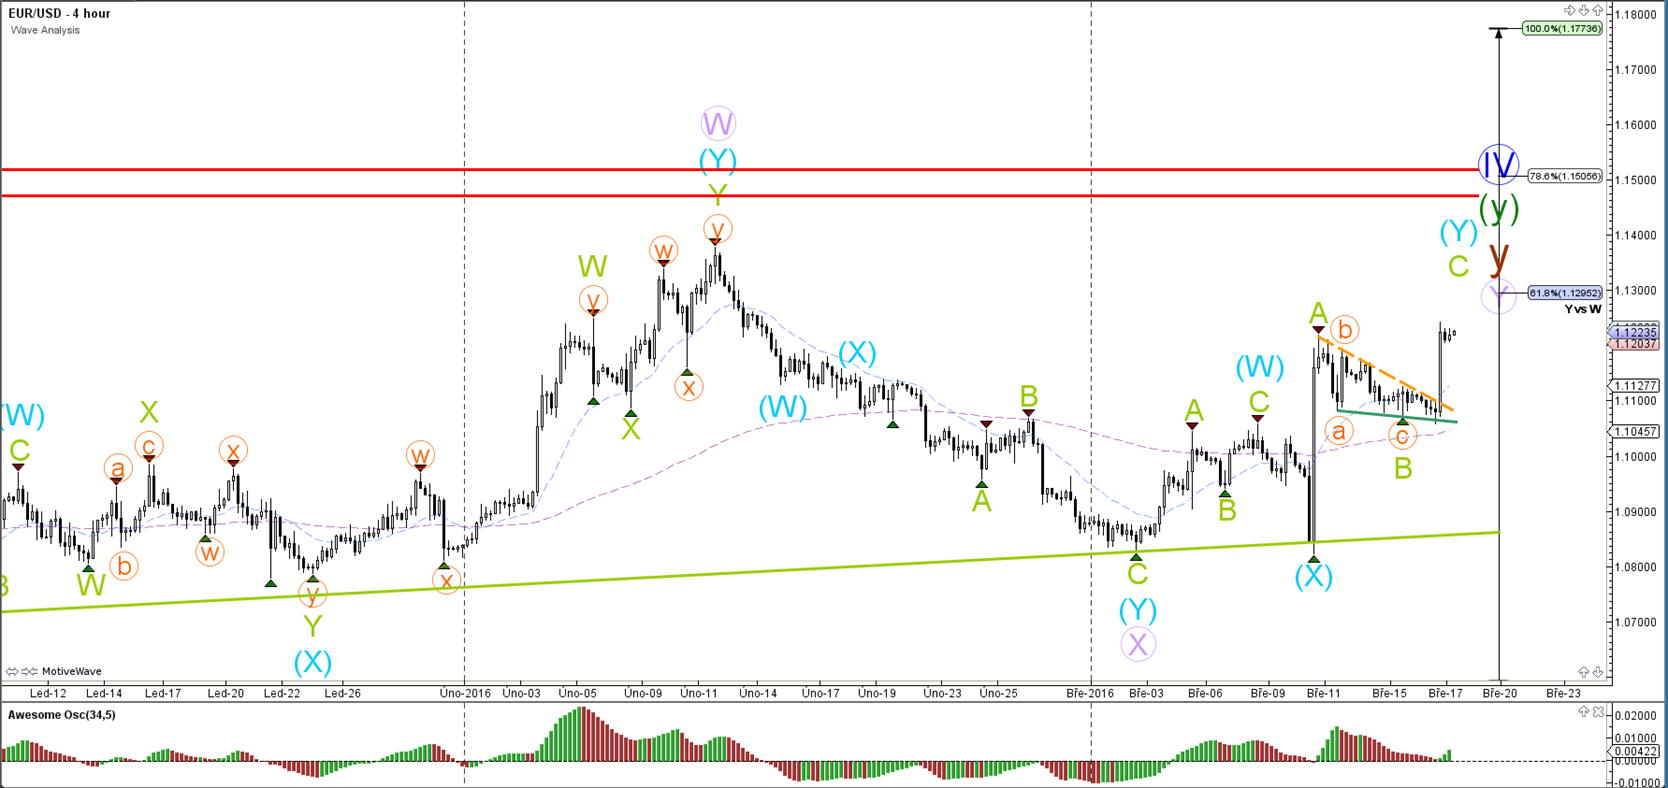
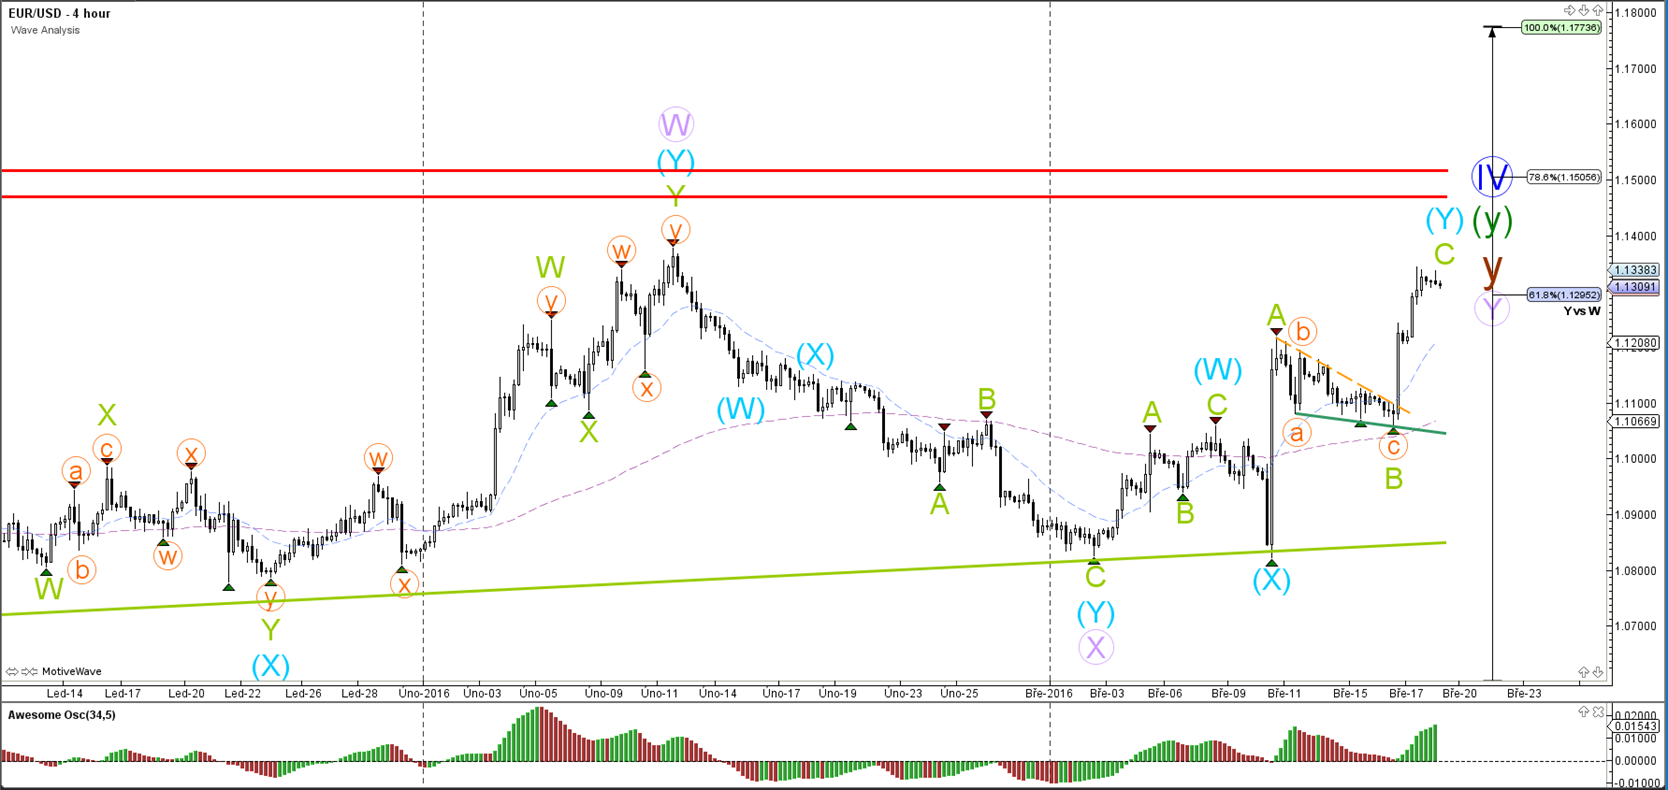
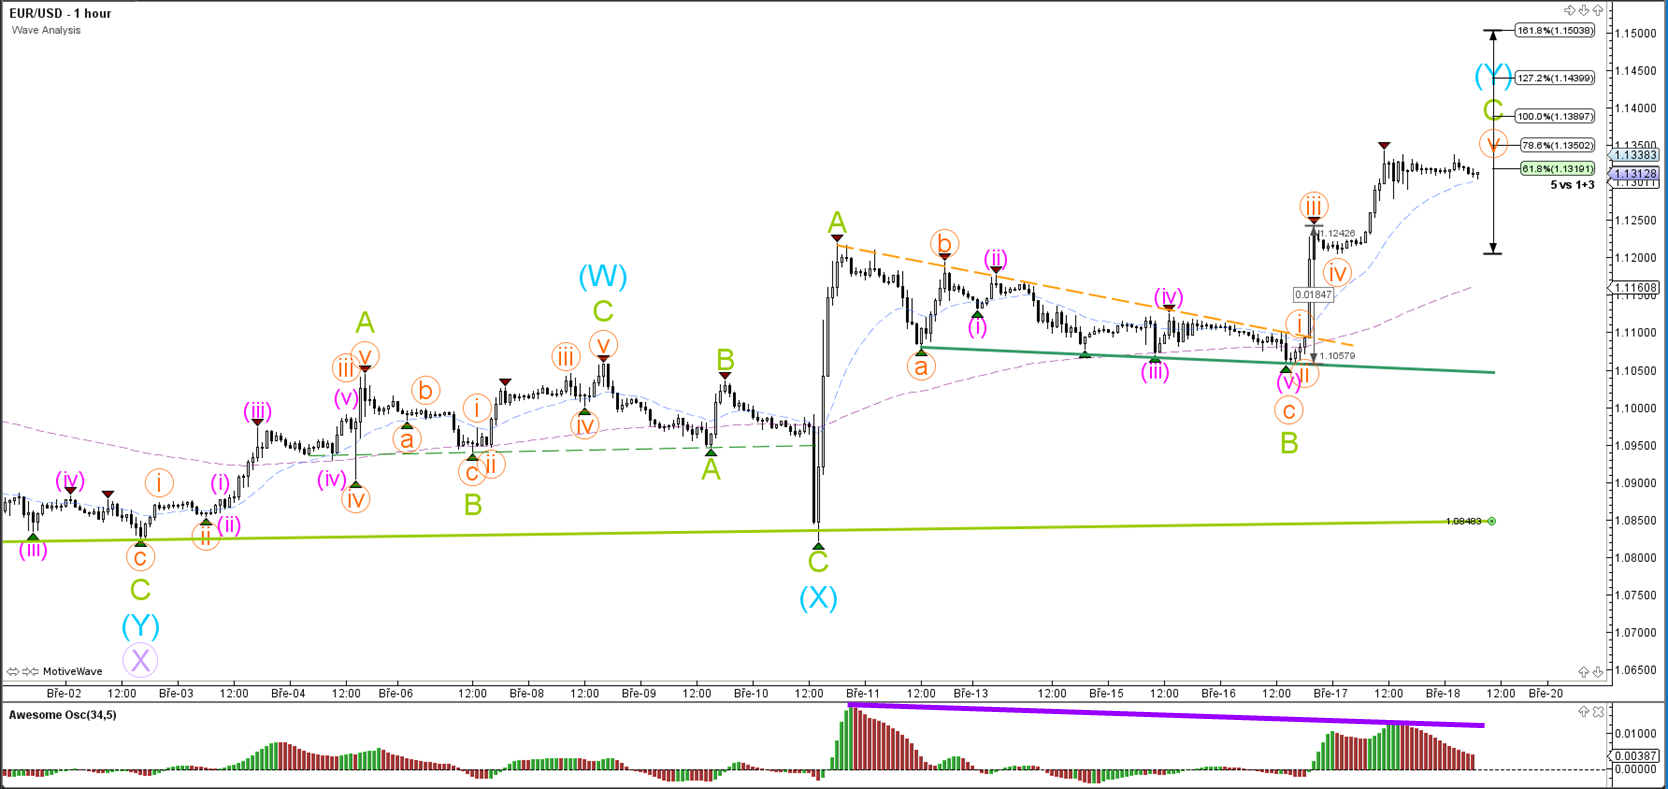
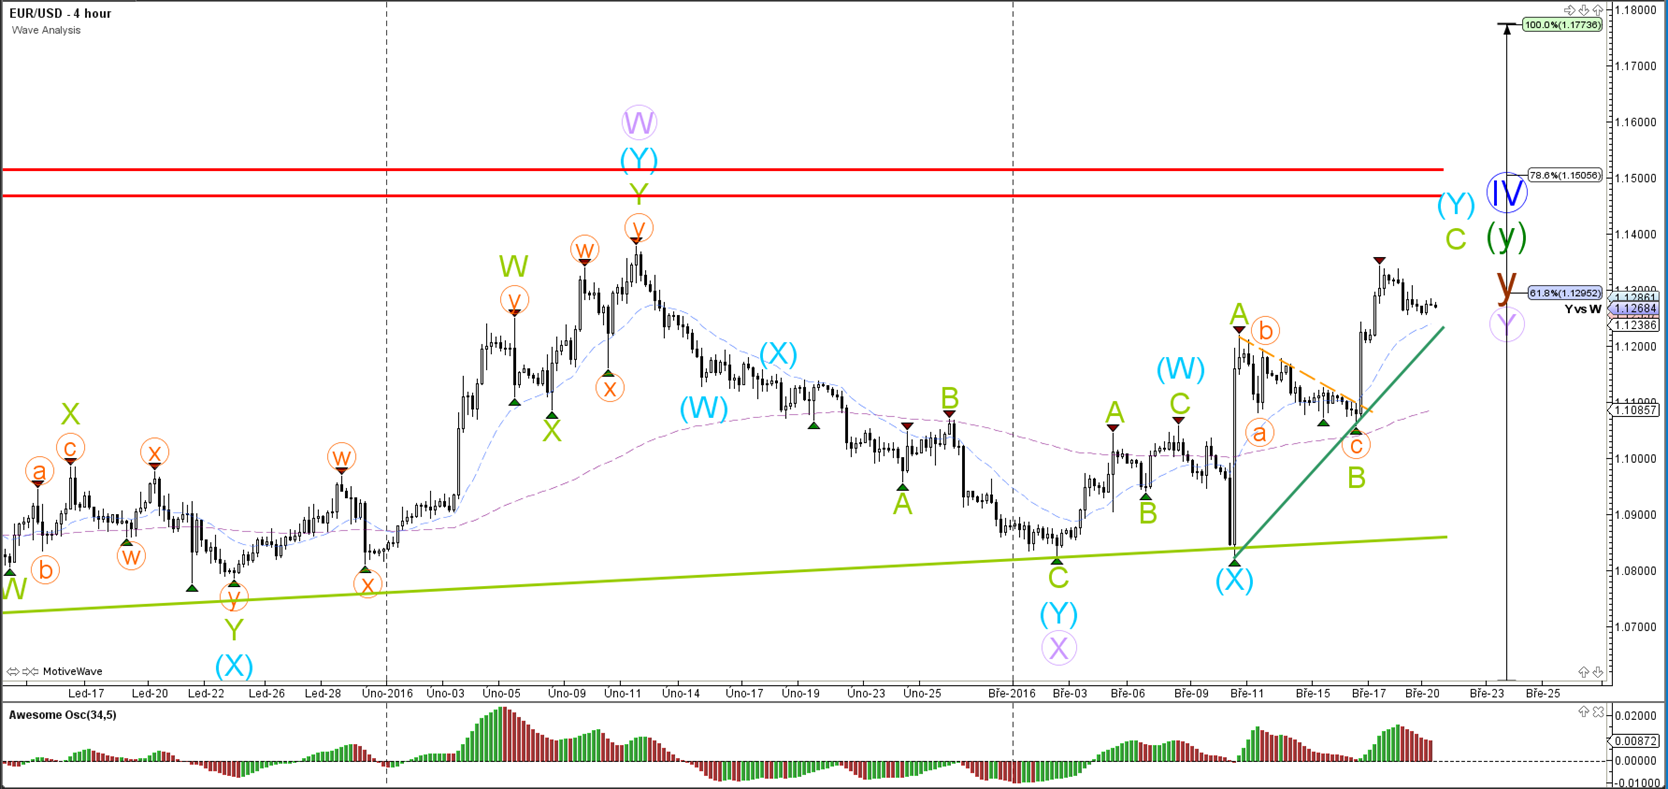
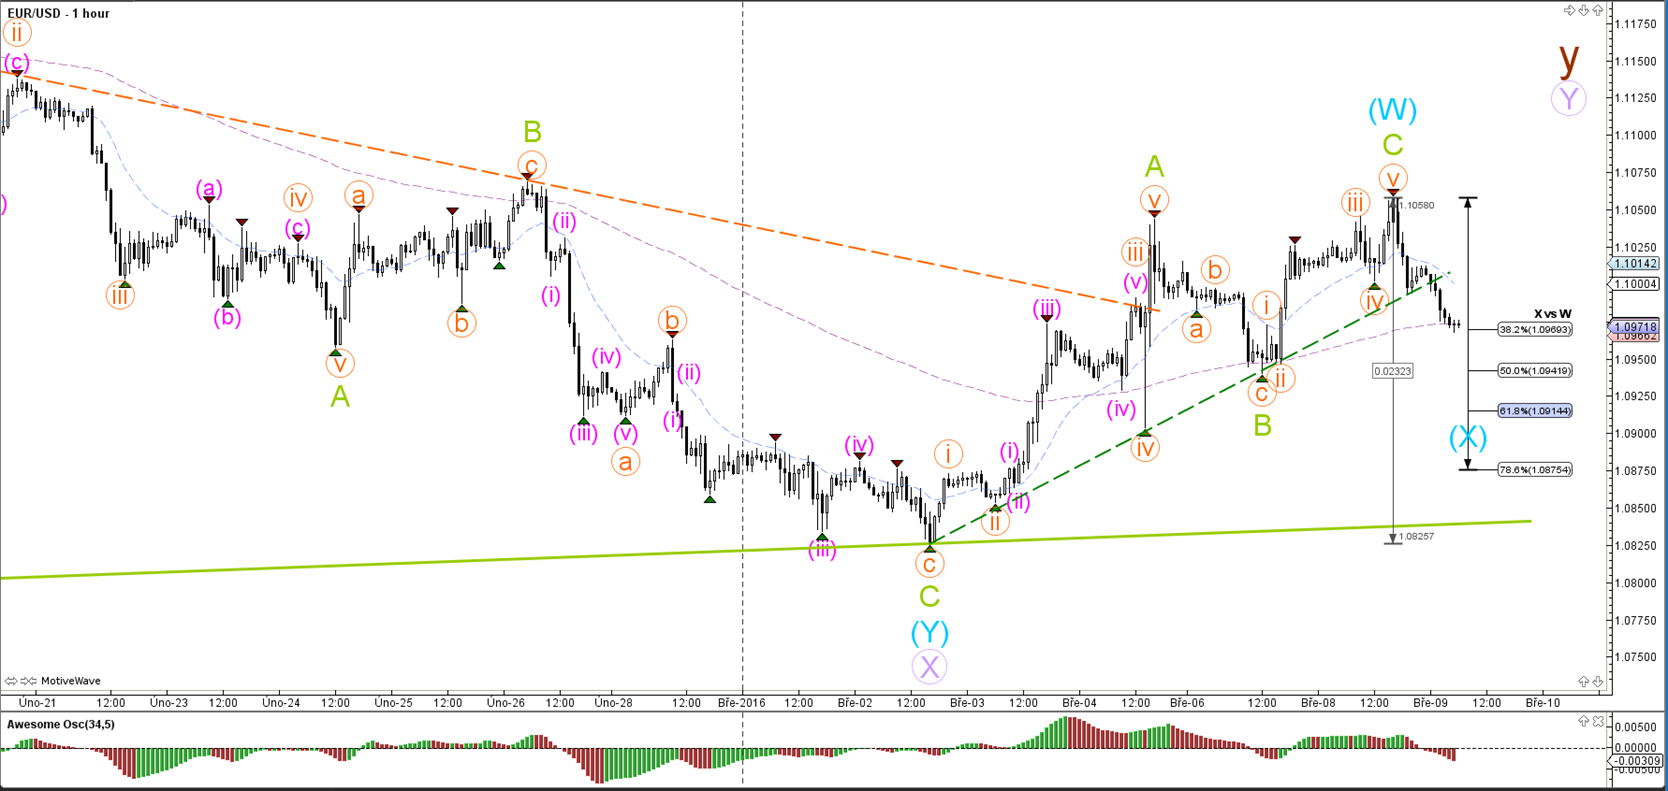
The EUR/USD completed a shallow ABC zigzag (green). Price has broken below the support trend line (dotted green) in the meantime. For the moment it seems most likely that price will bounce at one of the Fibonacci levels as part of wave X (blue) for a corrective expansion towards Waves Y.
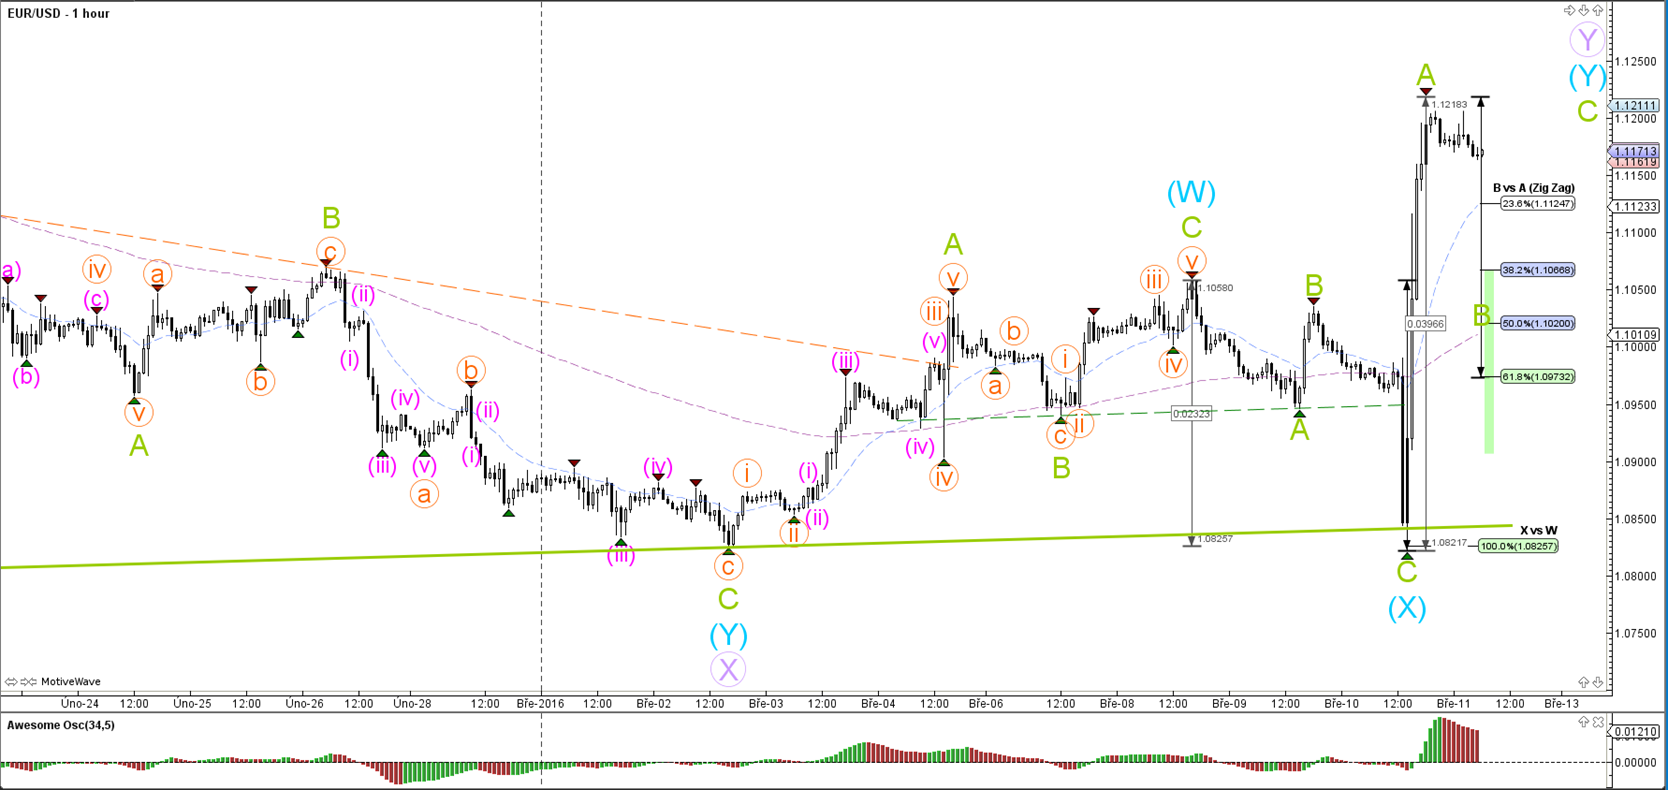
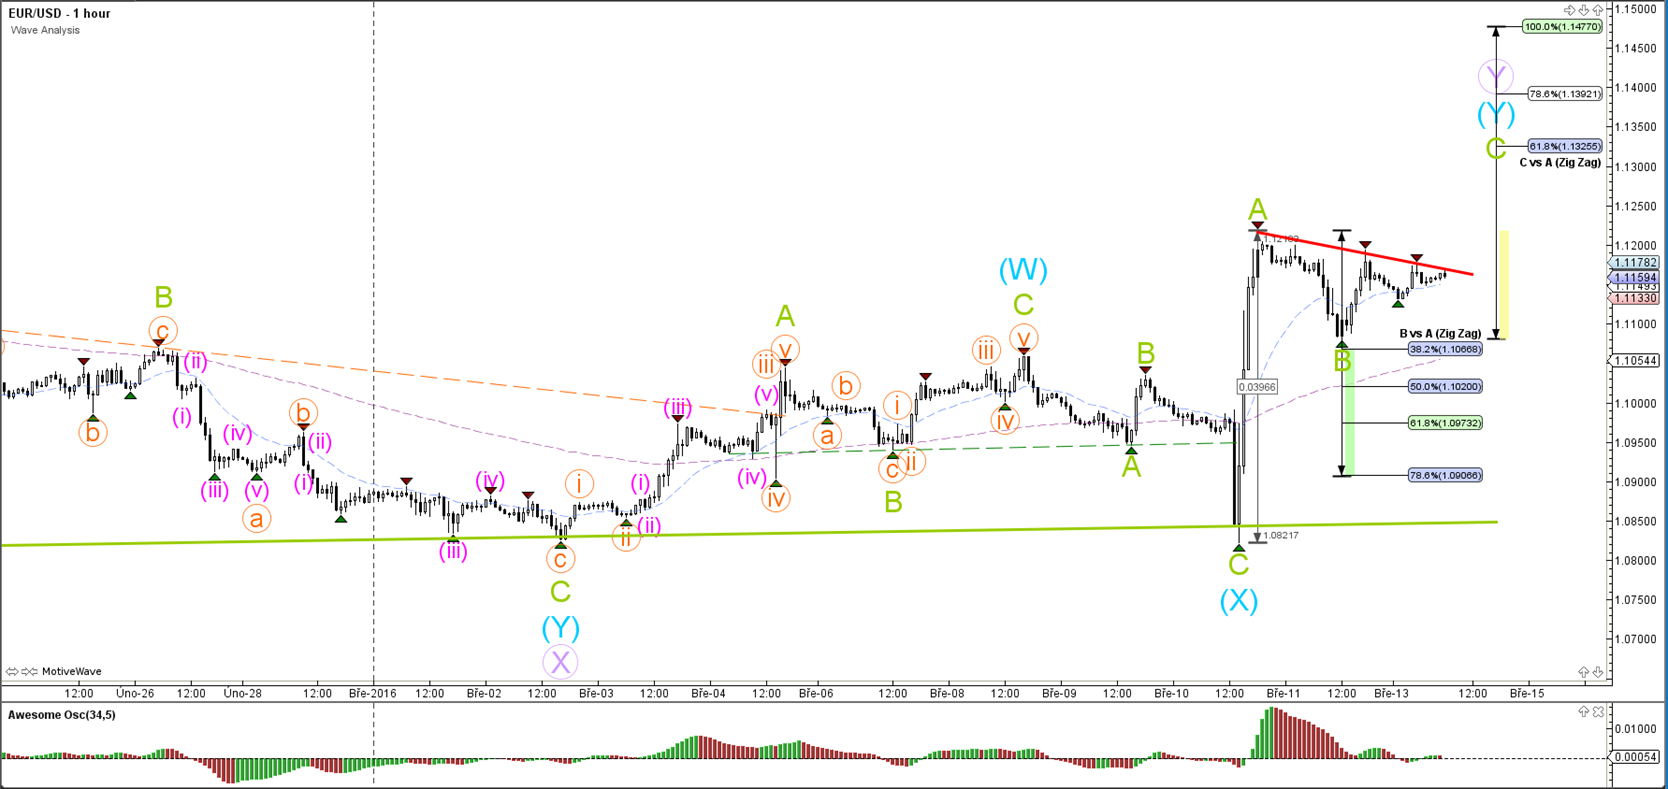
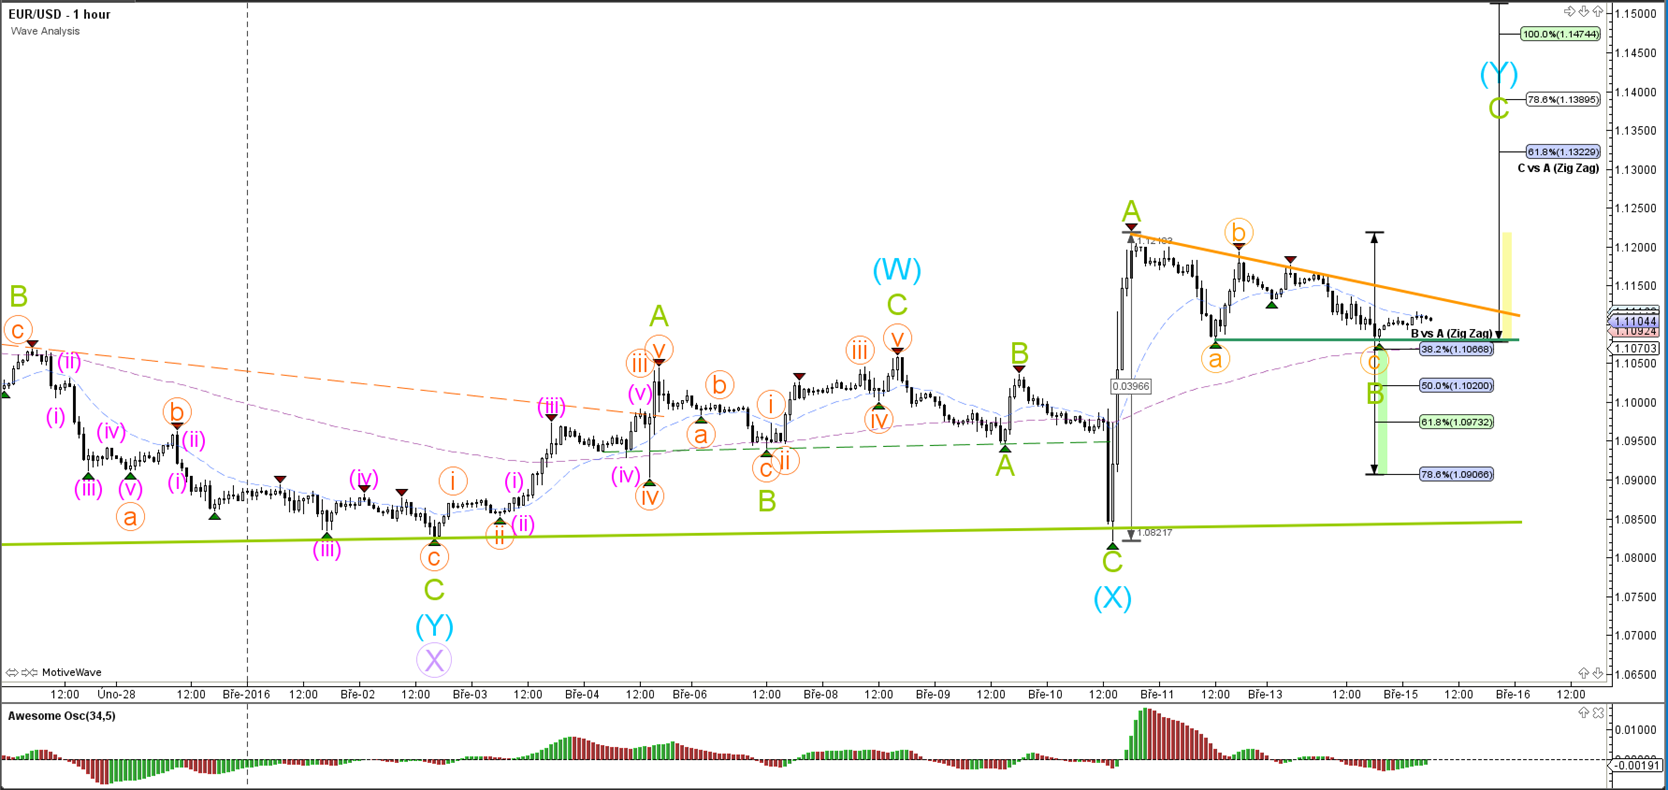
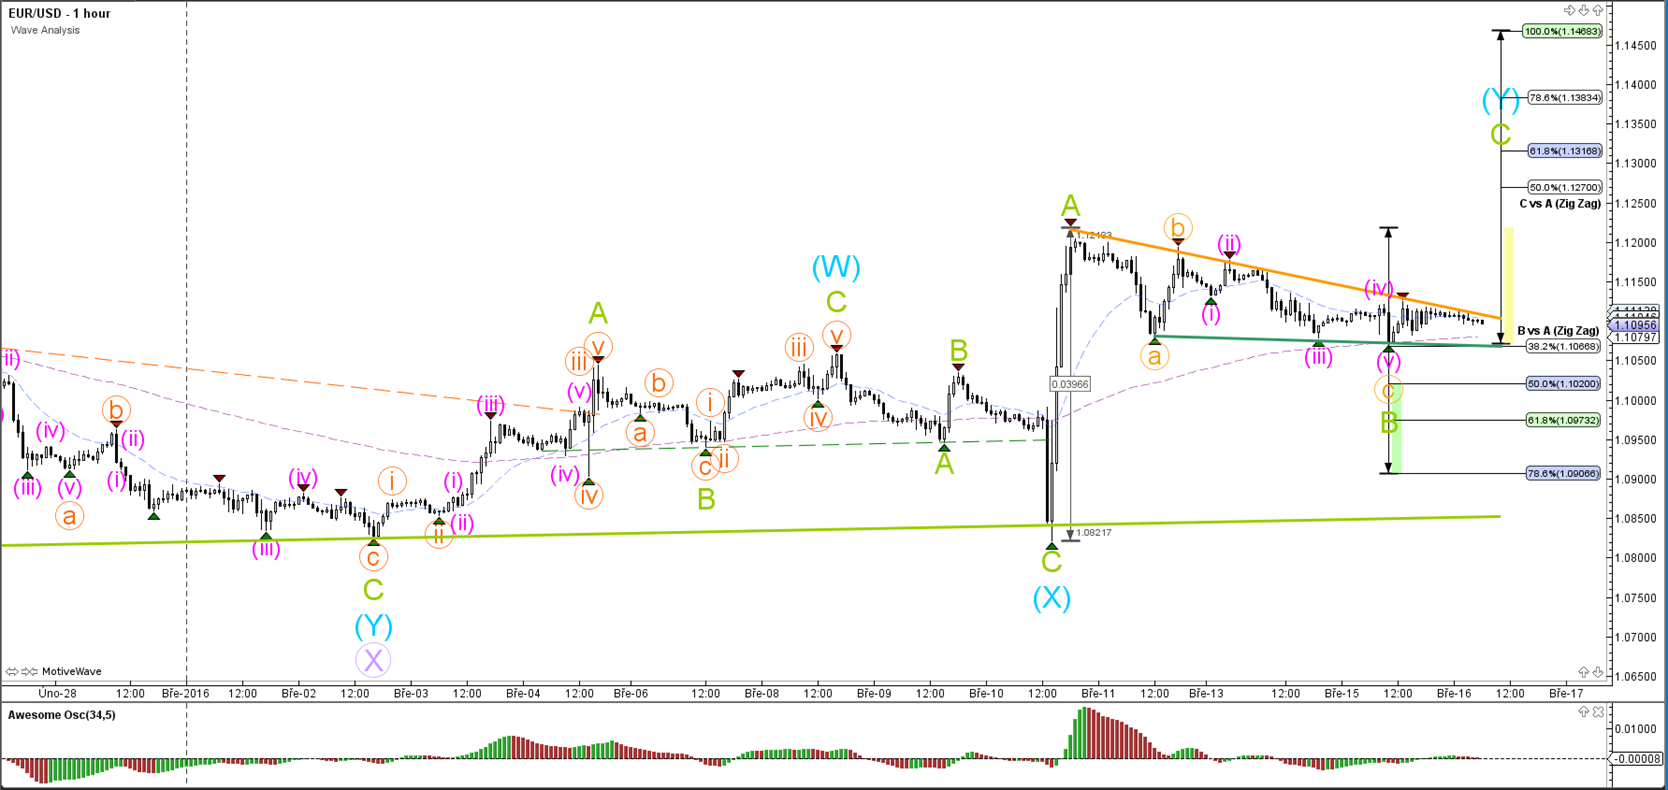
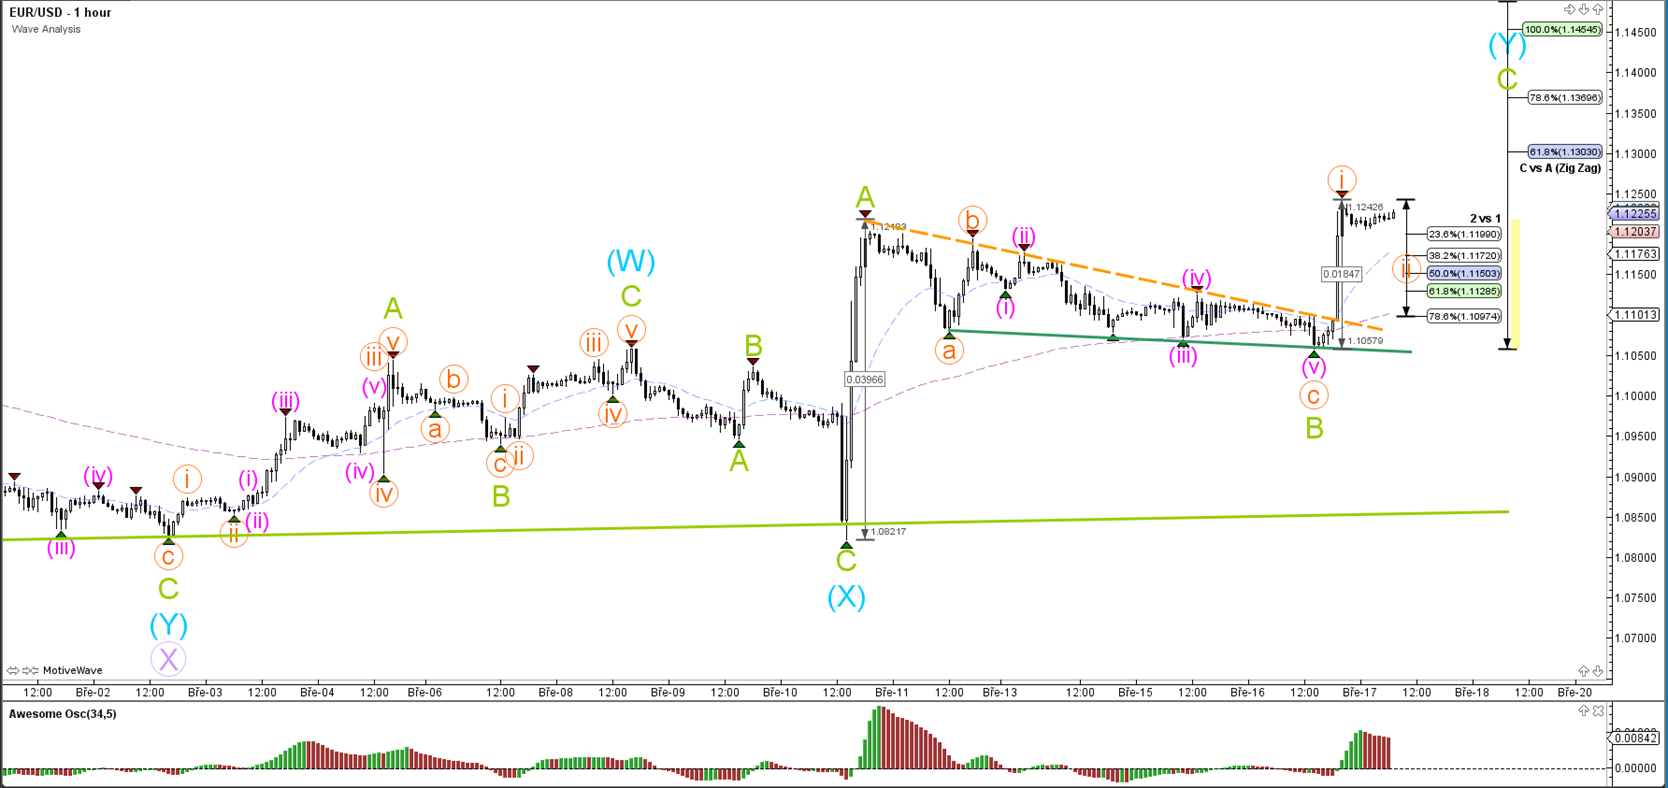
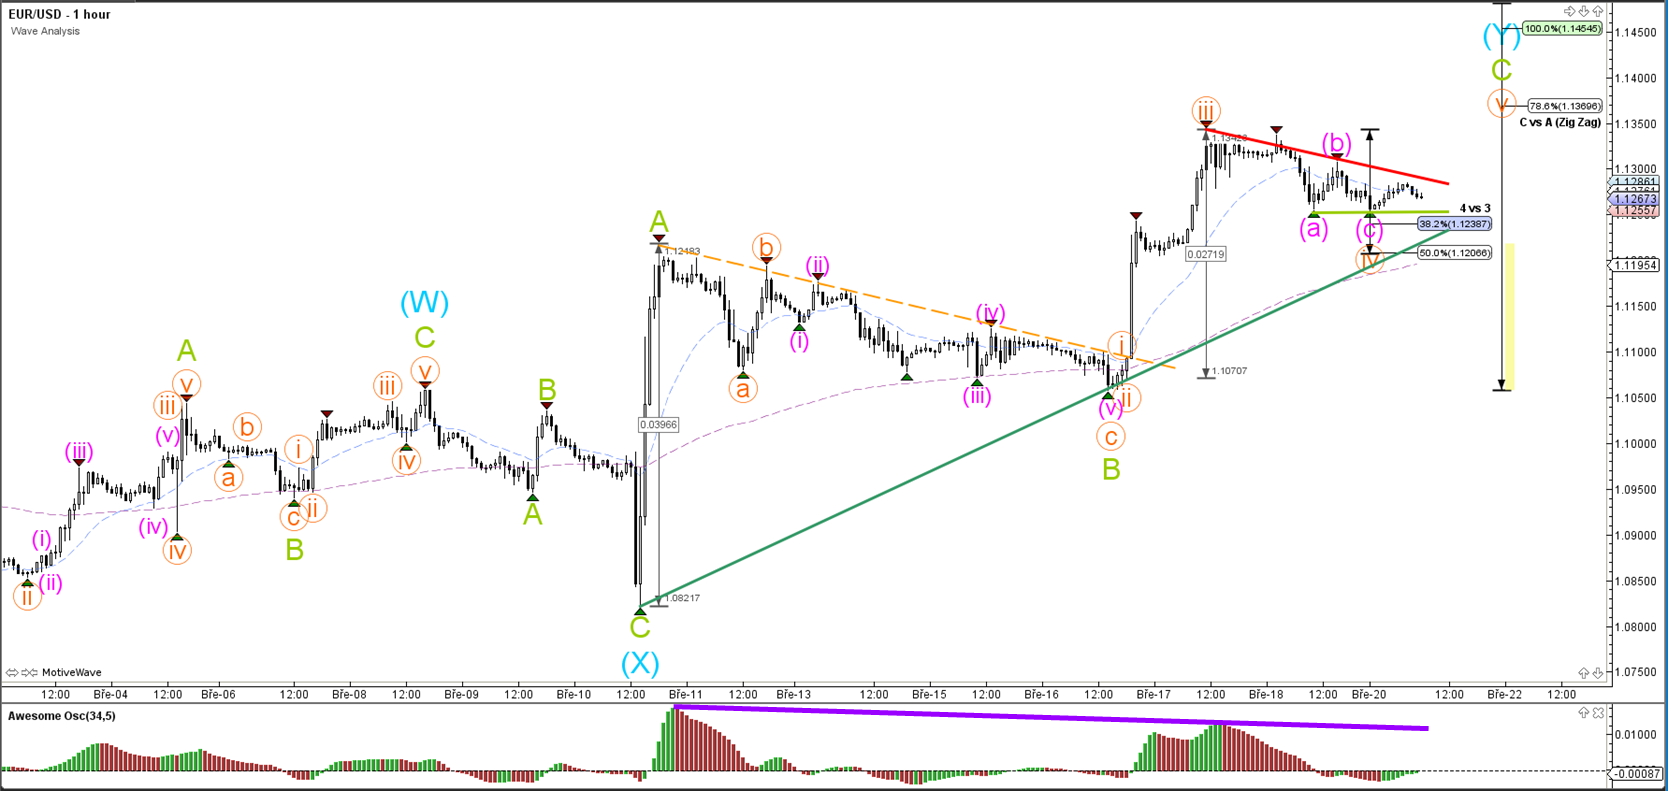
1 hour

A break below the light green line invalidates the Wave X (blue).
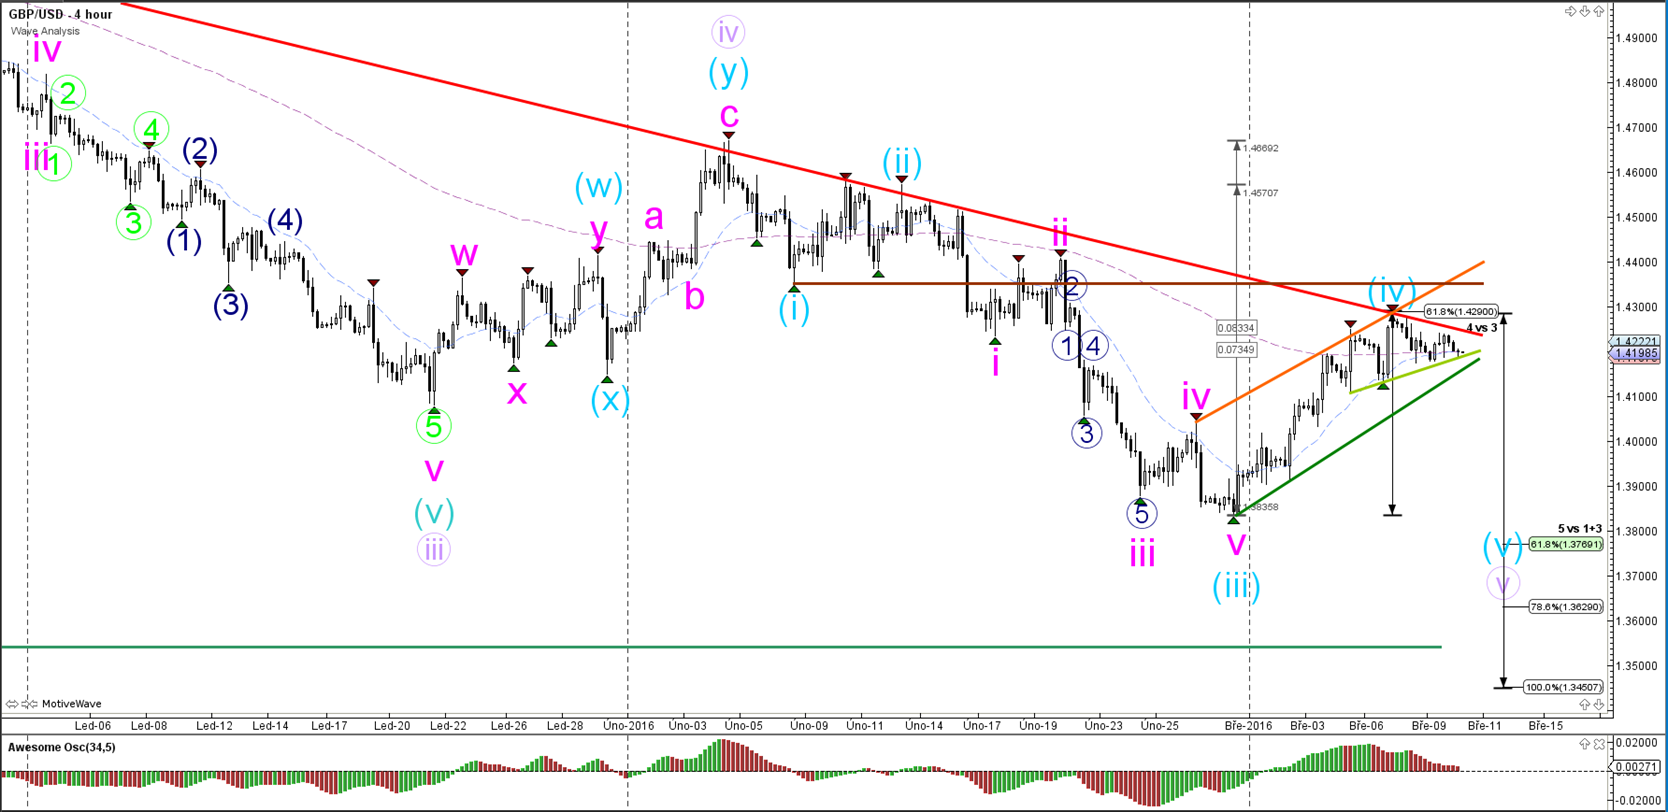
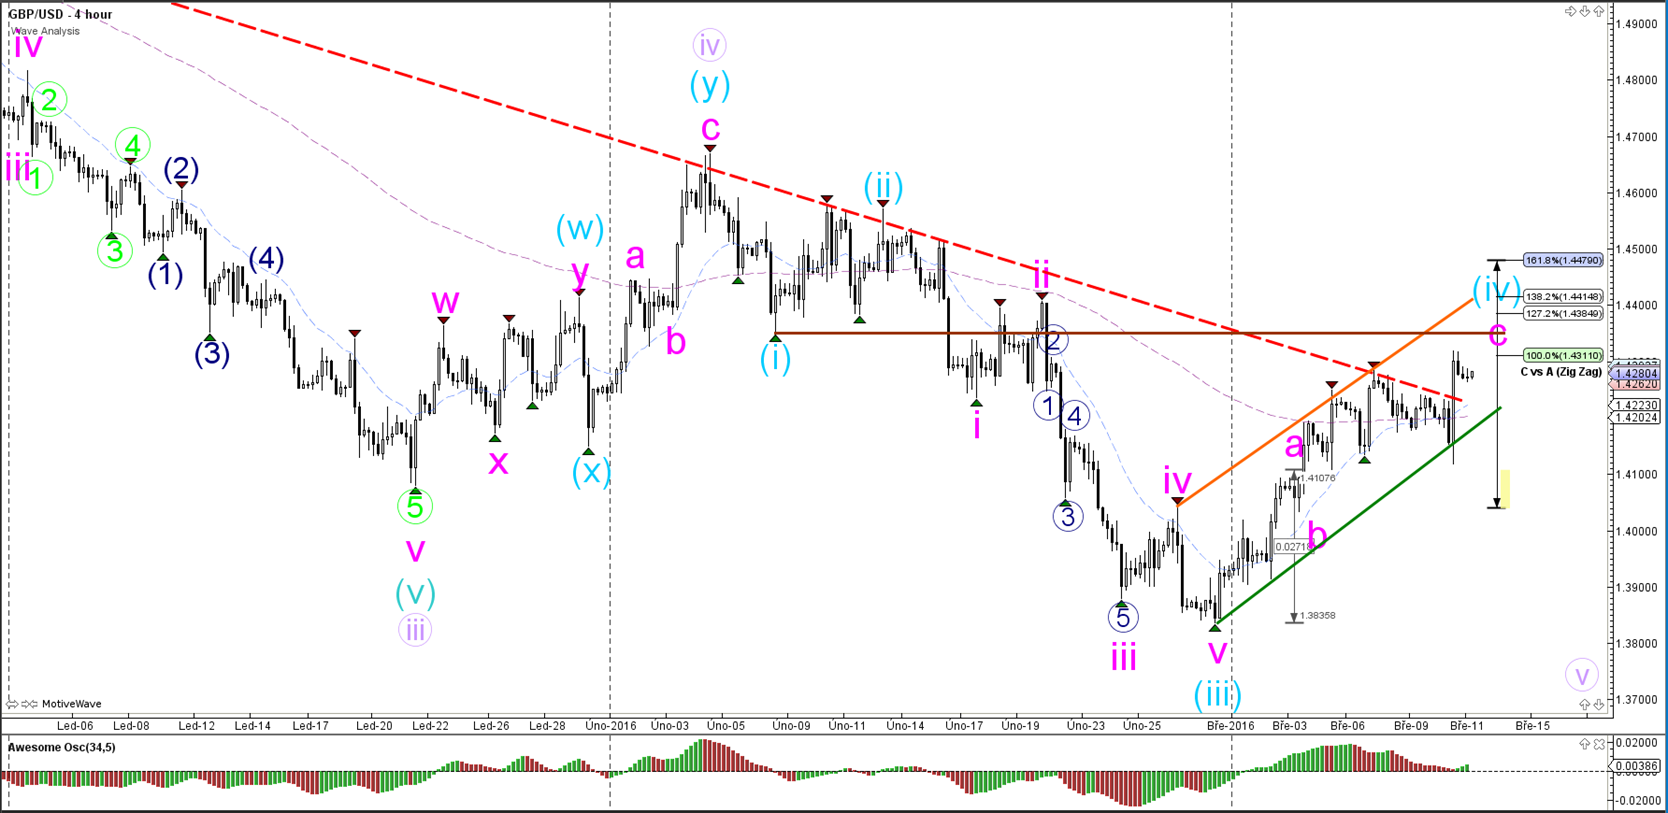
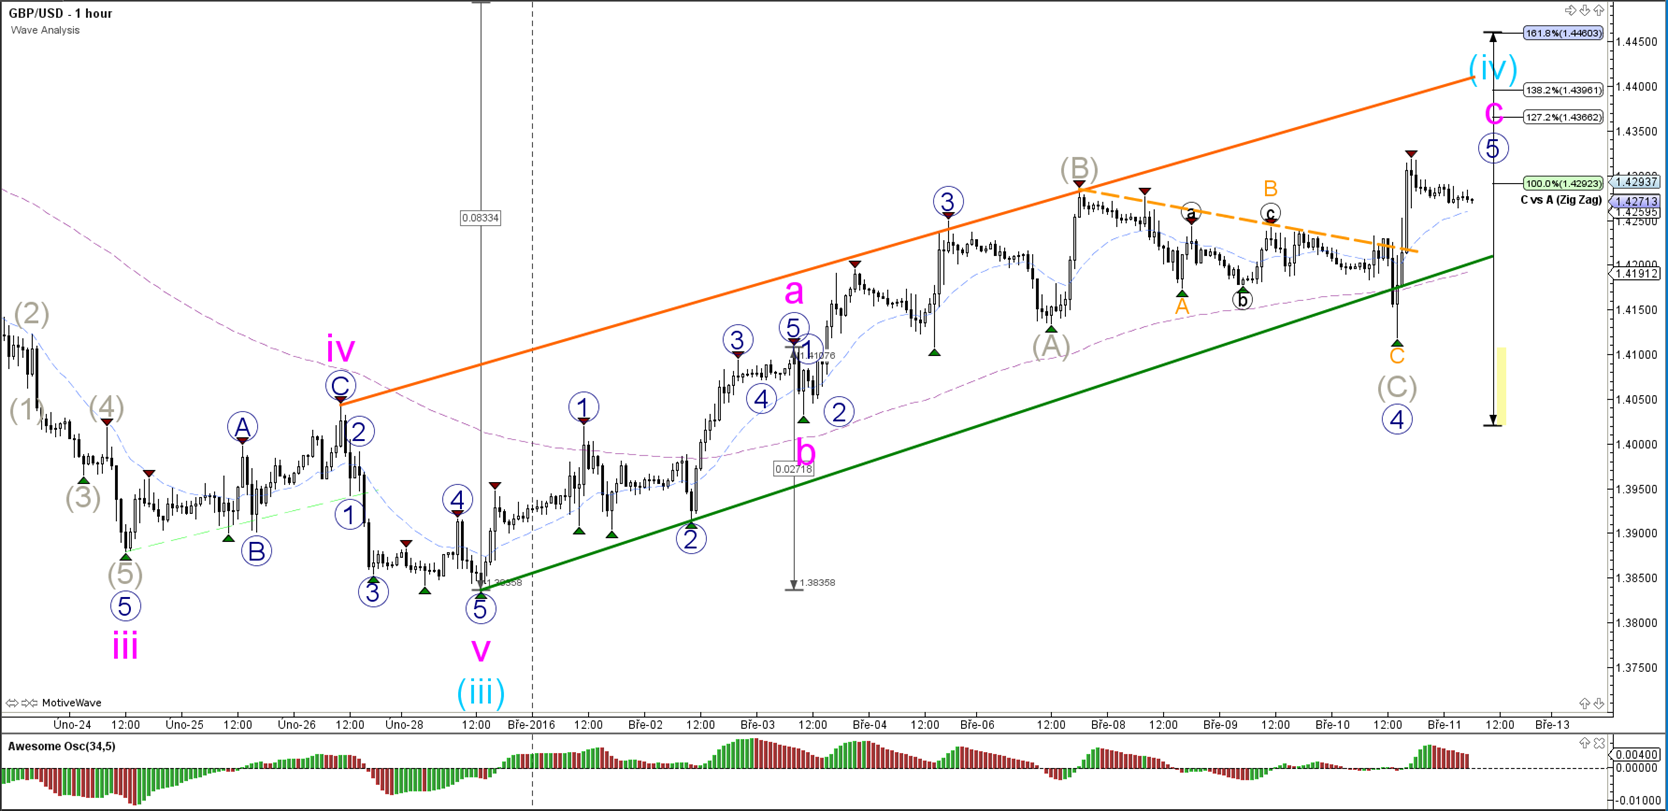
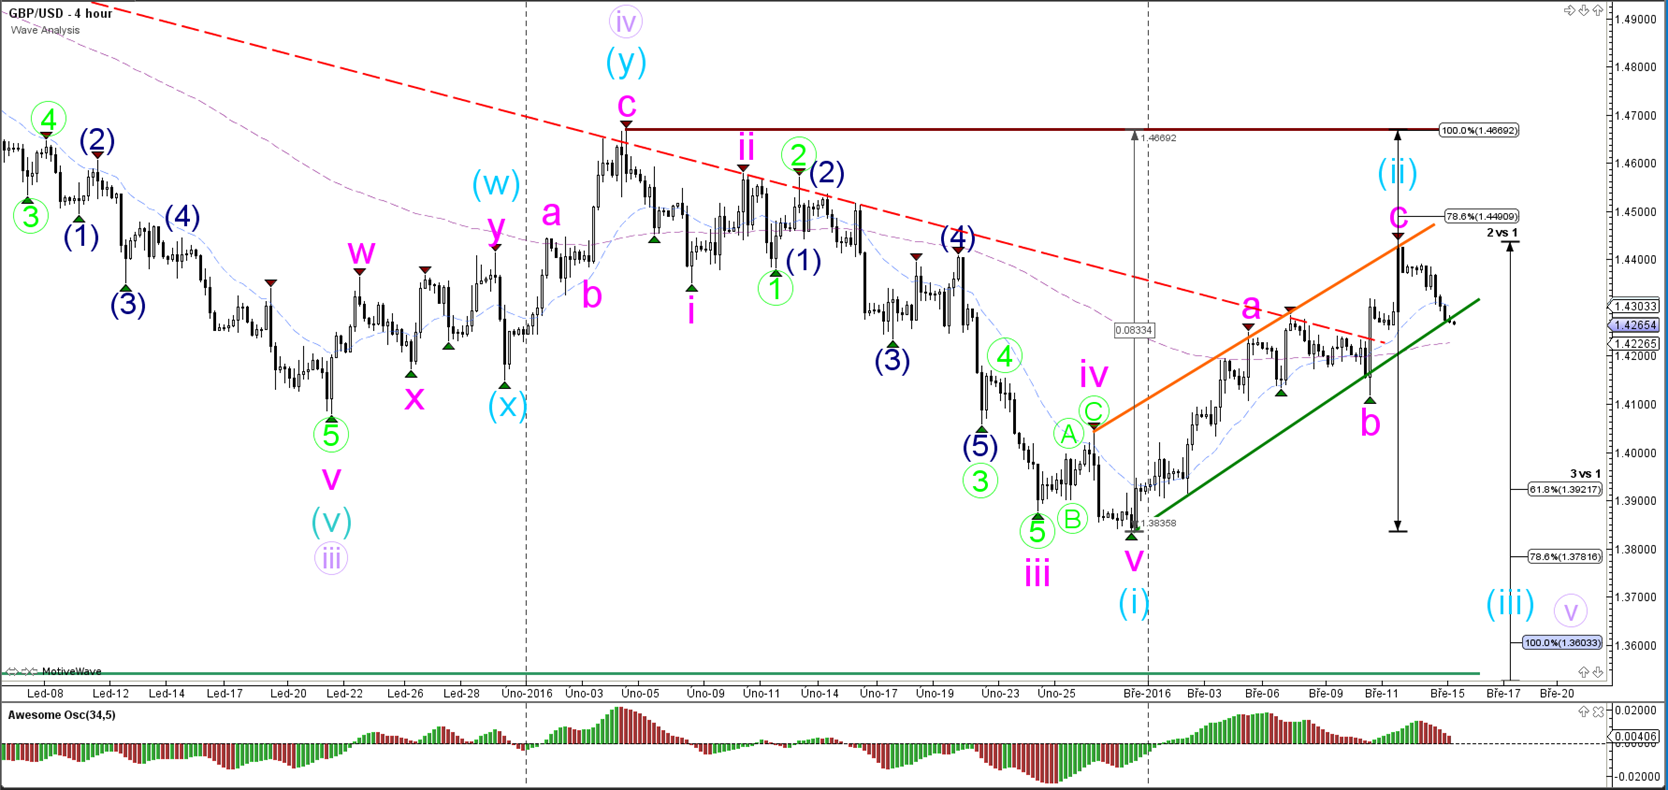
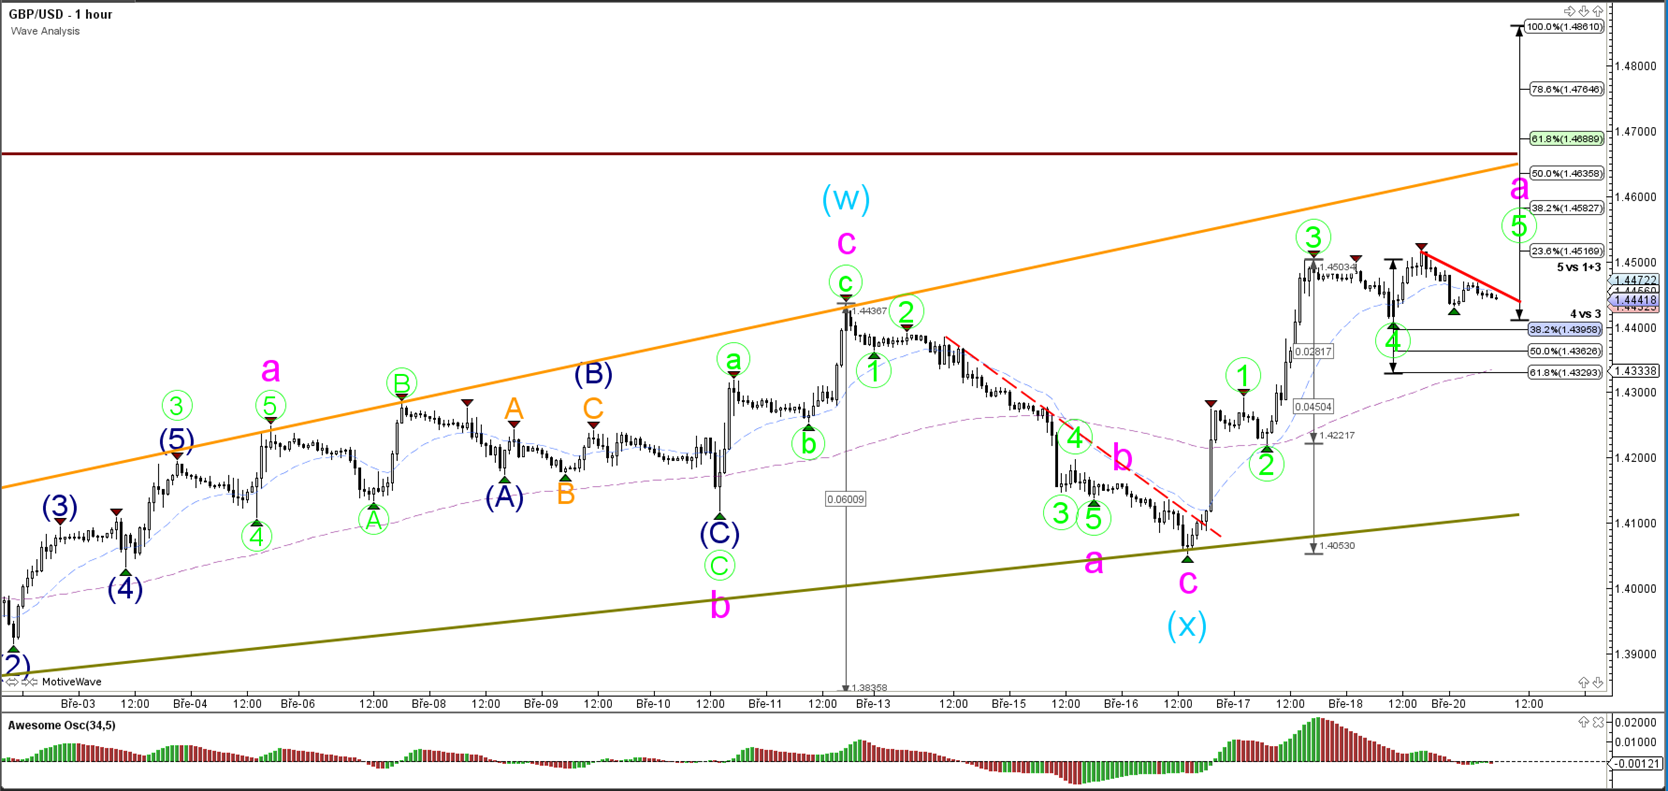
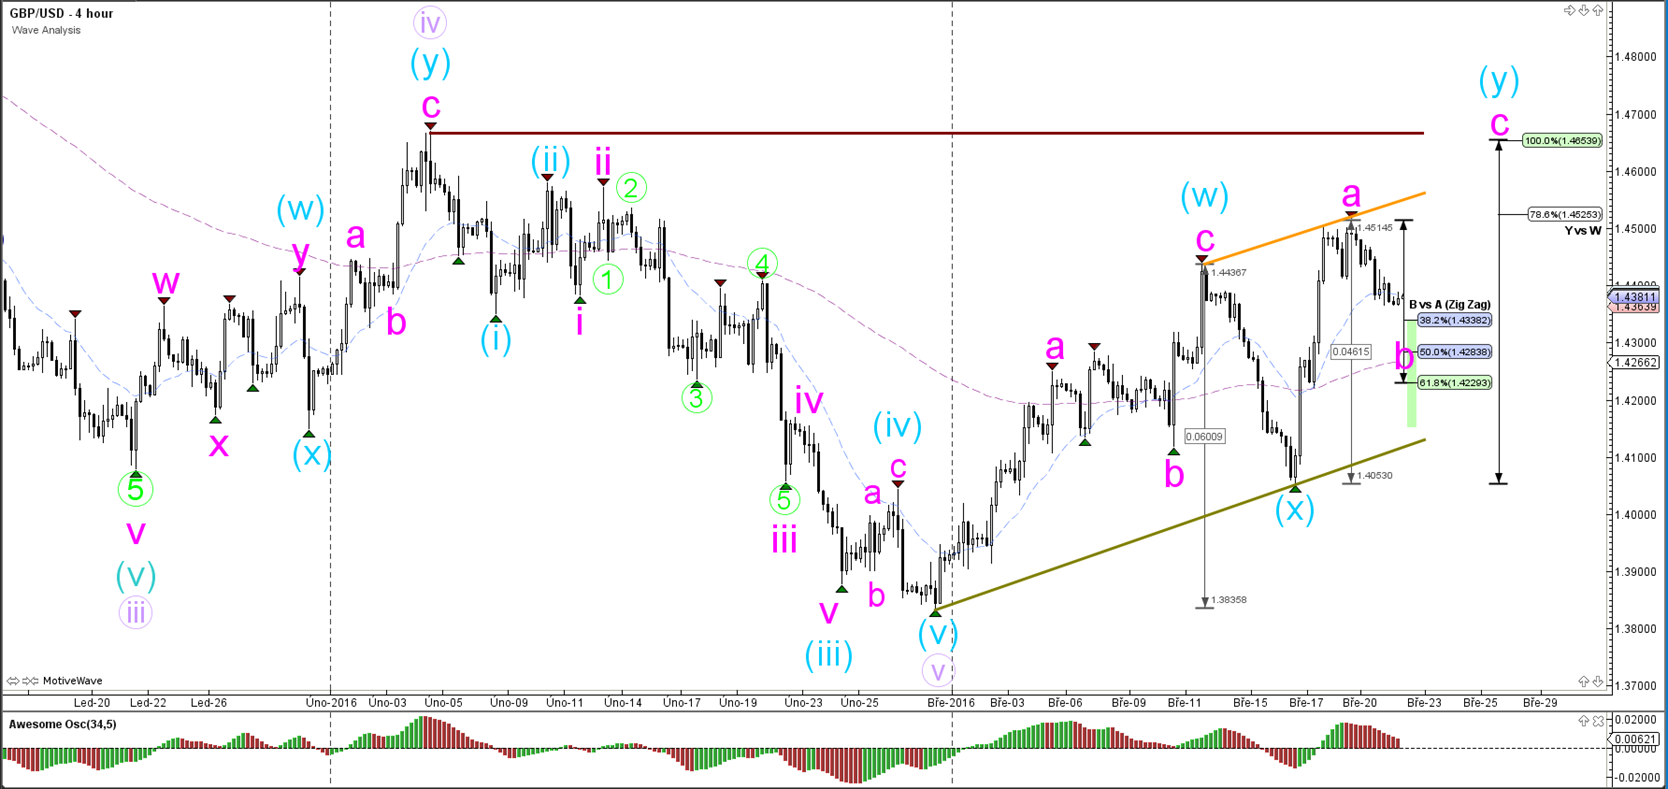
GBP/USD
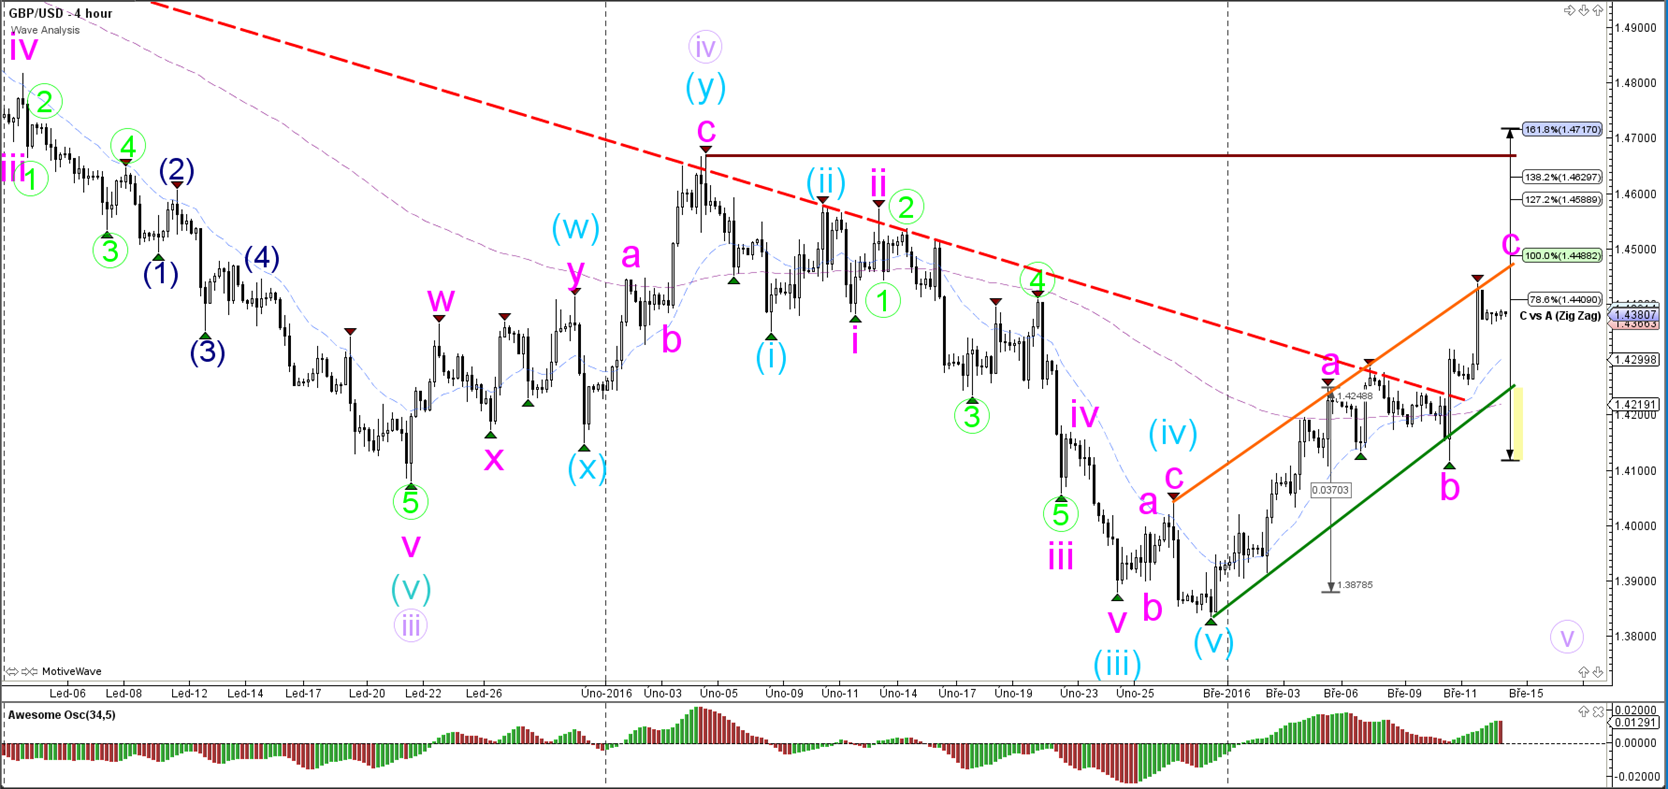
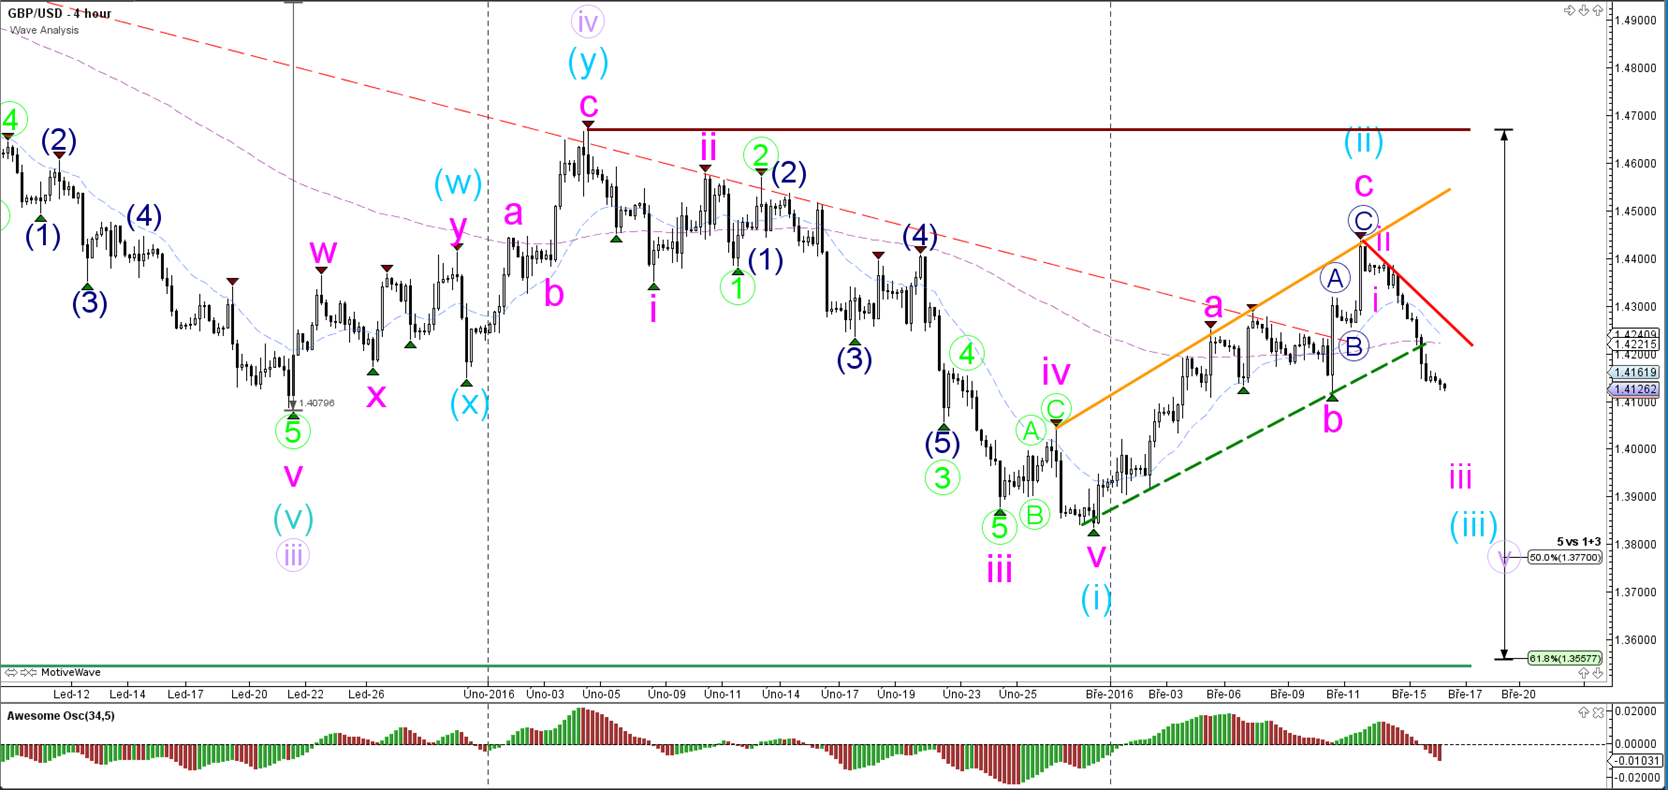
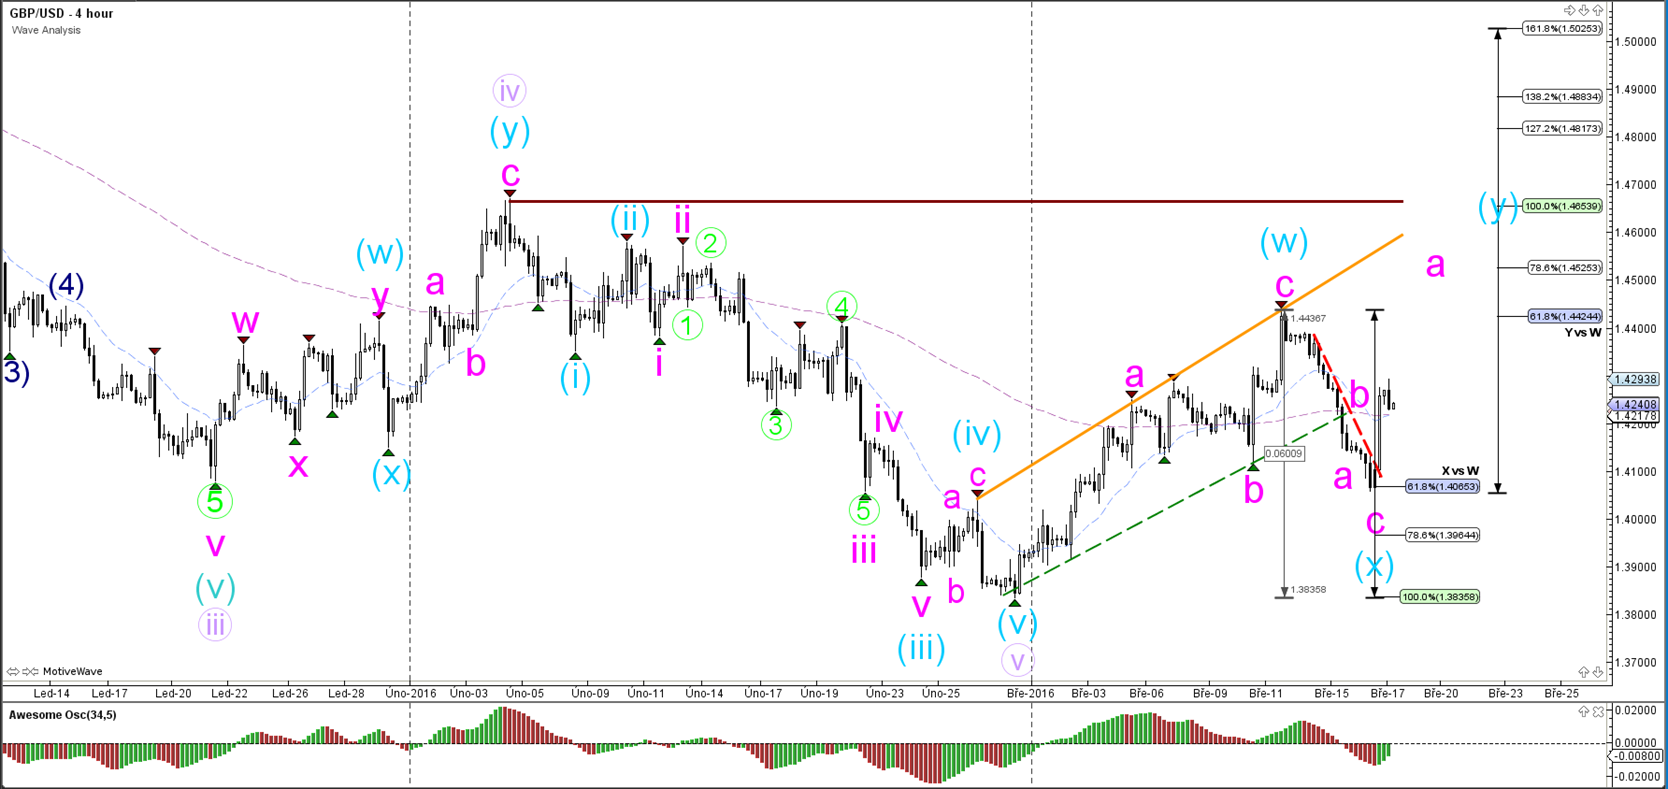
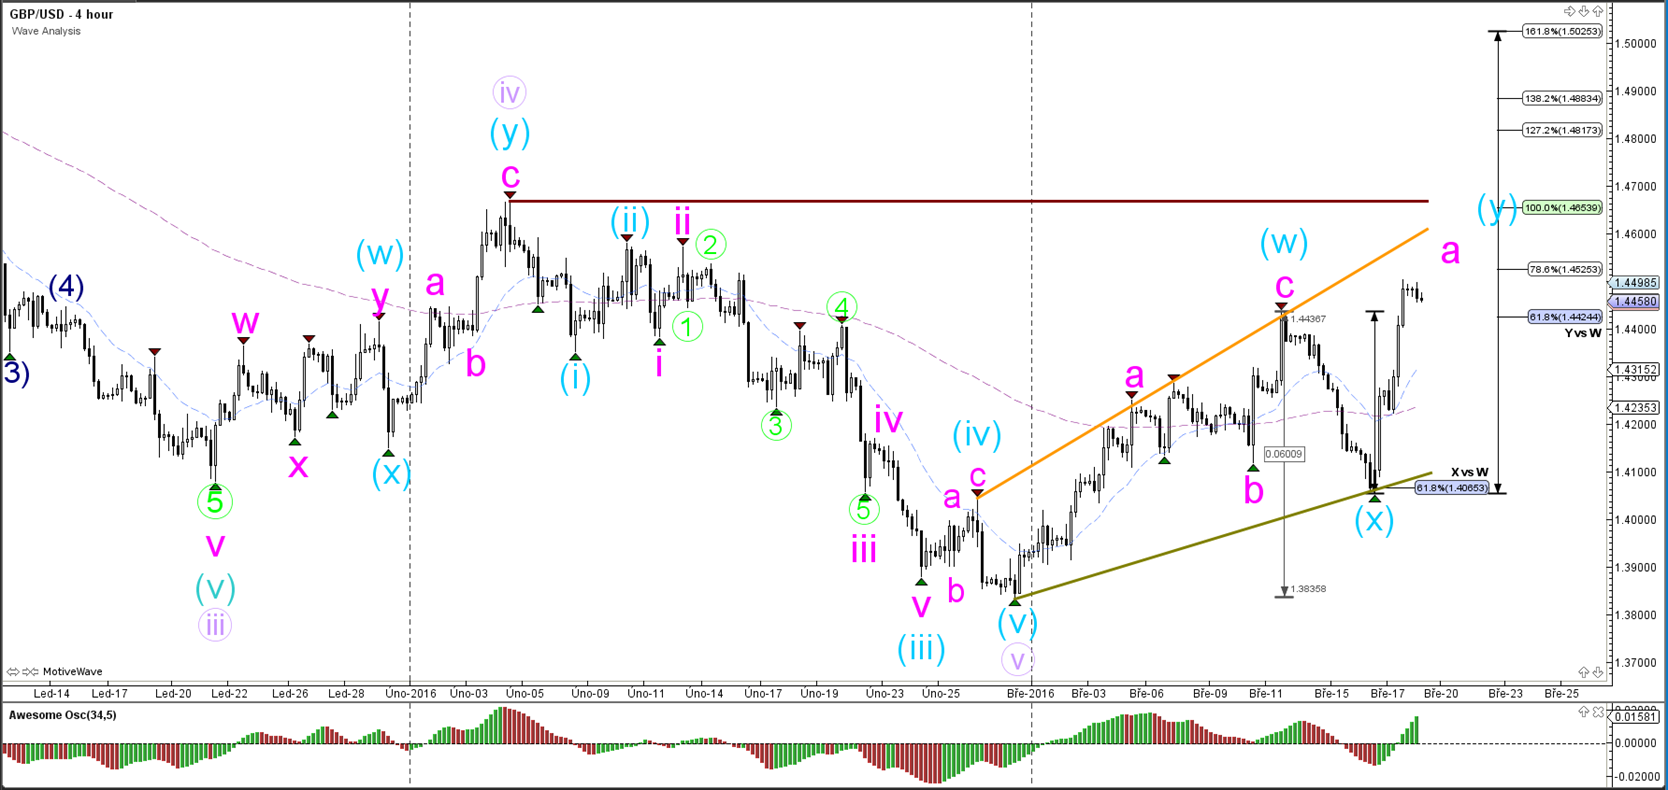
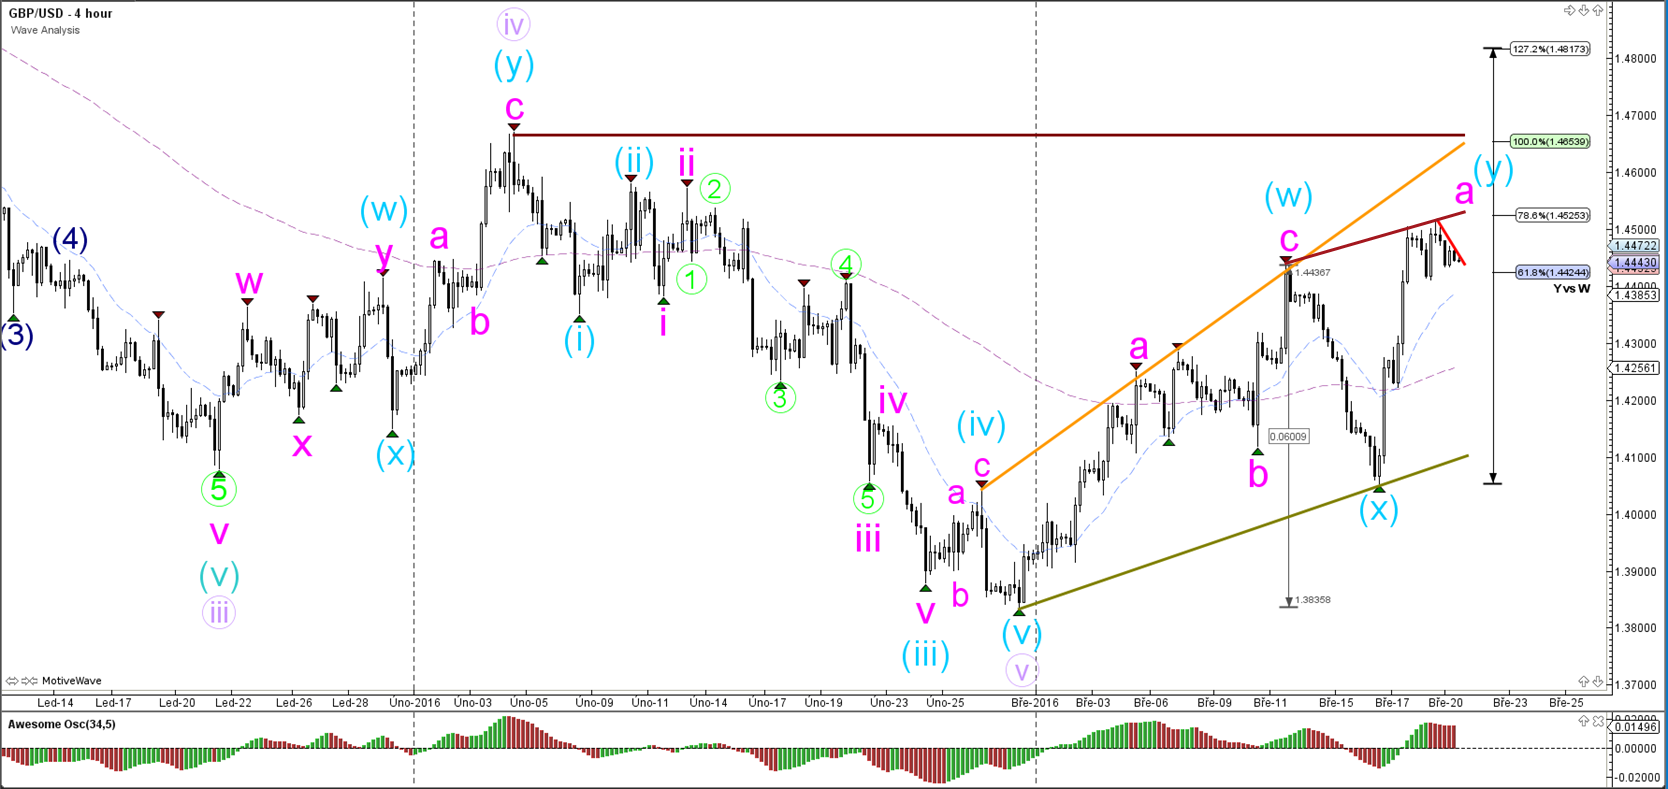
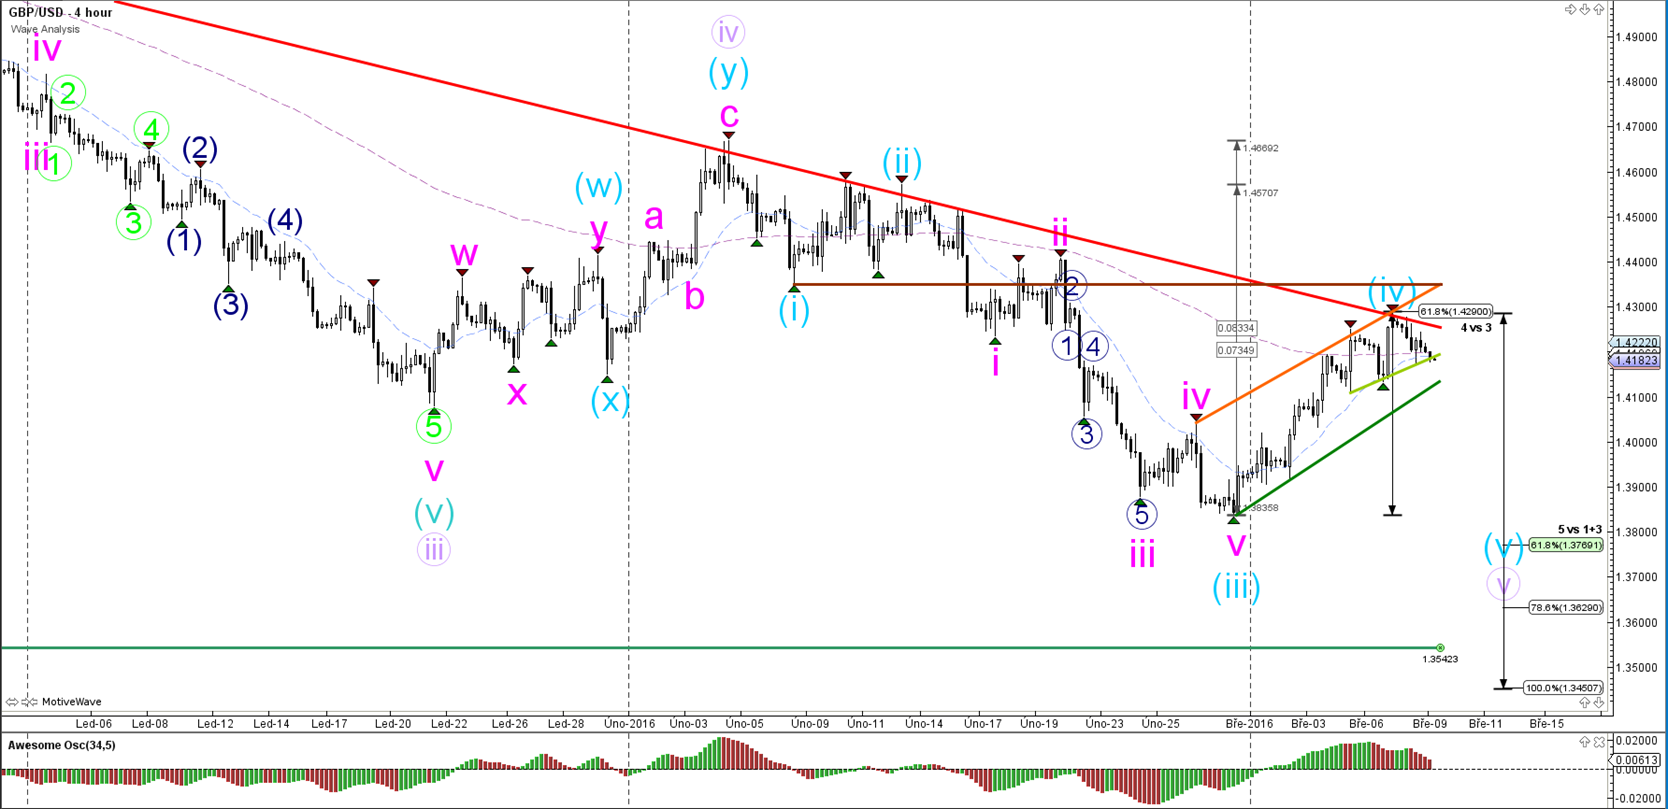
4 hour

The GBP/USD respected a confluence of resistance such as the trend line (red) and 61.8% Fib and made a bearish turn. A break below the support trend lines is needed before price can expect to start wave 5. A break above the brown horizontal line invalidates wave 4 (blue).
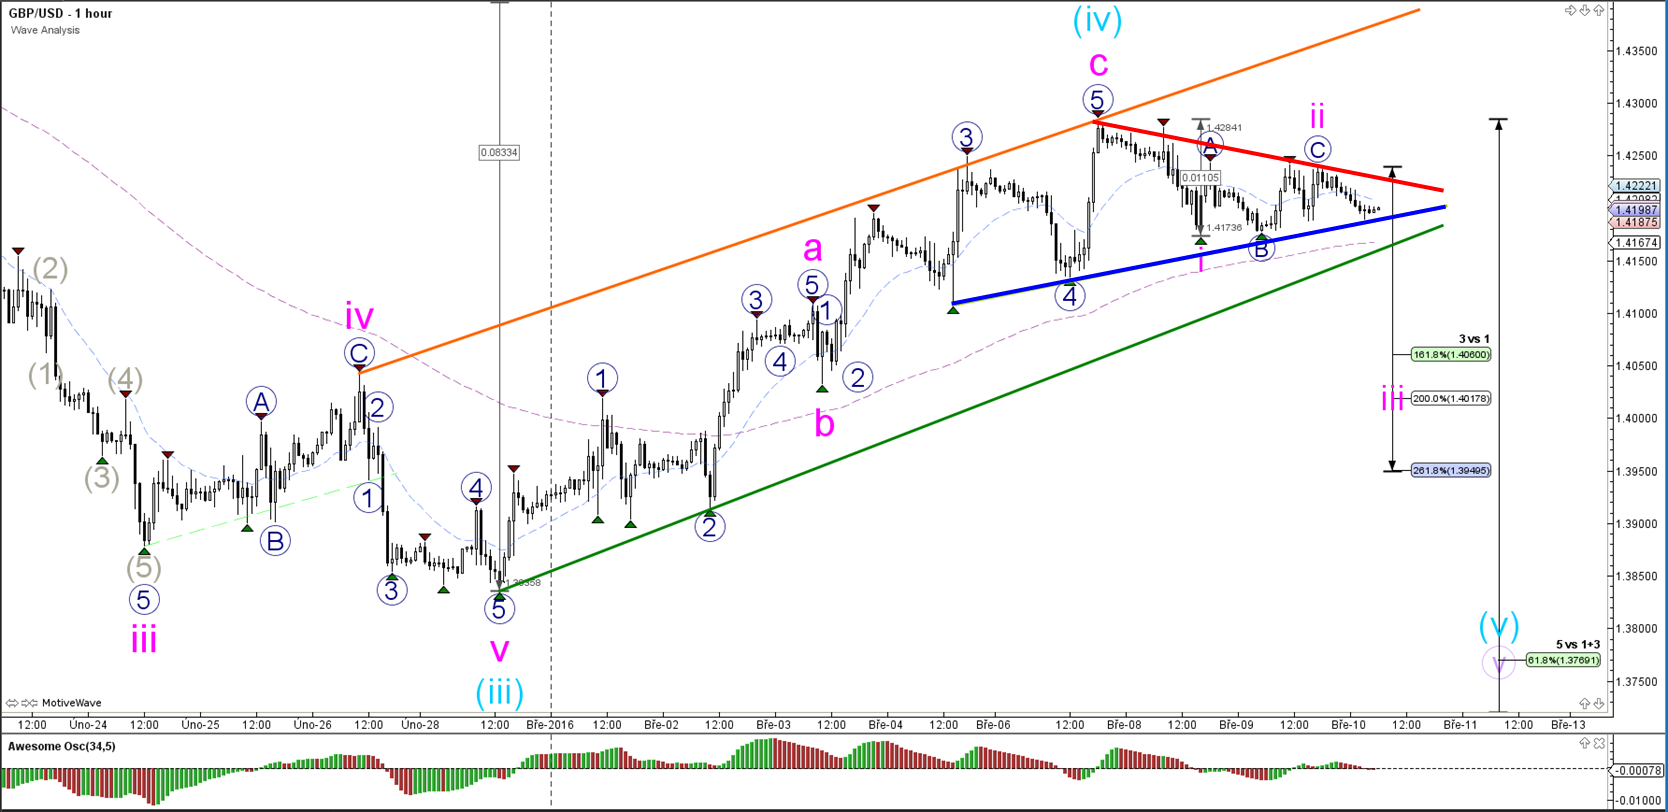
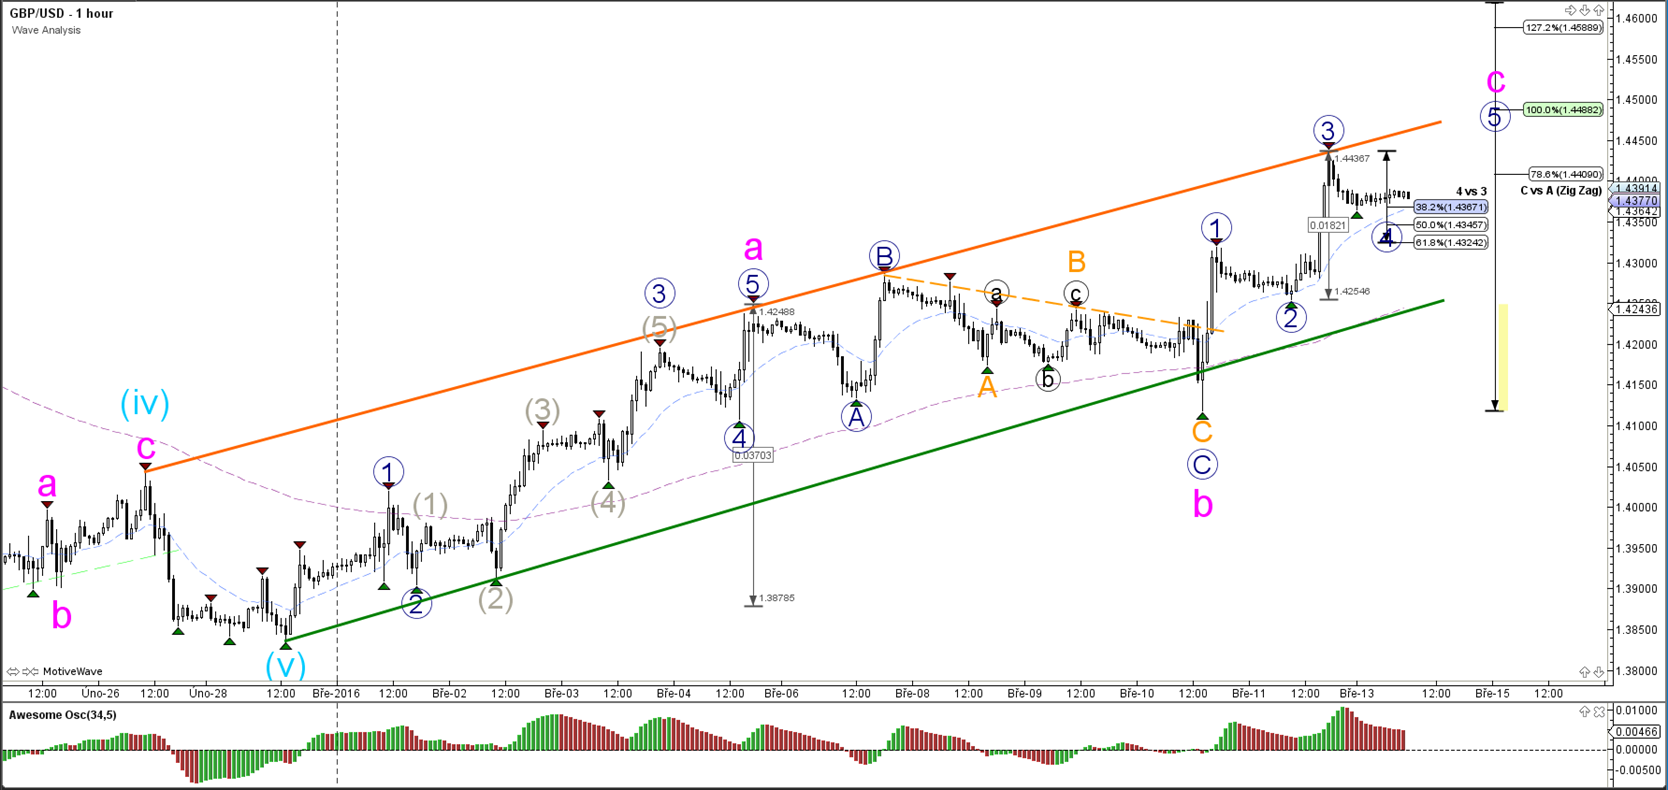
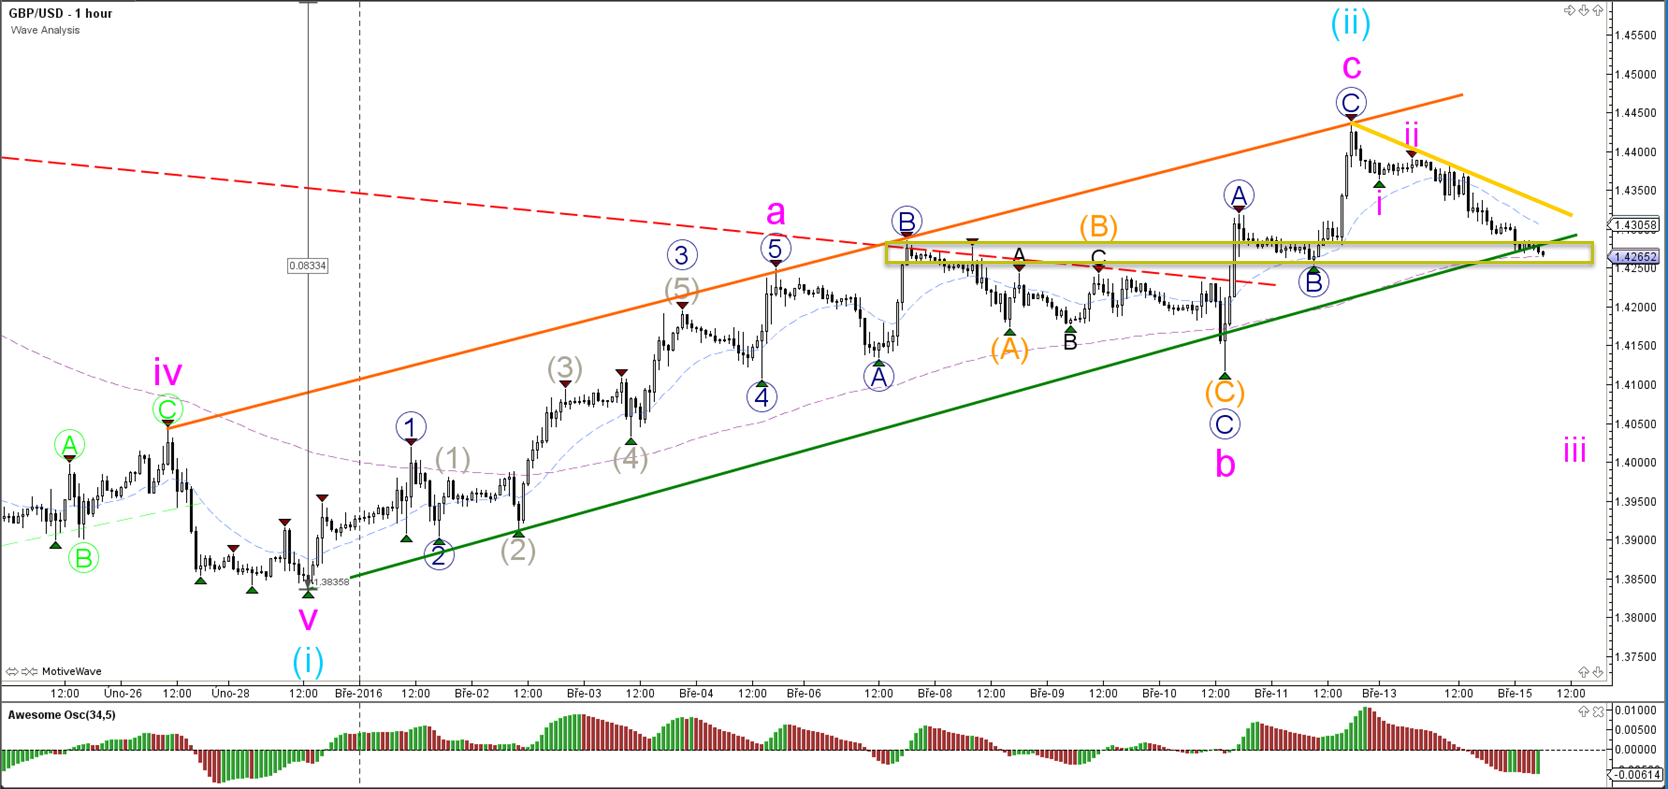
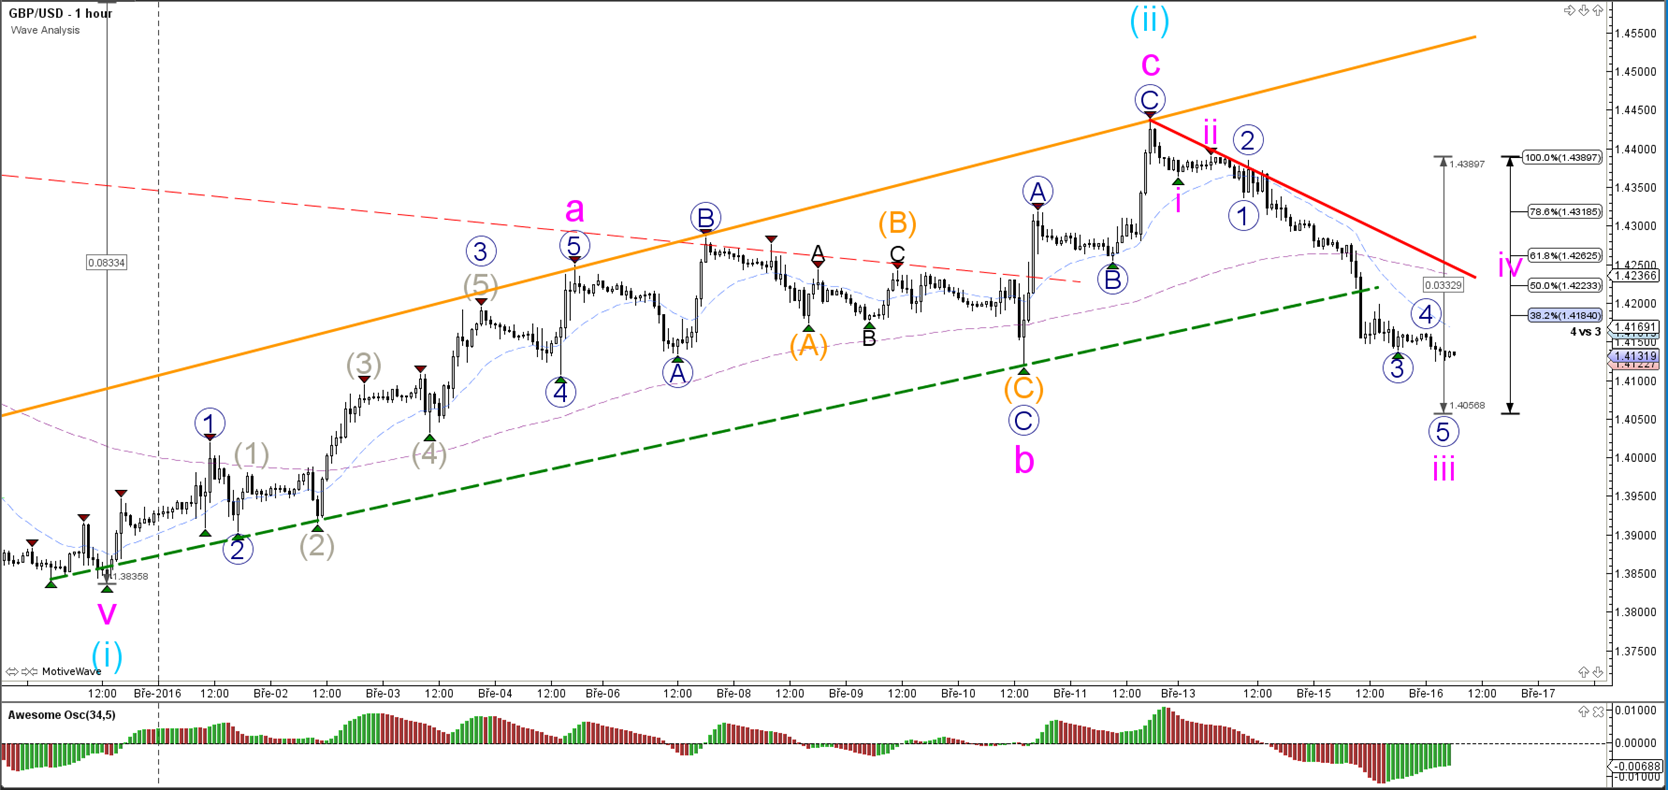
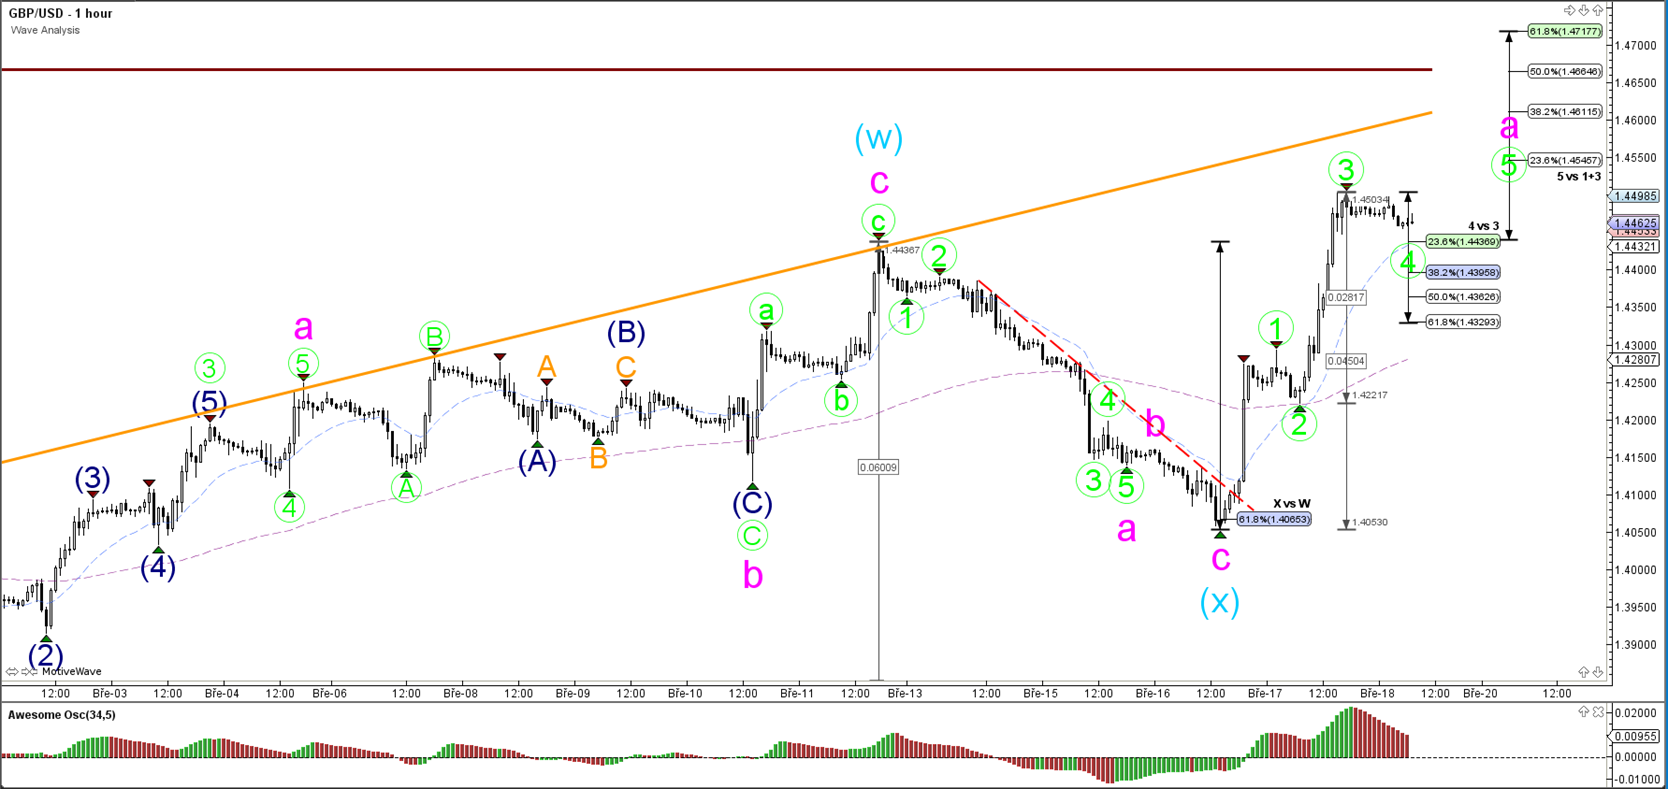
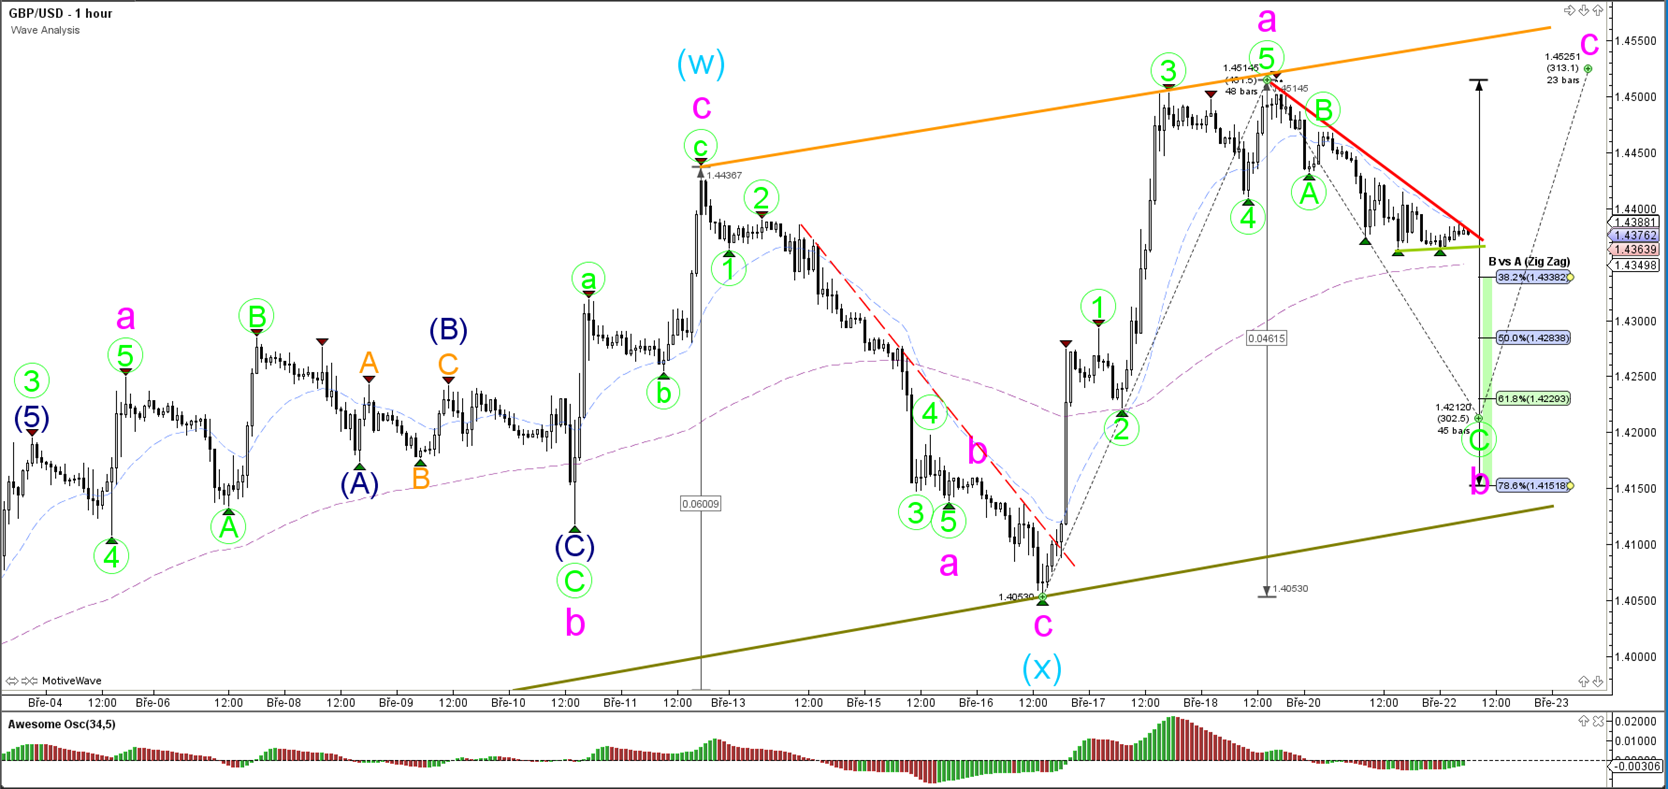
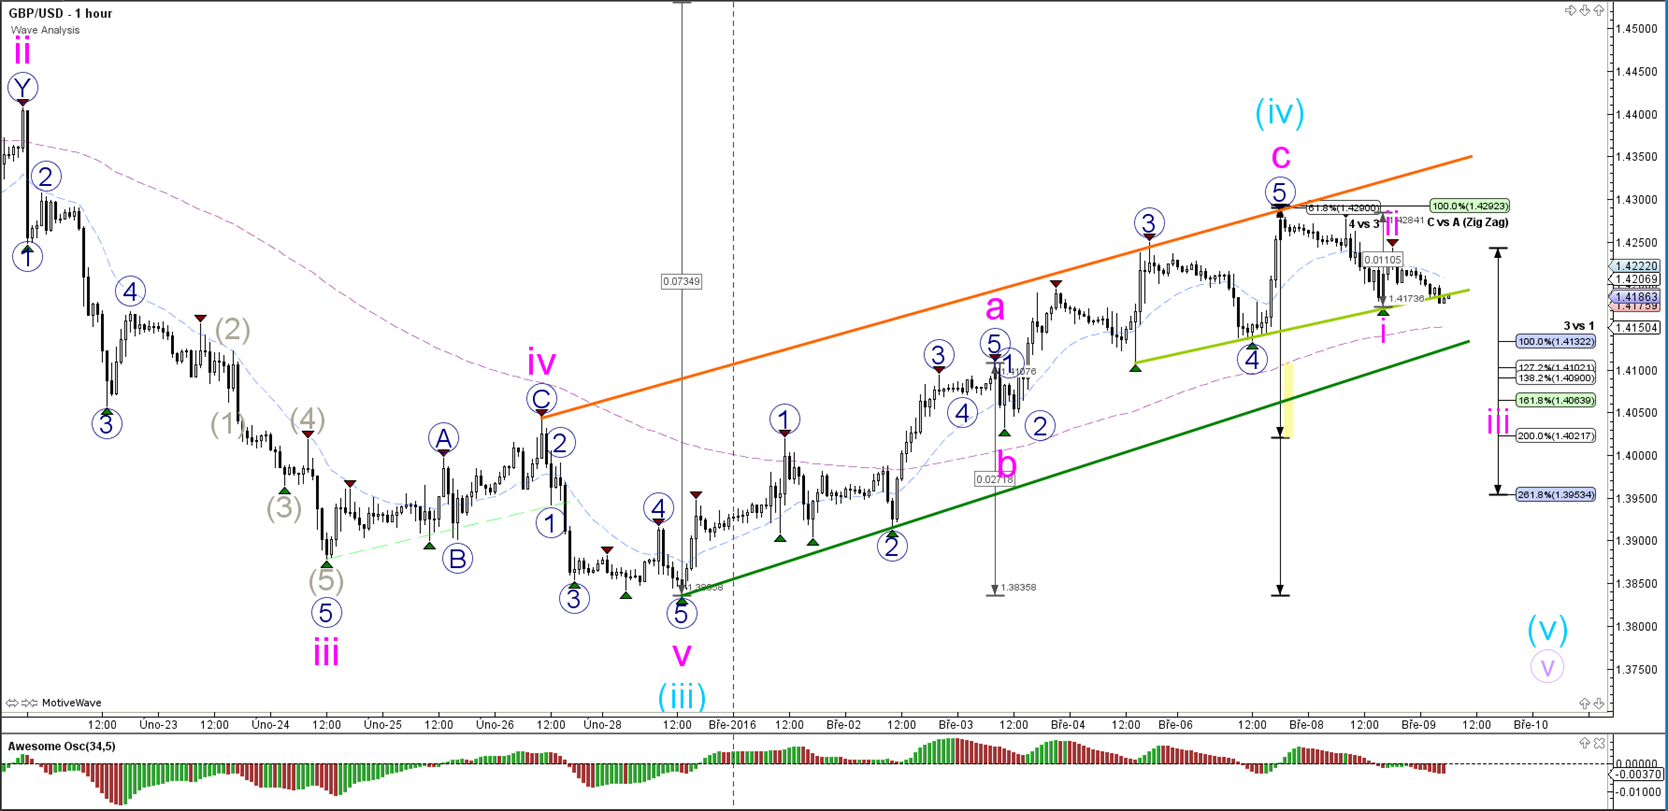
1 hour

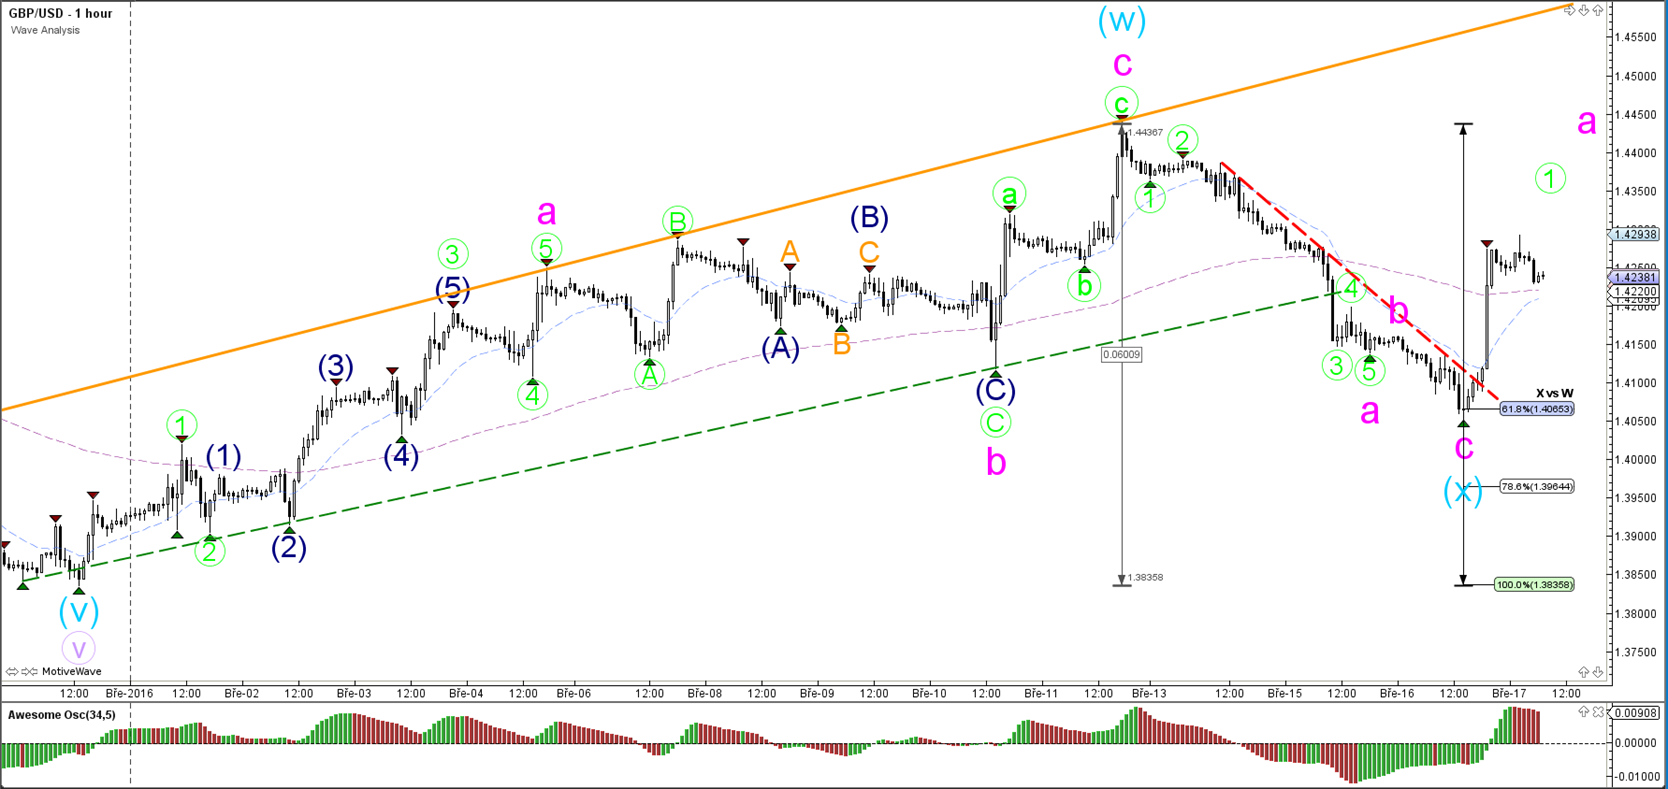
The GBP/USD could be starting a new bearish impulse (pink) with a wave 1-2 if it manages to stay below the previous top and eventually break below support.
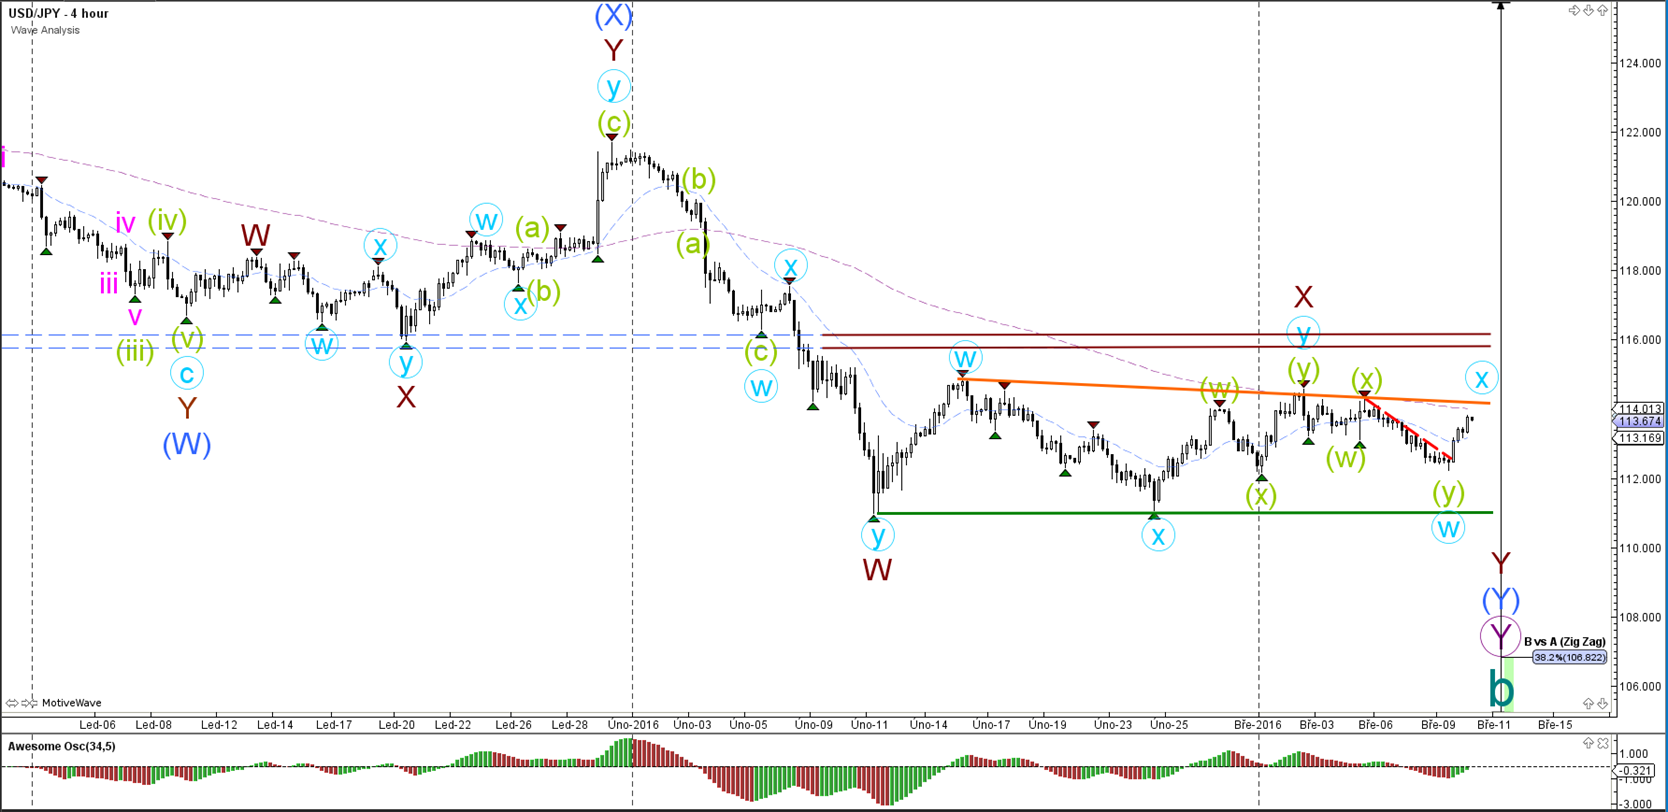
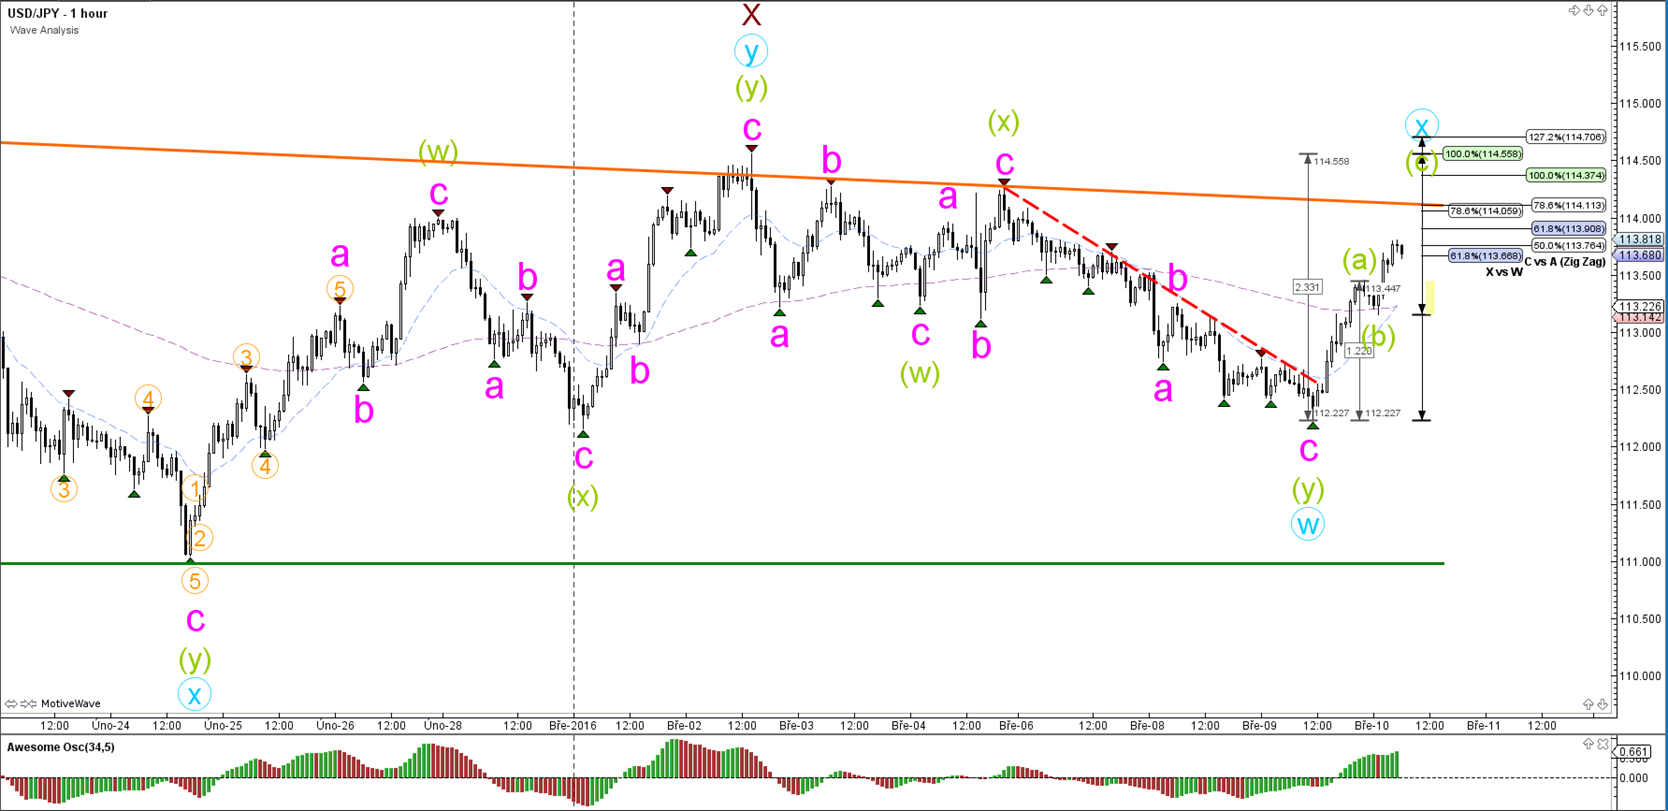
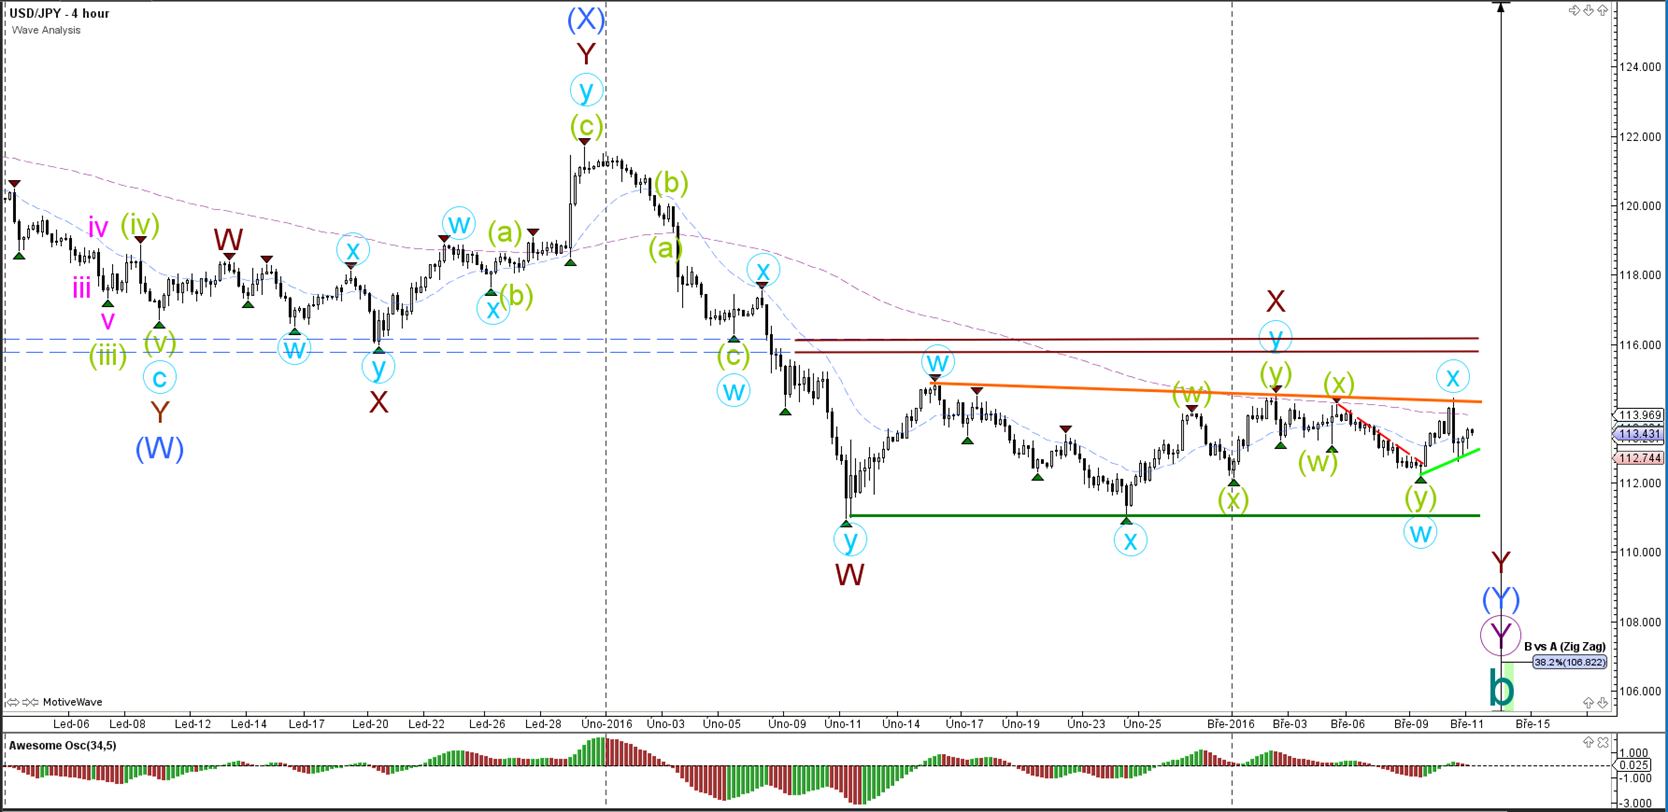
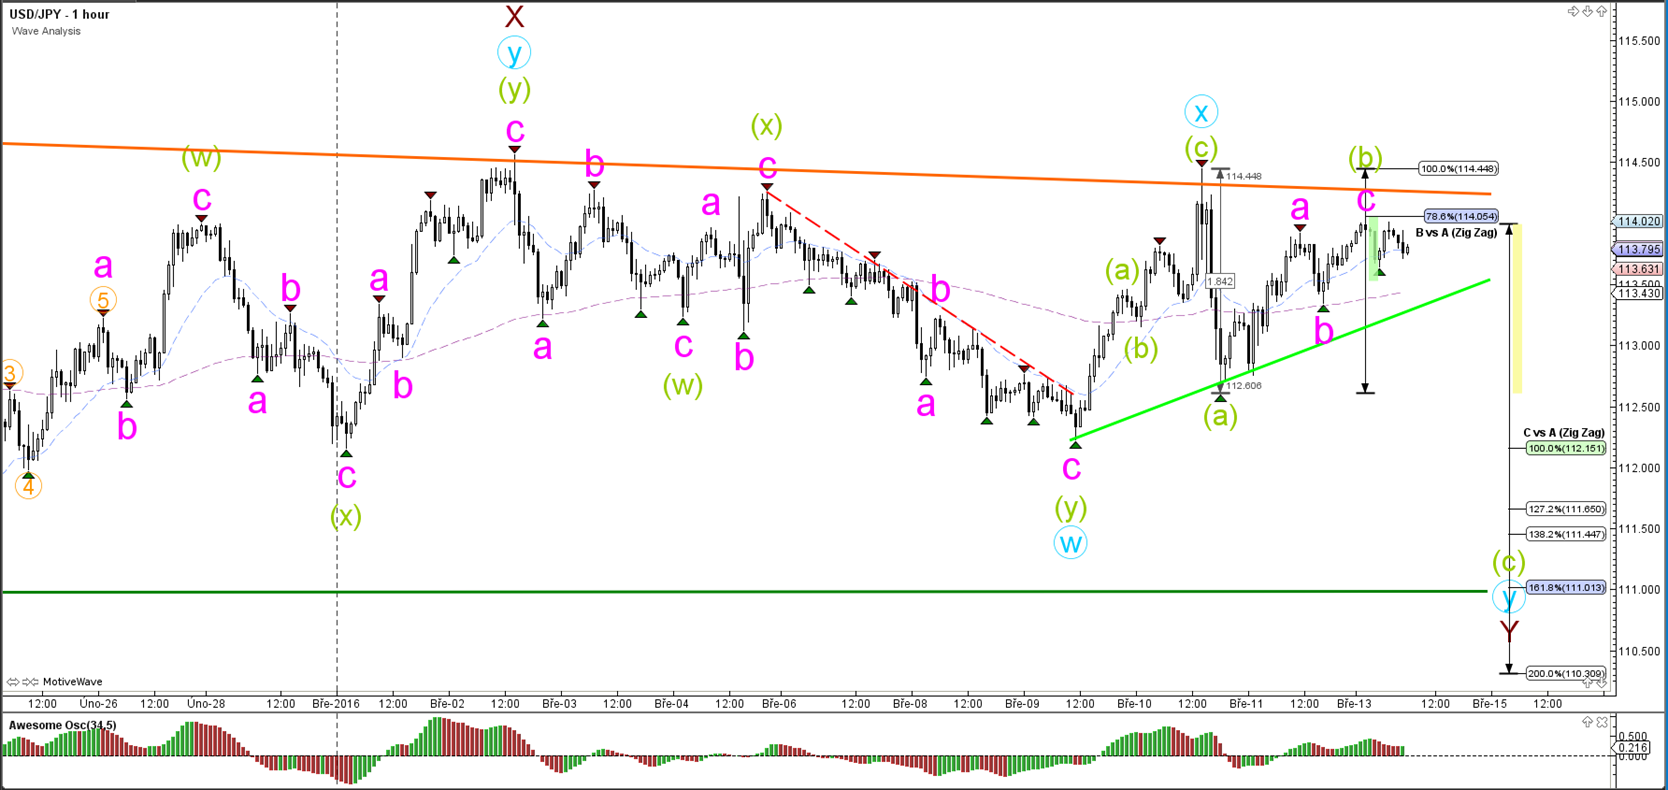
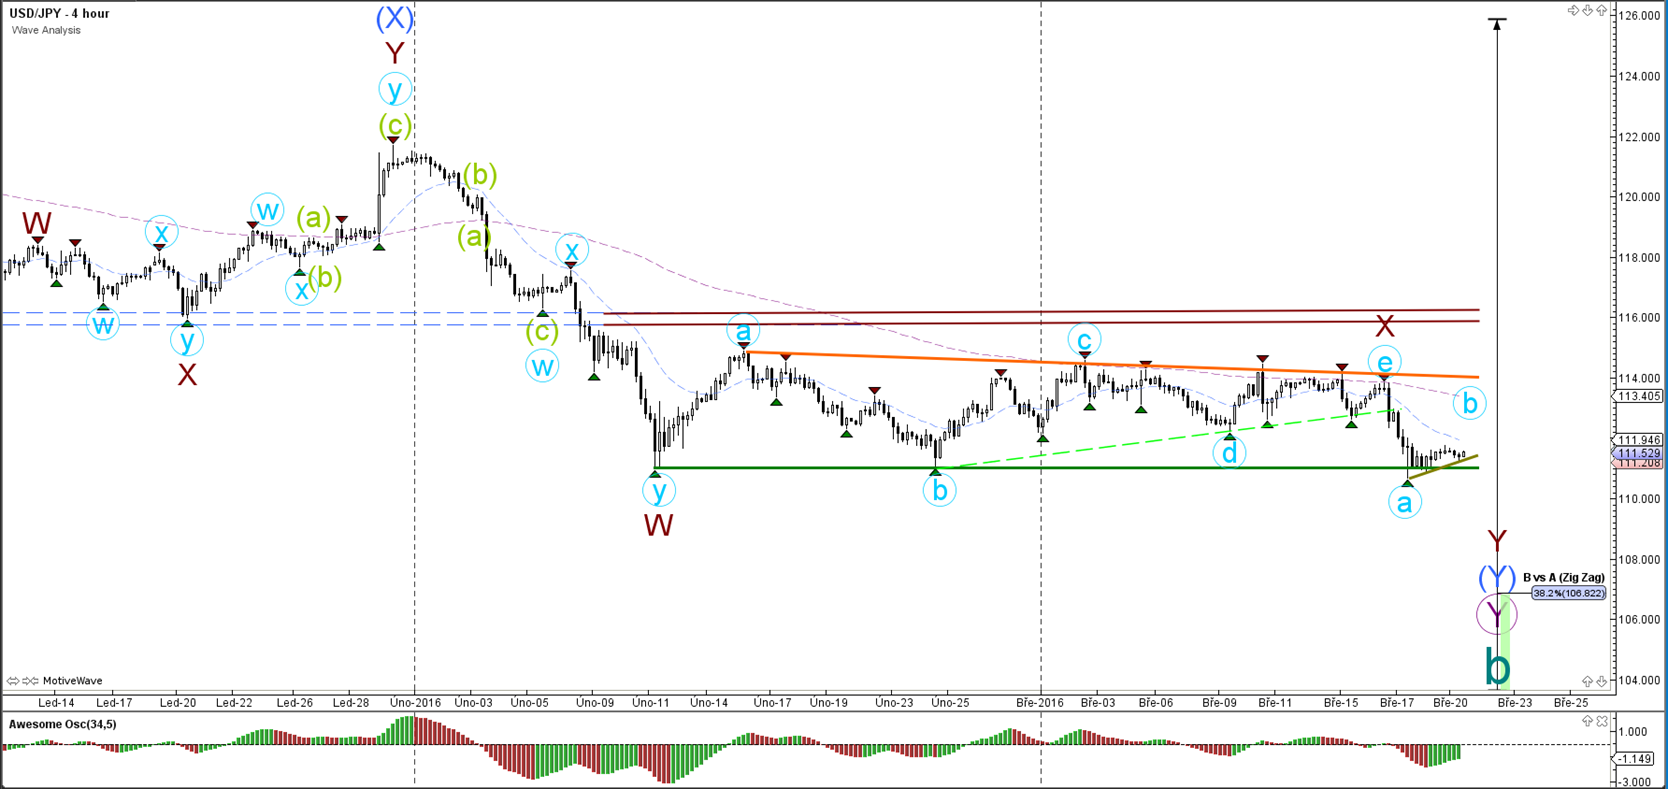
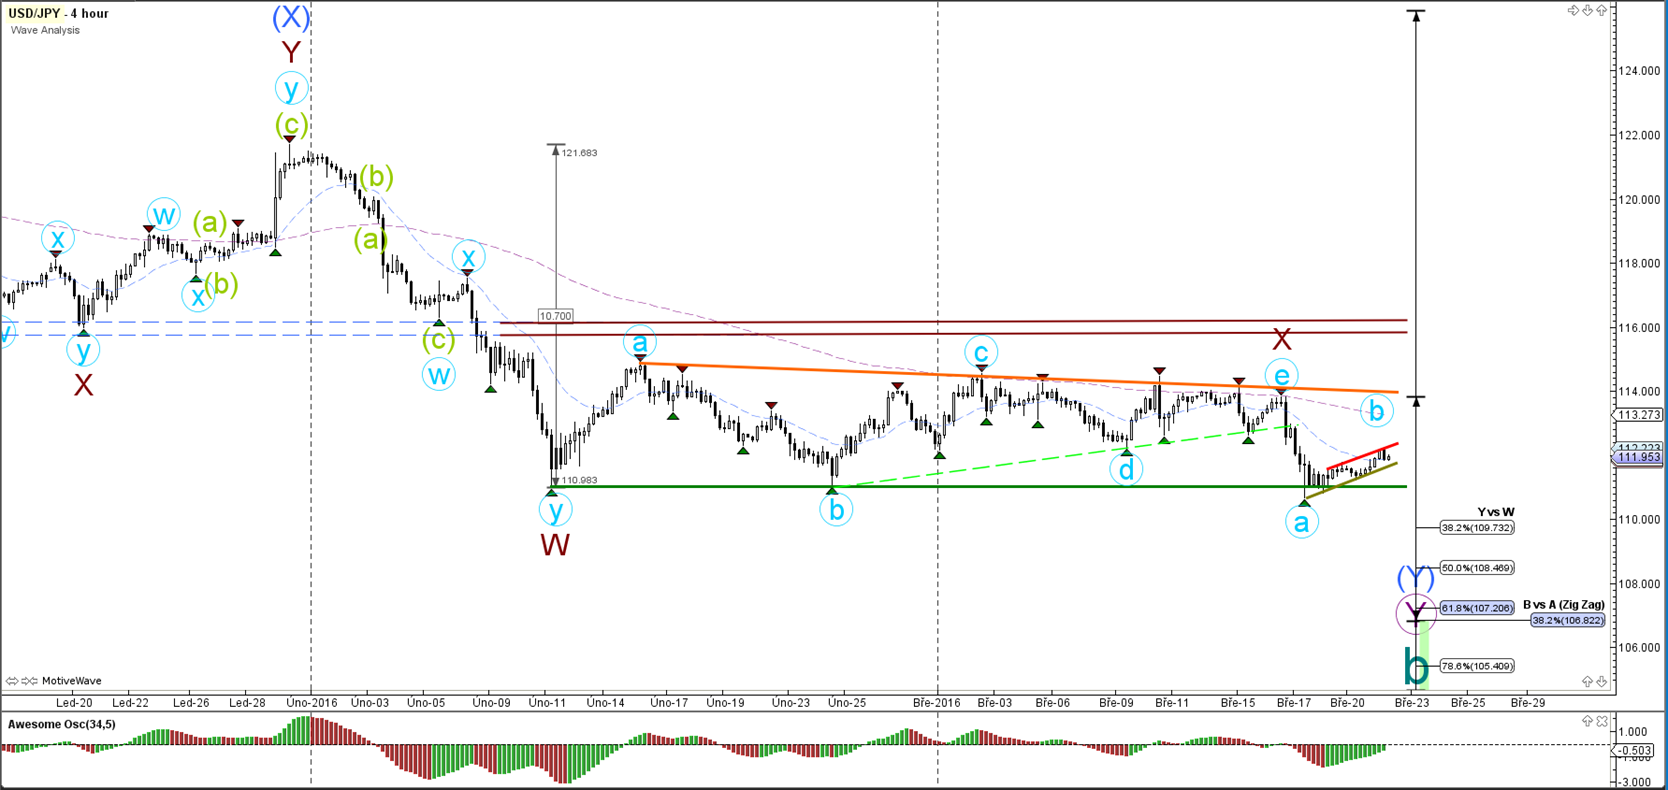
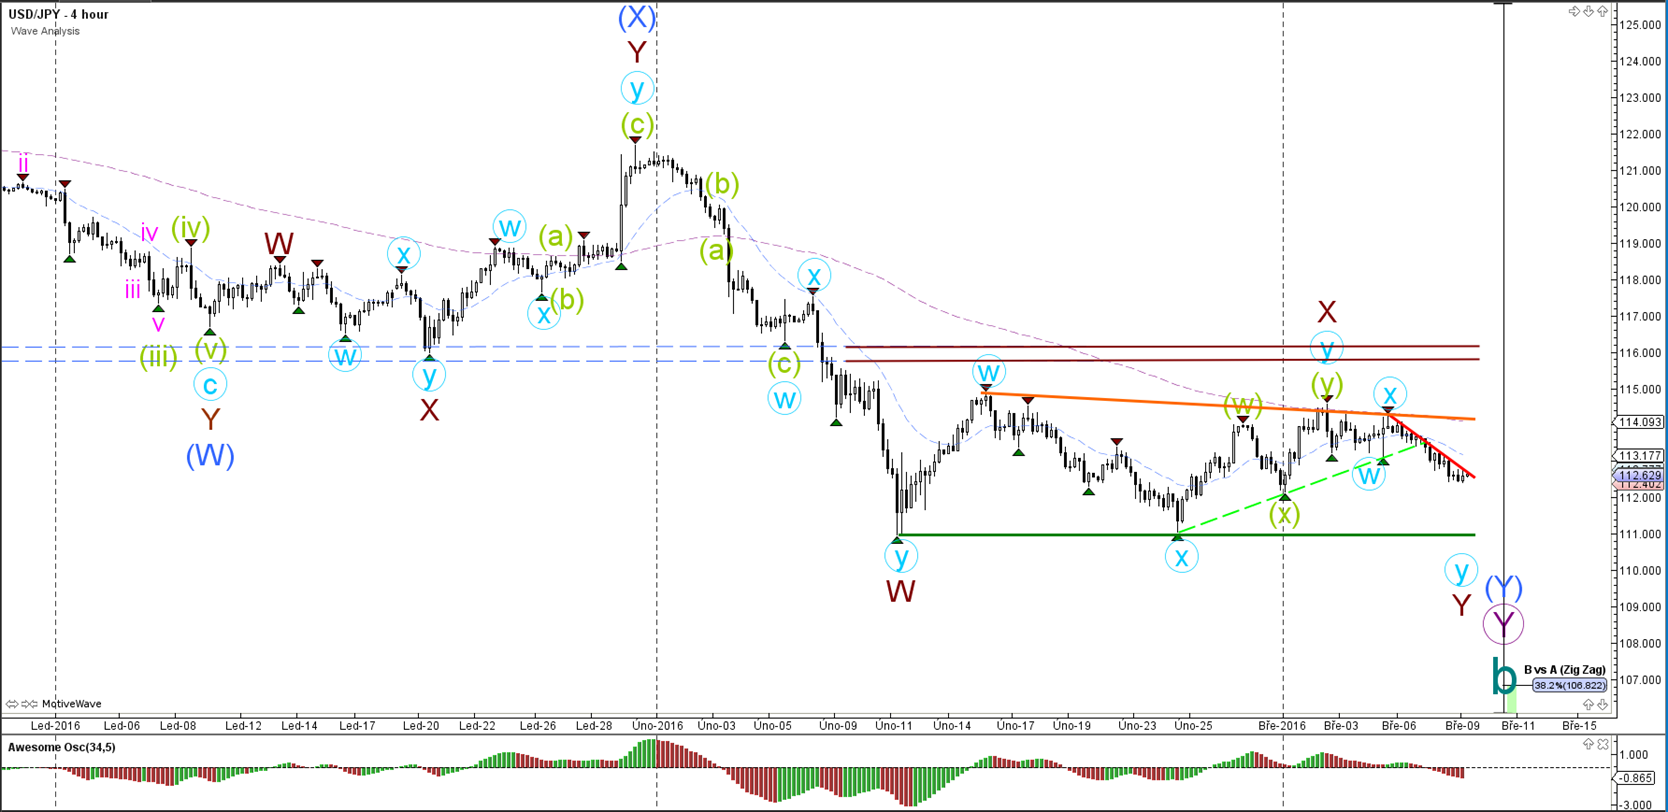
USD/JPY
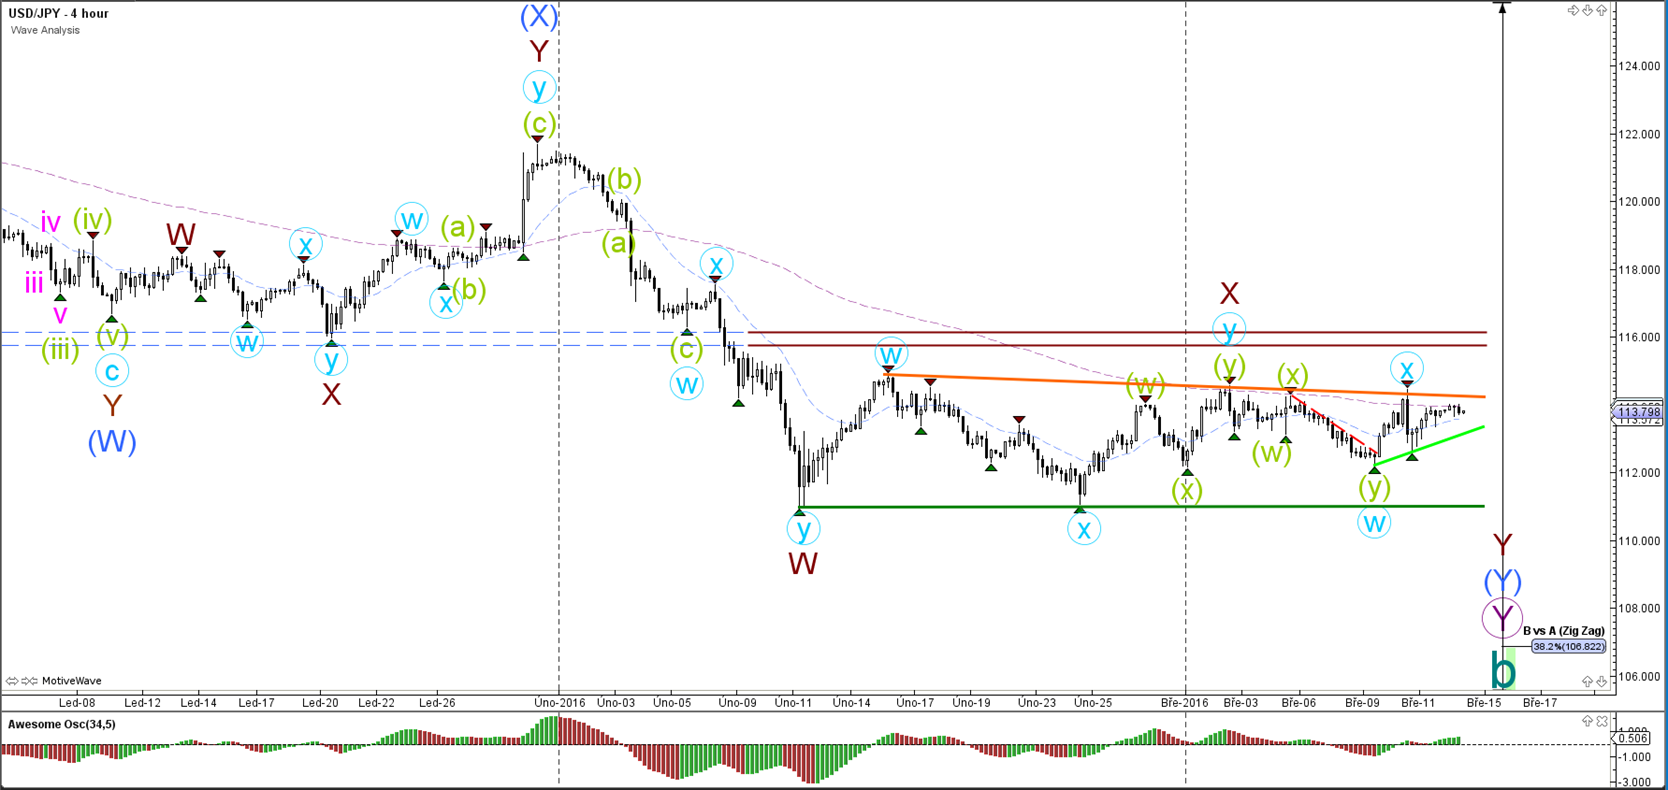
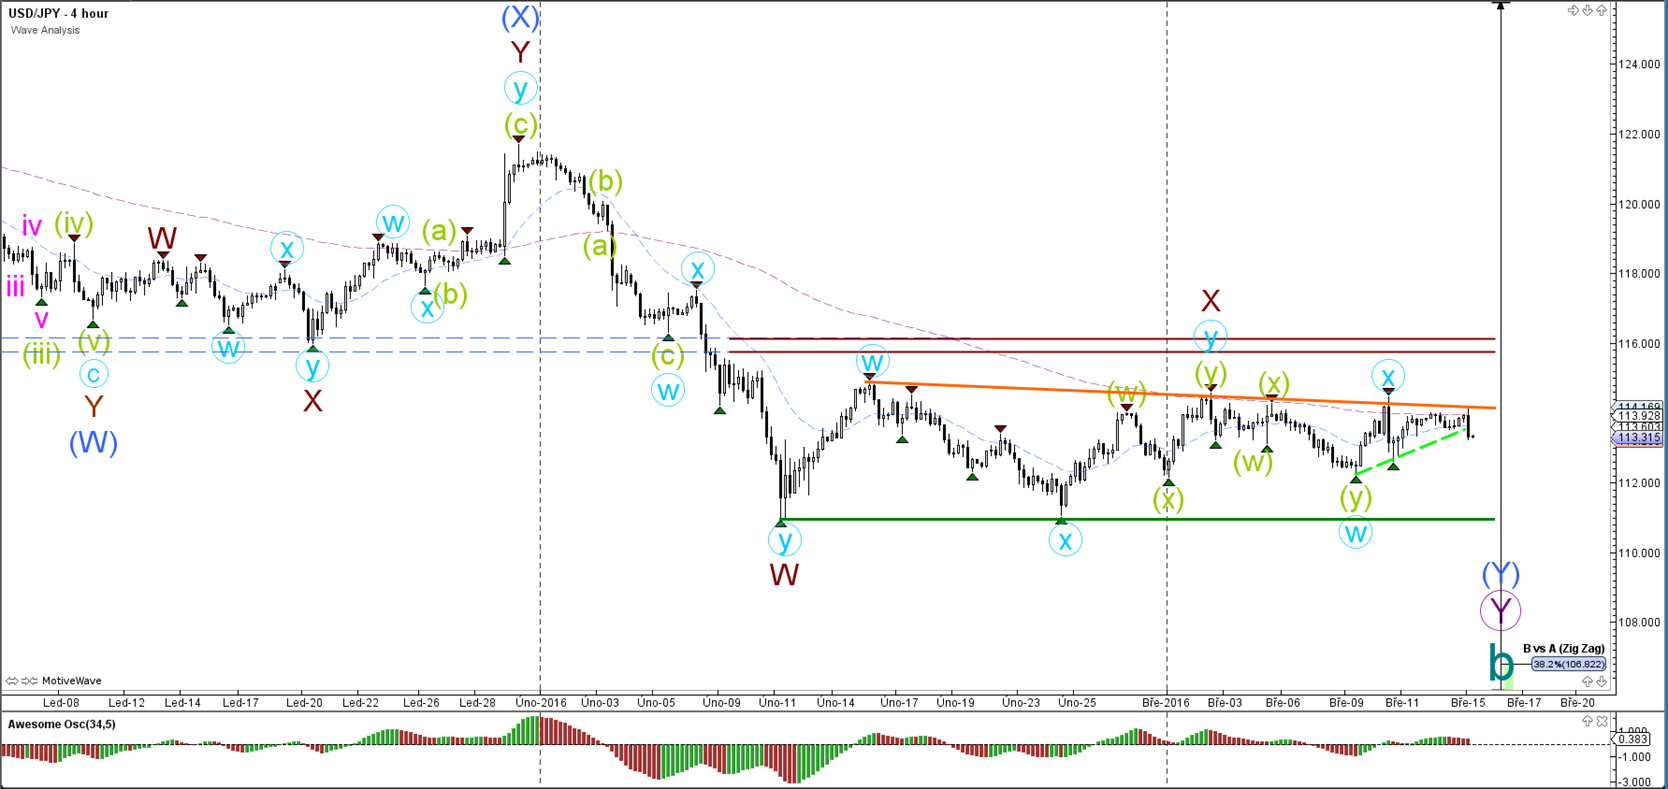
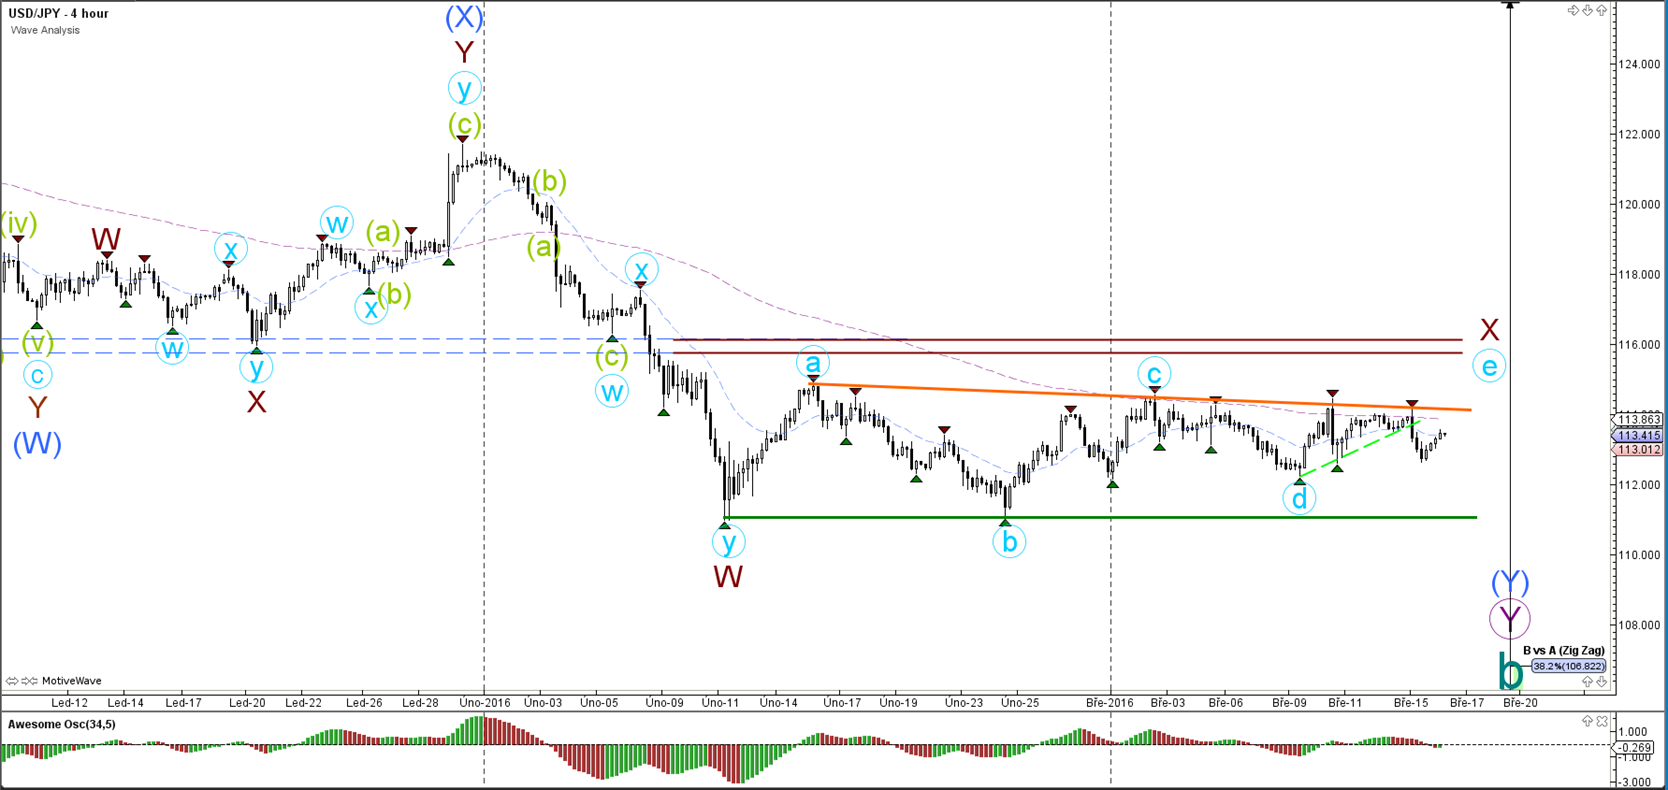
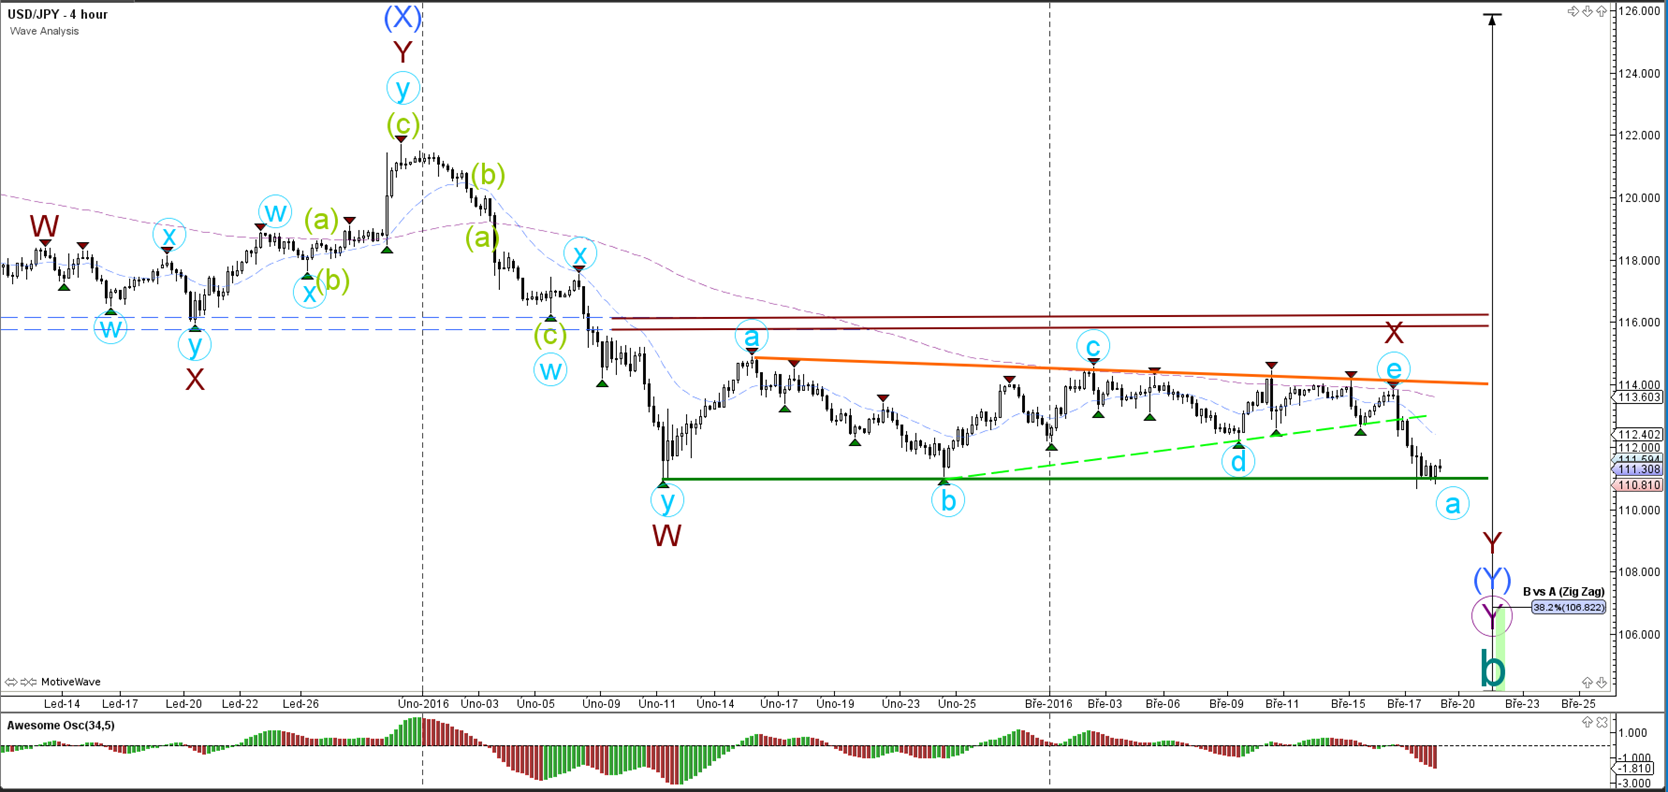
4 hour

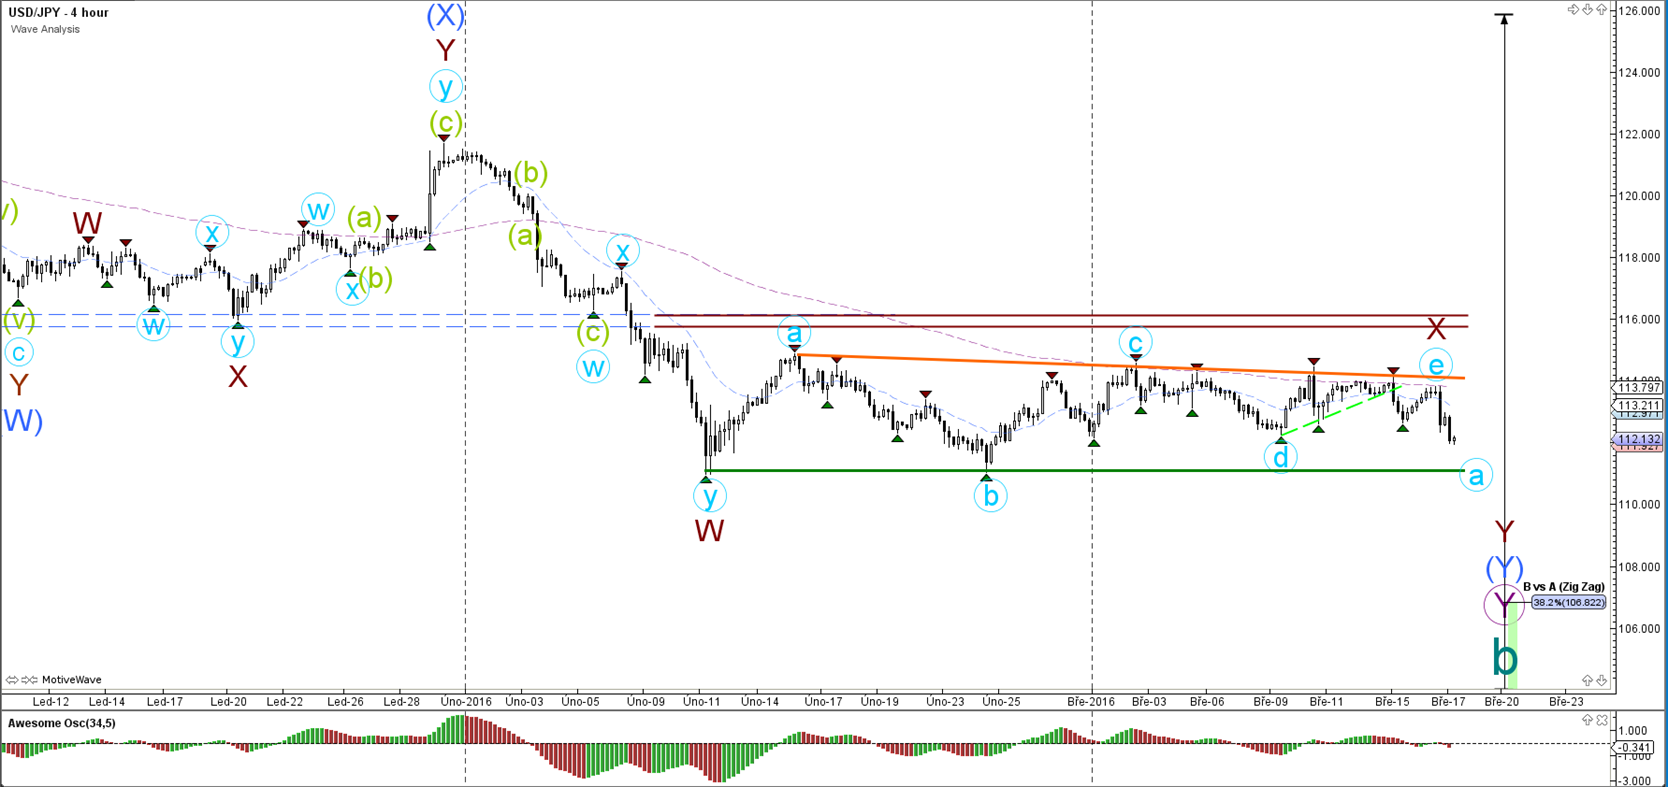
The USD/JPY remains in a larger sideways correction (orange/green). A break above orange however still indicates that price has long-term resistance above it. A break below green could see price fall as part of a wave B correction.
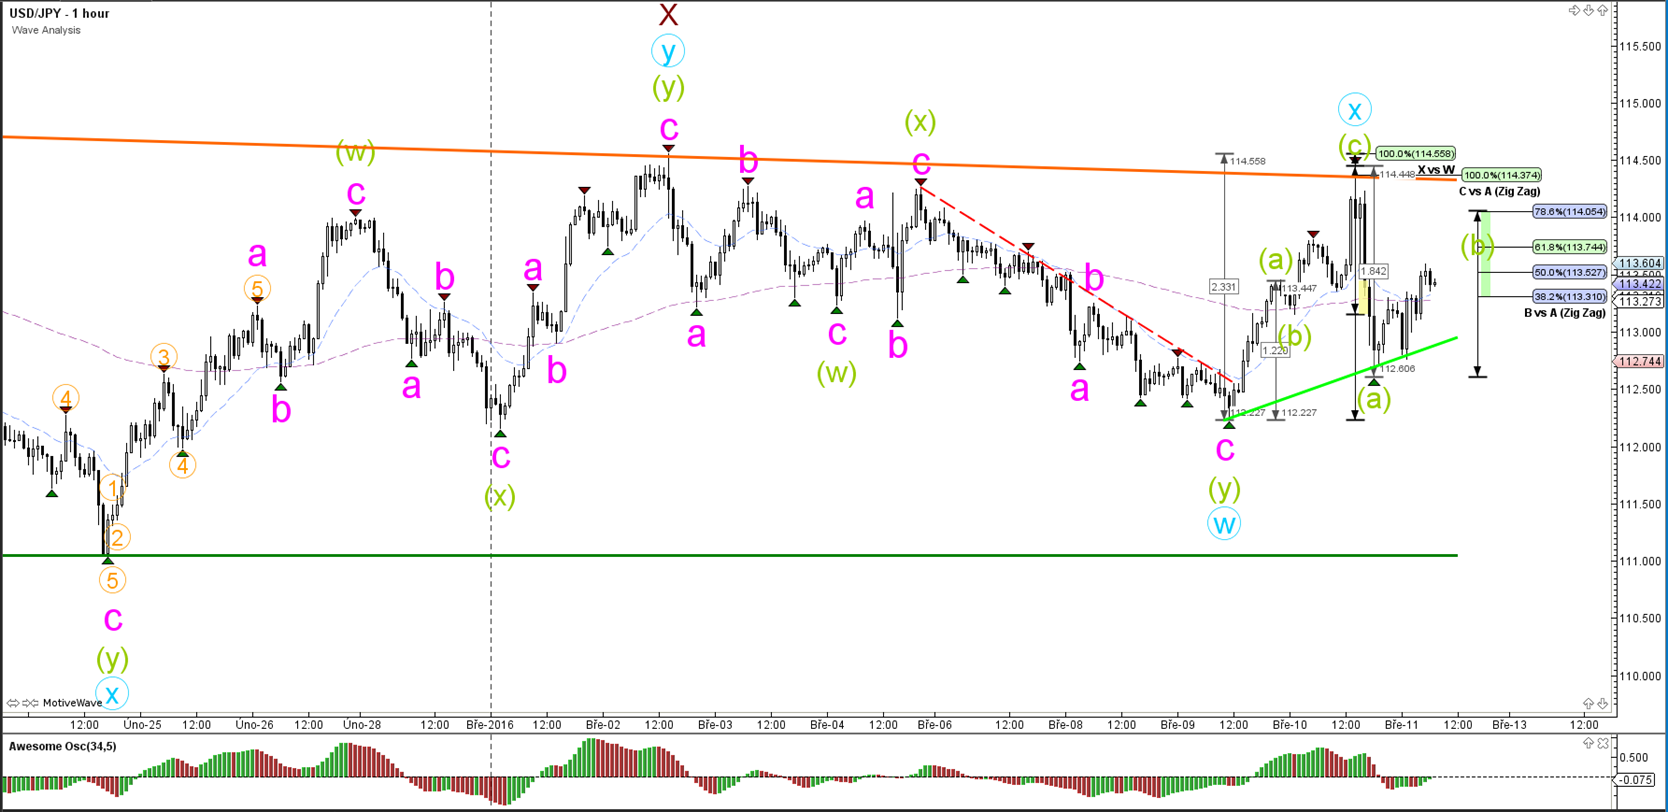
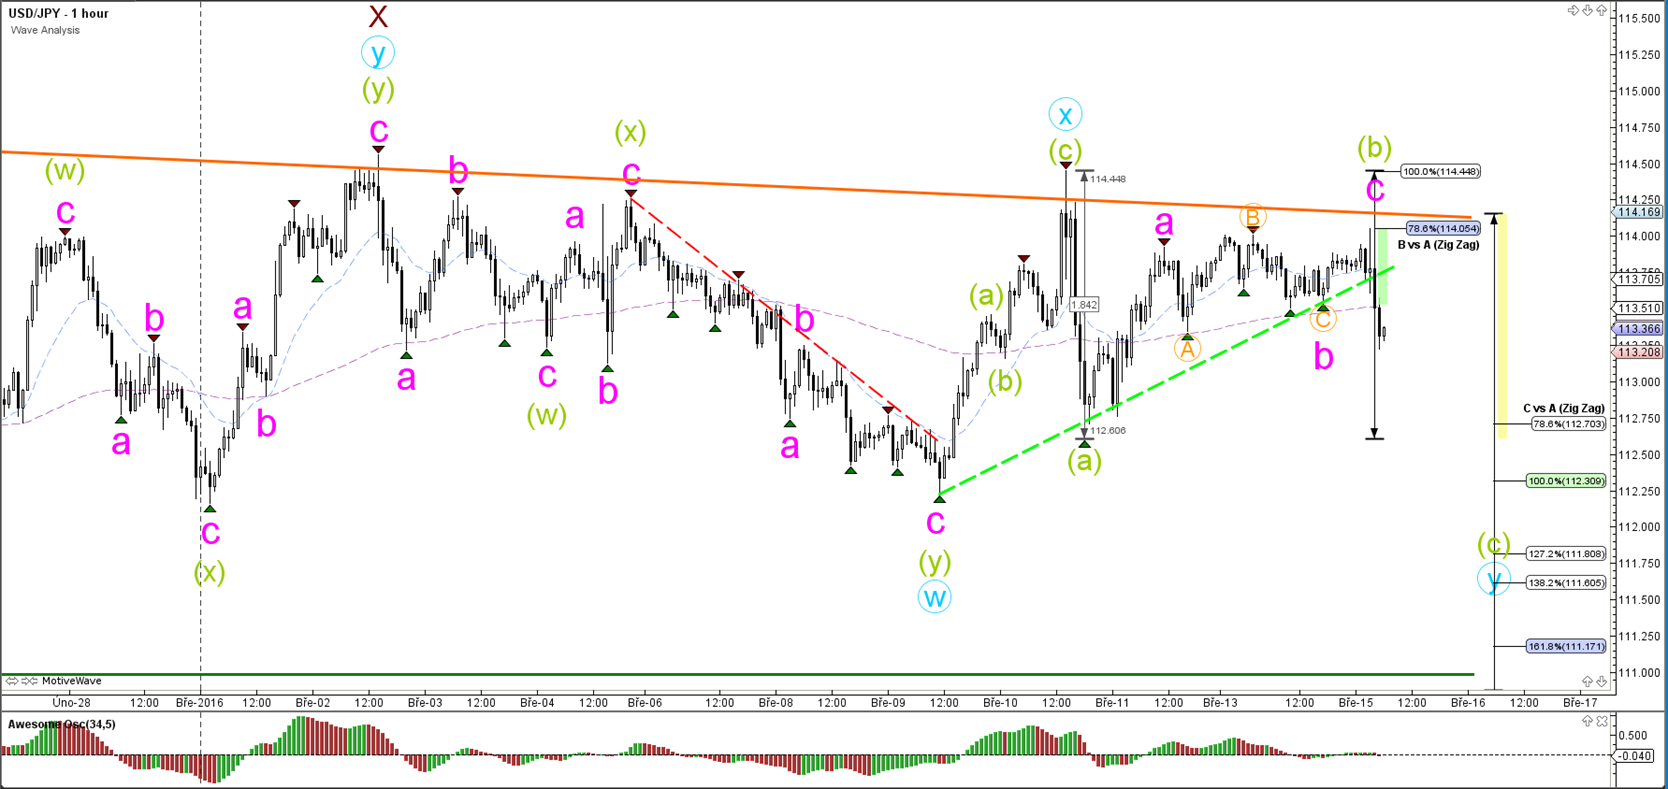
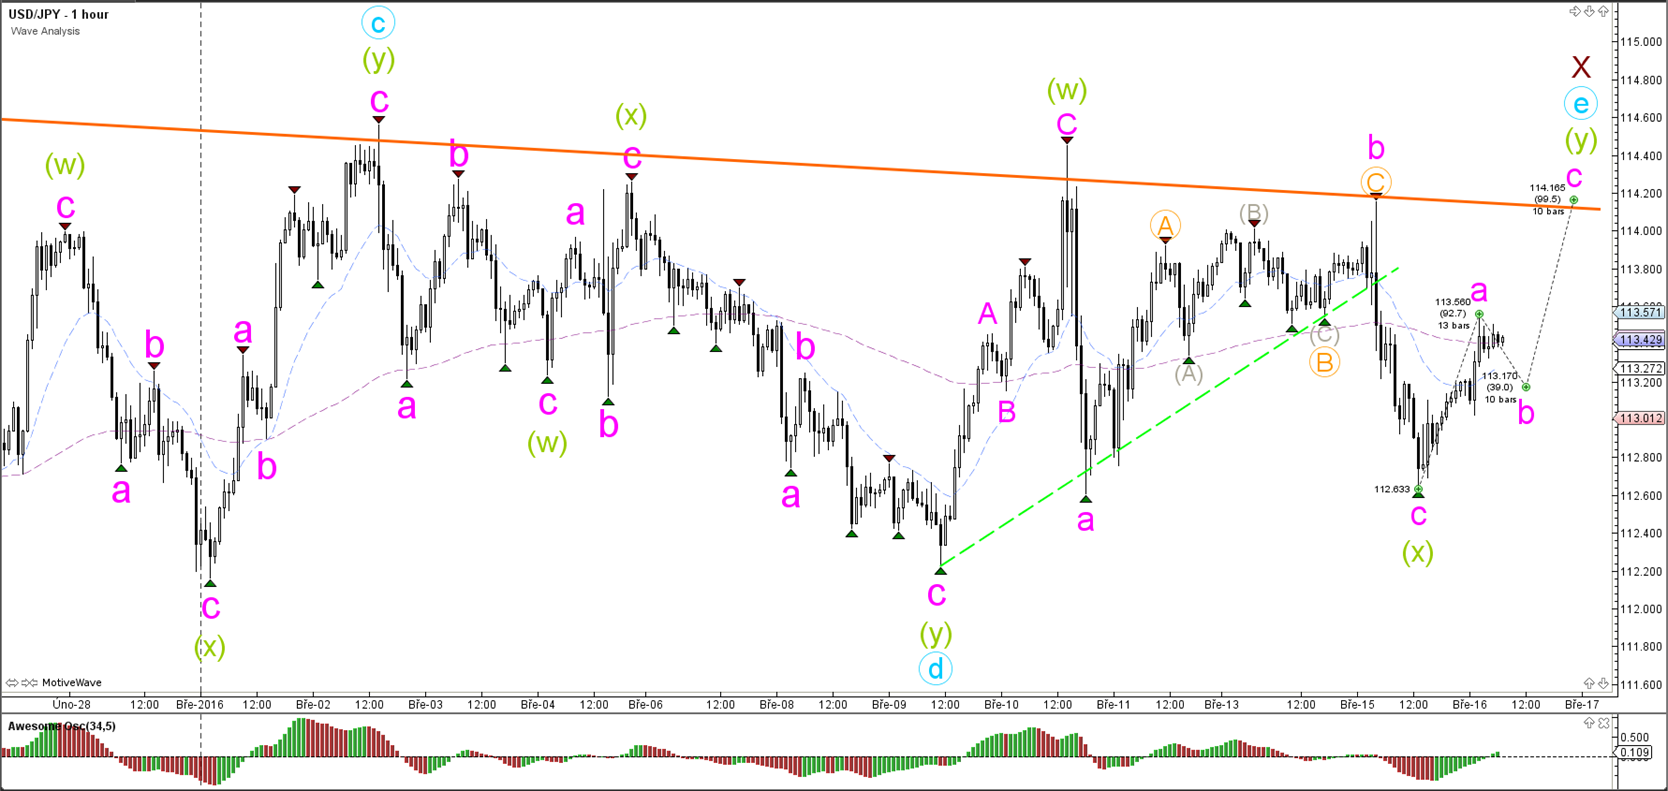
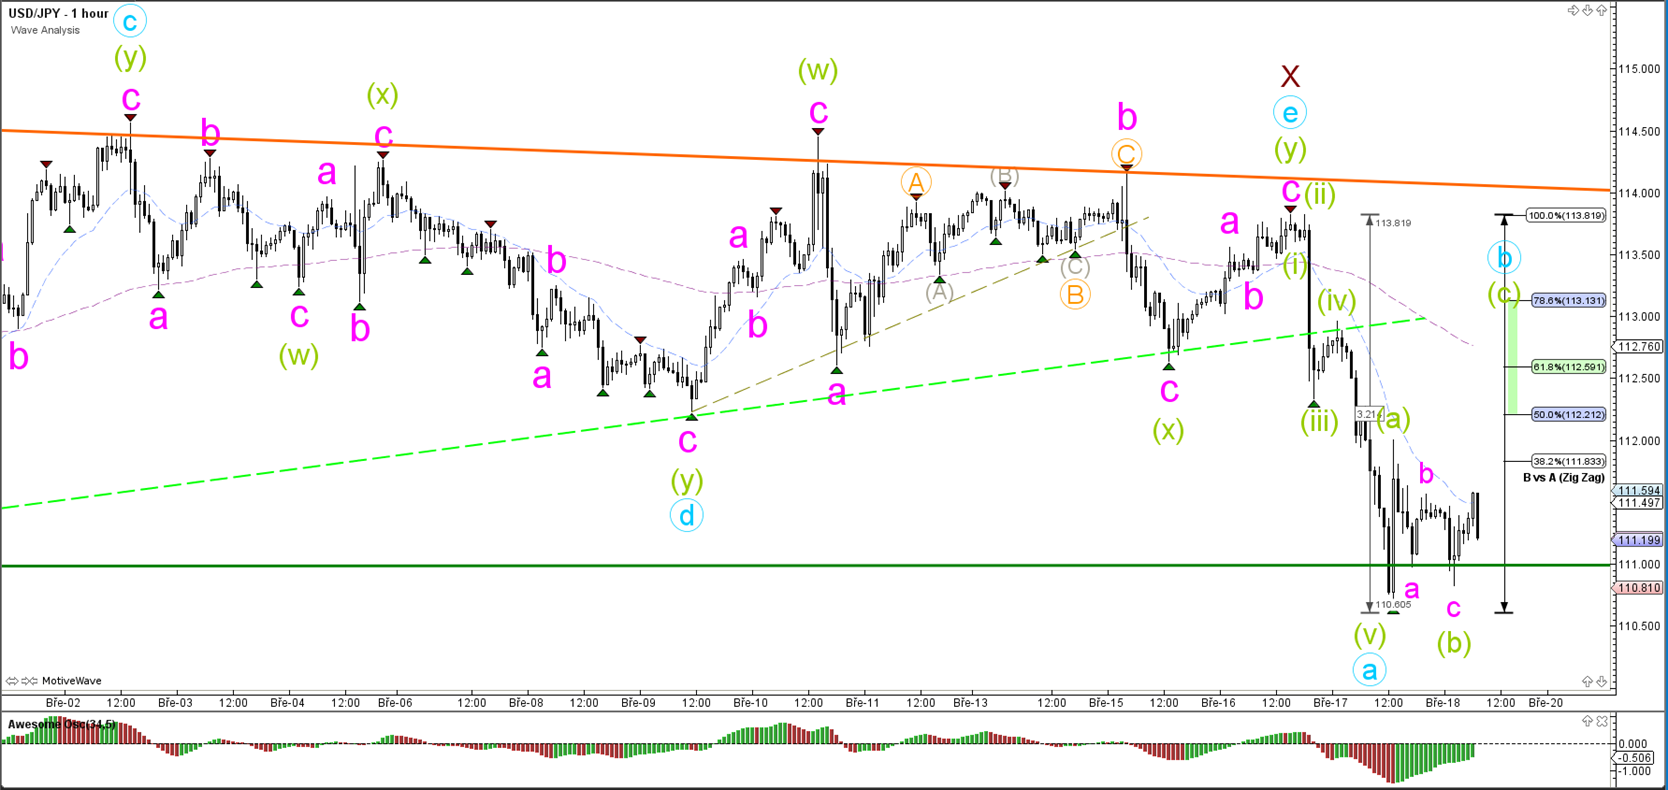
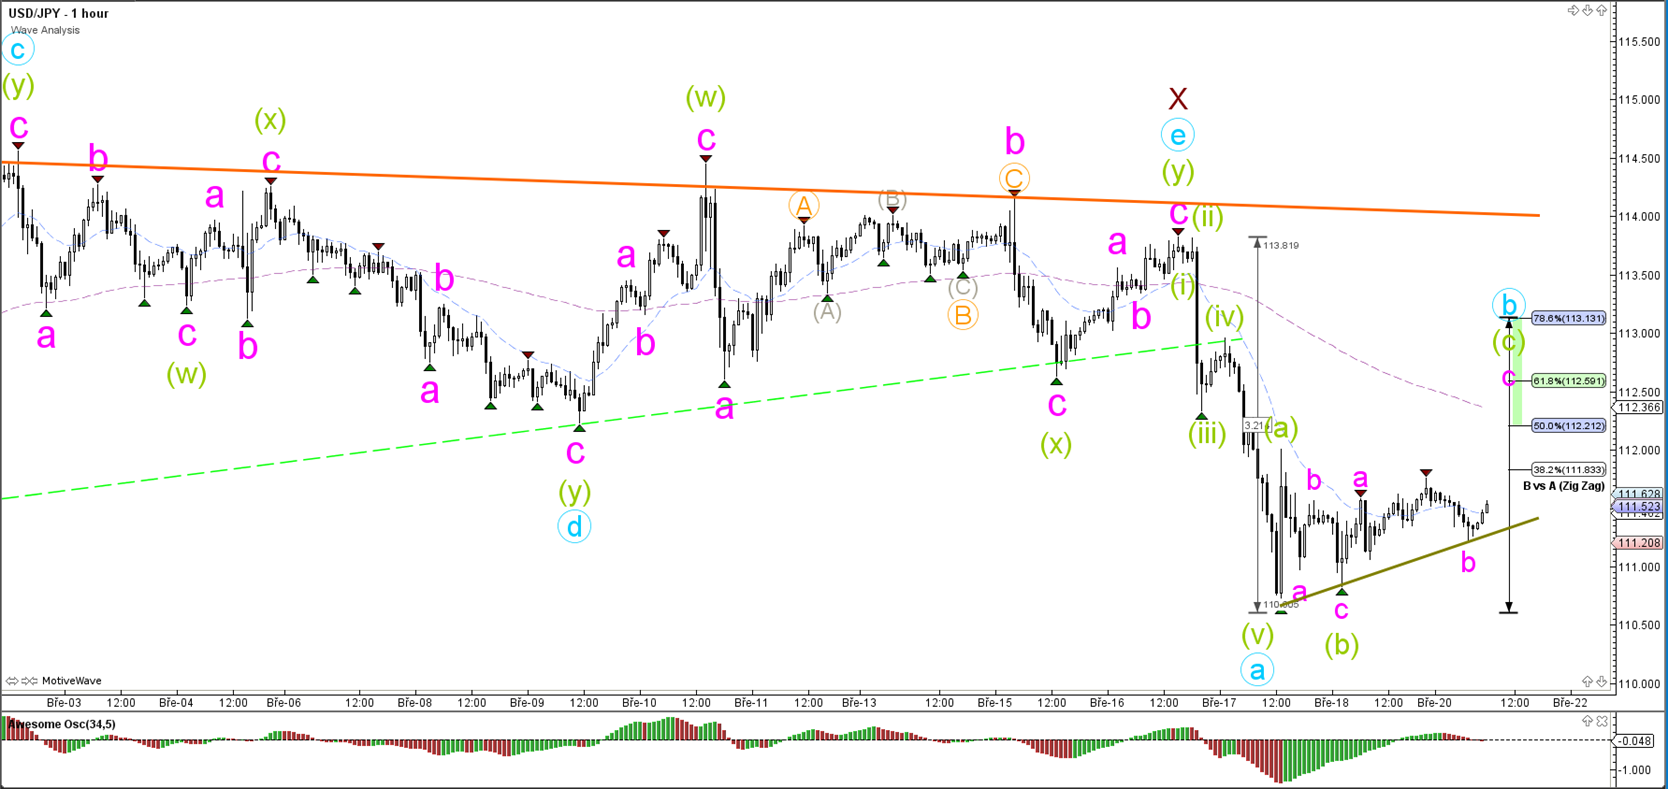
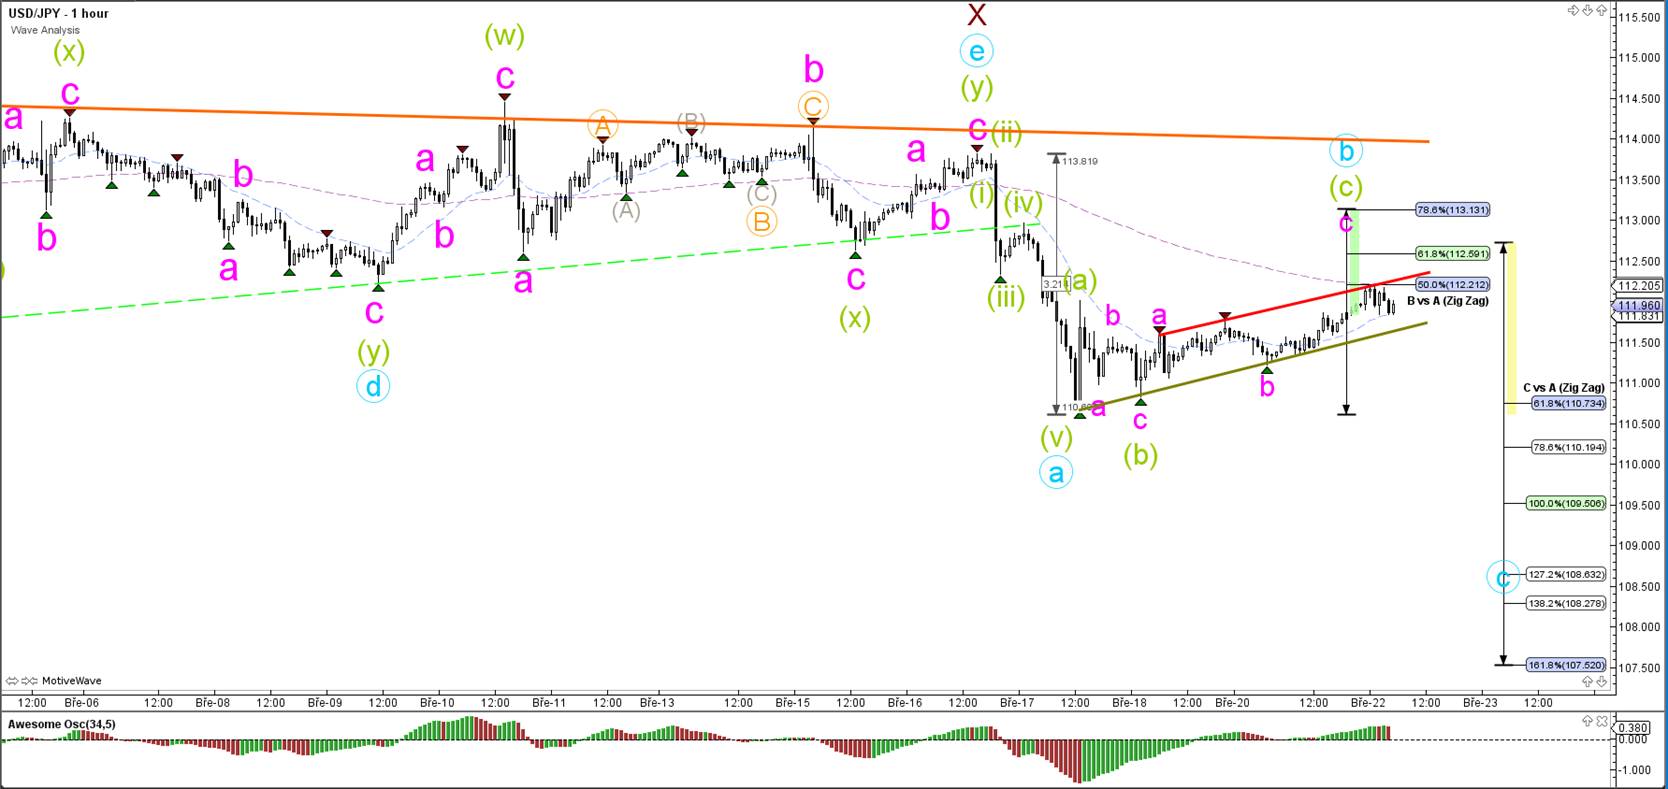
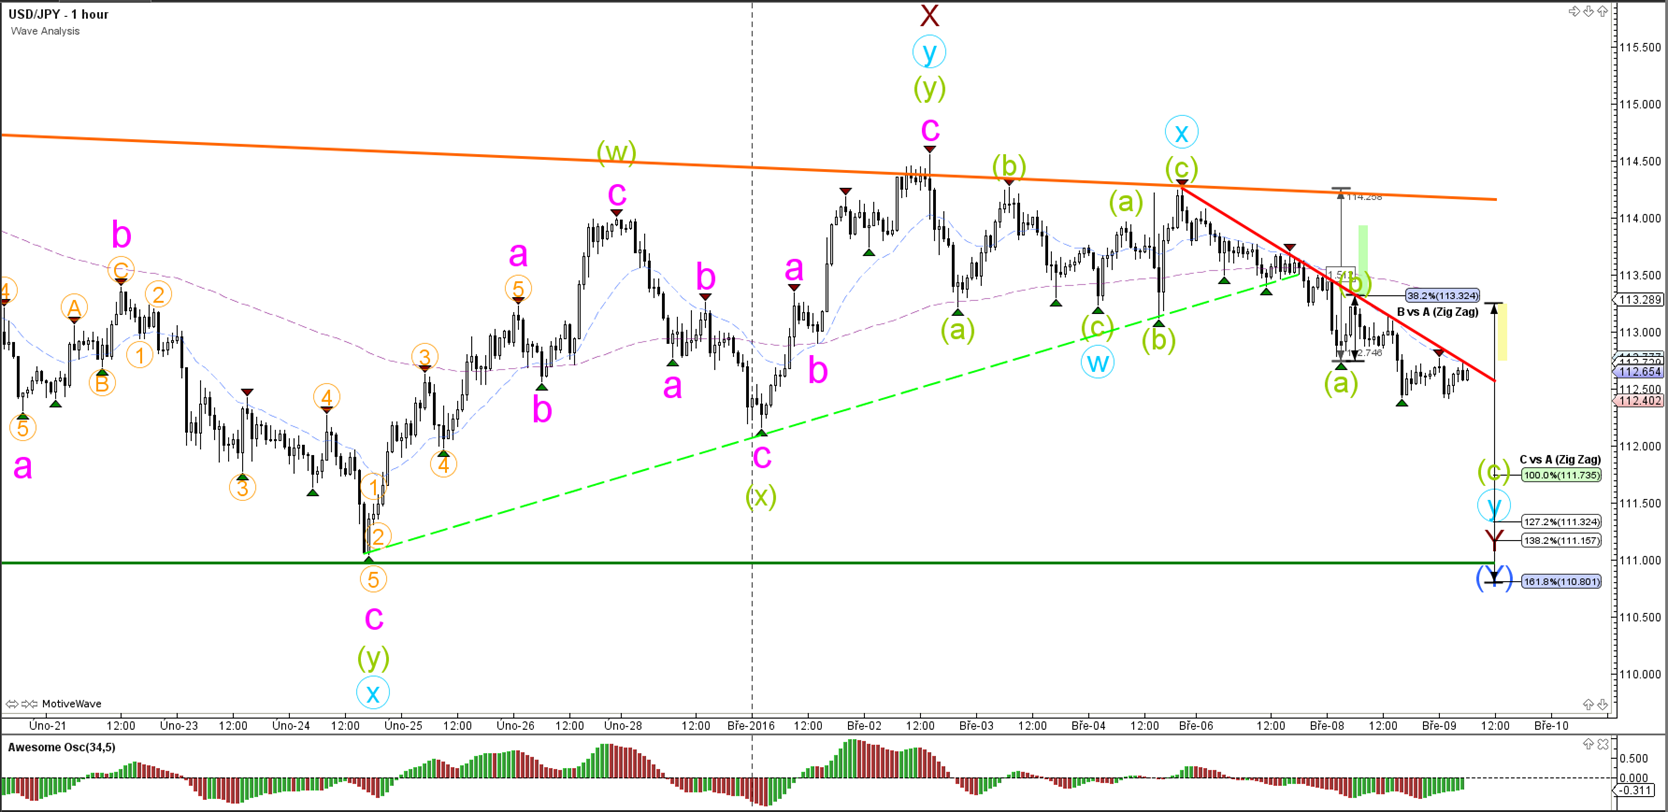
1 hour

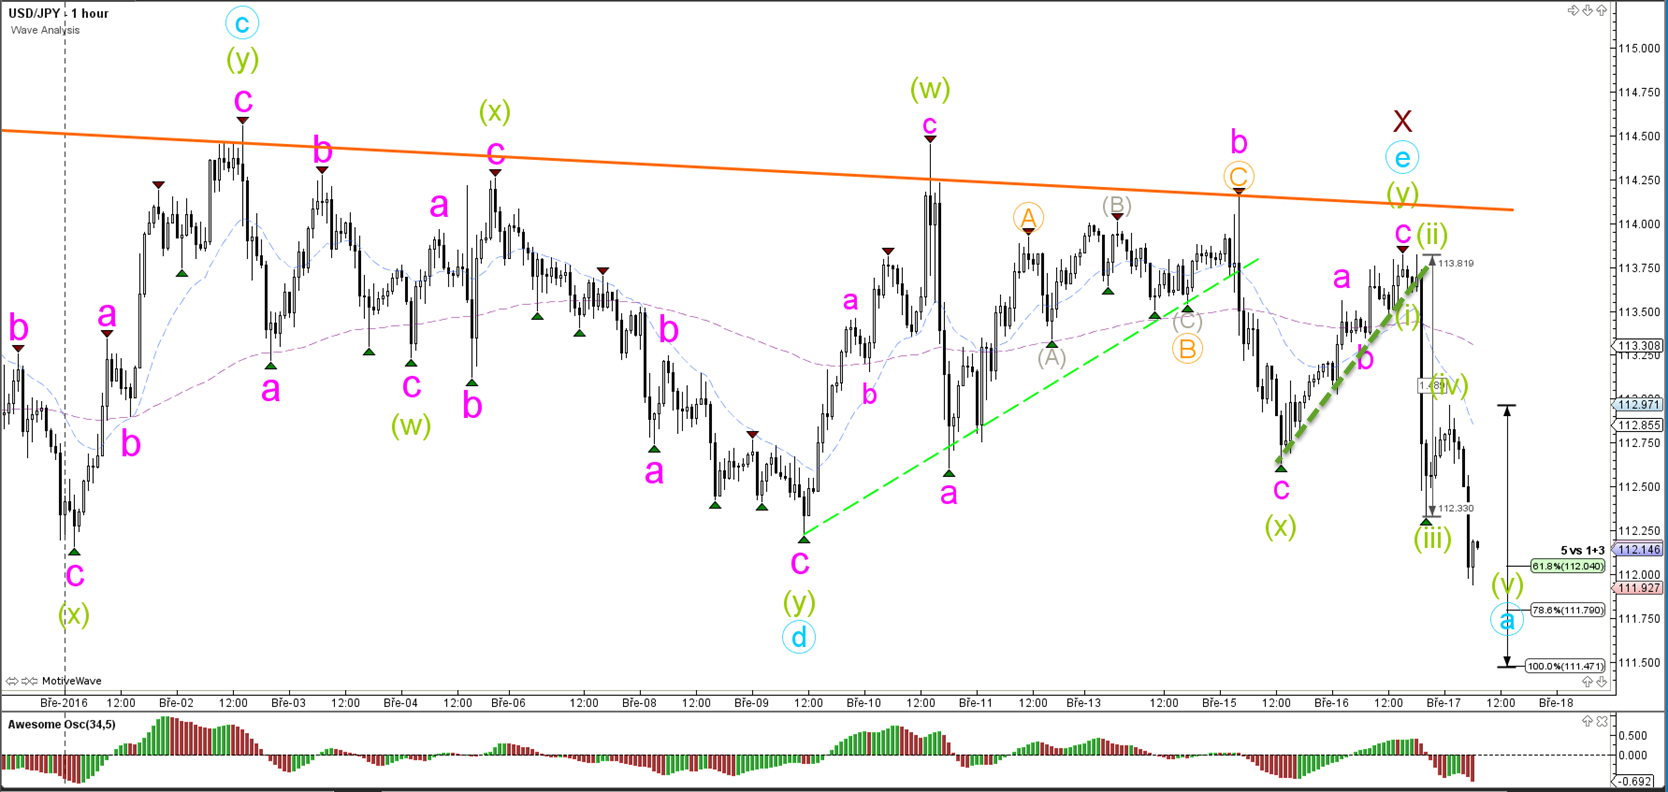
The USD/JPY broke below support in what could be a bearish ABC zigzag (green).
“Original analysis is provided by Admiral Markets”
EUR/USD
4 hour

The EUR/USD completed a shallow ABC zigzag (green). Price has broken below the support trend line (dotted green) in the meantime. For the moment it seems most likely that price will bounce at one of the Fibonacci levels as part of wave X (blue) for a corrective expansion towards Waves Y.
1 hour
A break below the light green line invalidates the Wave X (blue).
GBP/USD
4 hour
The GBP/USD respected a confluence of resistance such as the trend line (red) and 61.8% Fib and made a bearish turn. A break below the support trend lines is needed before price can expect to start wave 5. A break above the brown horizontal line invalidates wave 4 (blue).
1 hour
The GBP/USD could be starting a new bearish impulse (pink) with a wave 1-2 if it manages to stay below the previous top and eventually break below support.
USD/JPY
4 hour
The USD/JPY remains in a larger sideways correction (orange/green). A break above orange however still indicates that price has long-term resistance above it. A break below green could see price fall as part of a wave B correction.
1 hour
The USD/JPY broke below support in what could be a bearish ABC zigzag (green).
“Original analysis is provided by Admiral Markets”