Admiral Markets
AdmiralMarkets.com Representative
- Messages
- 95
GBP/USD weakness continues by breaking weekly bottom
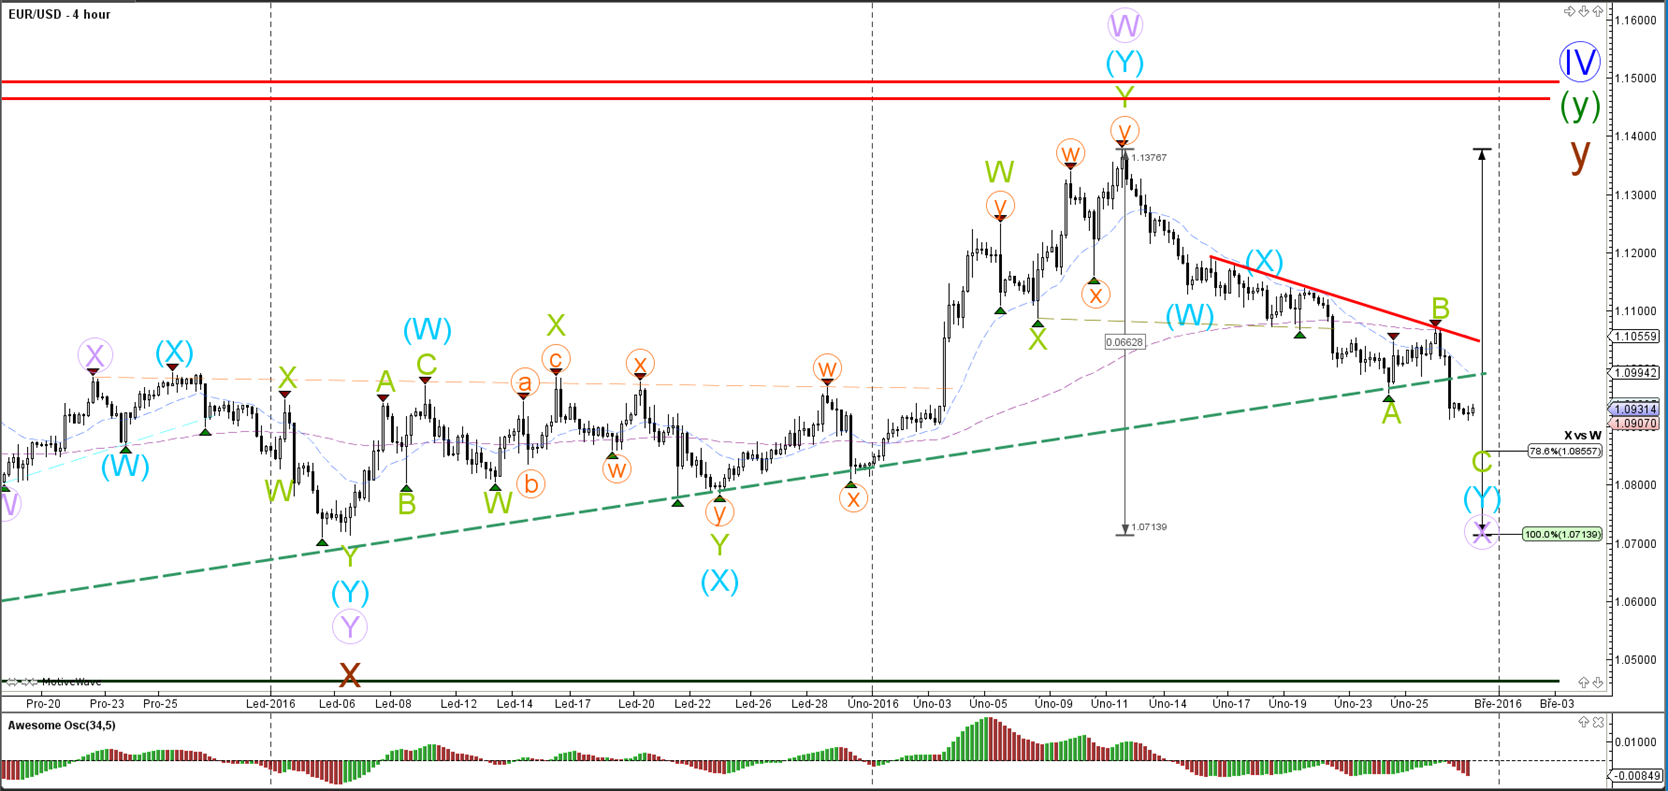
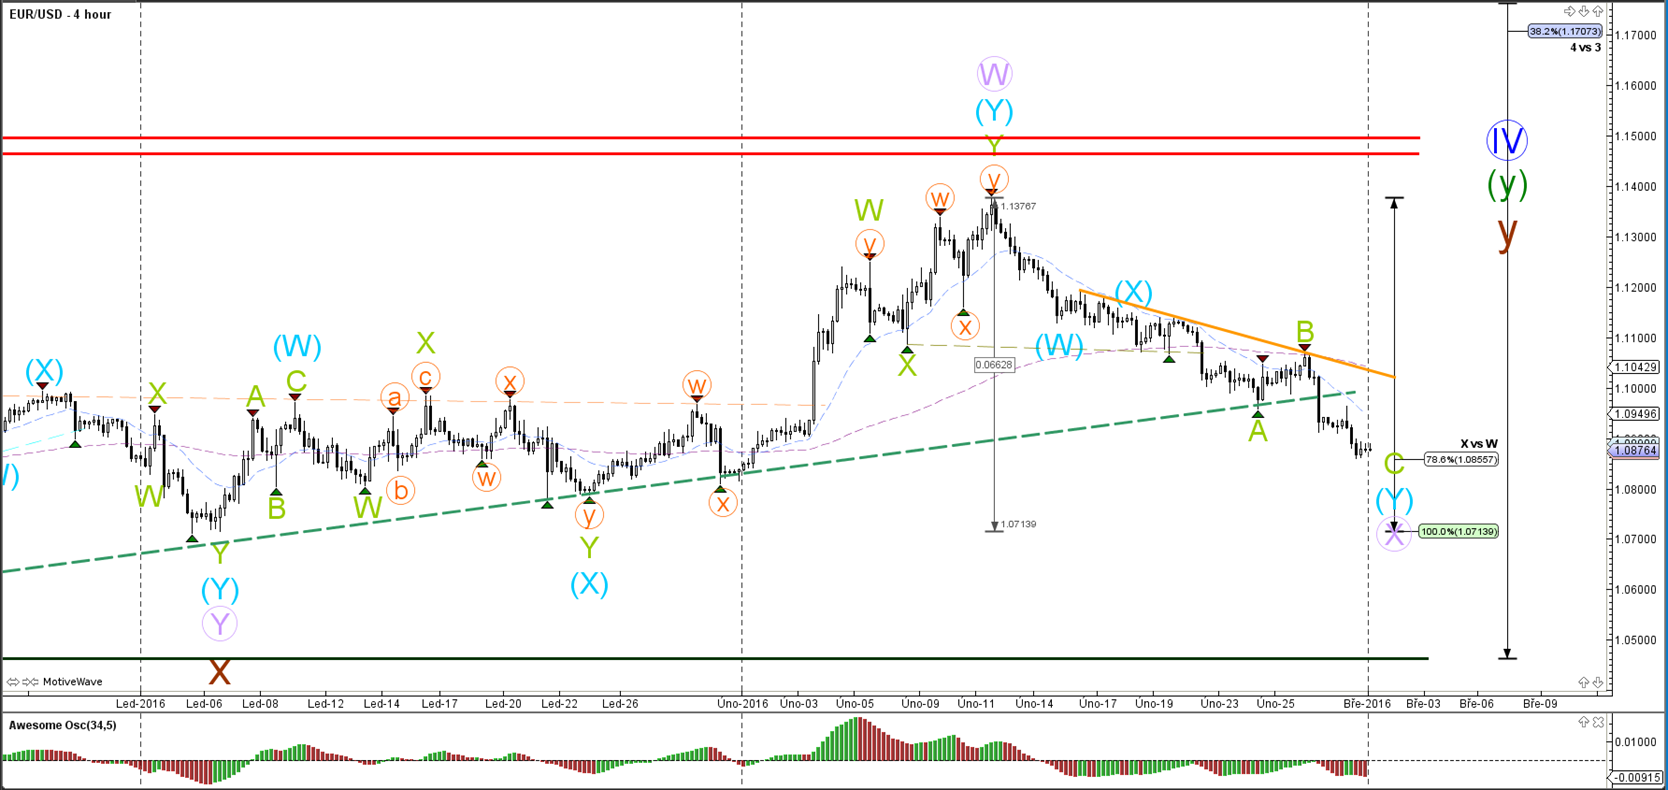
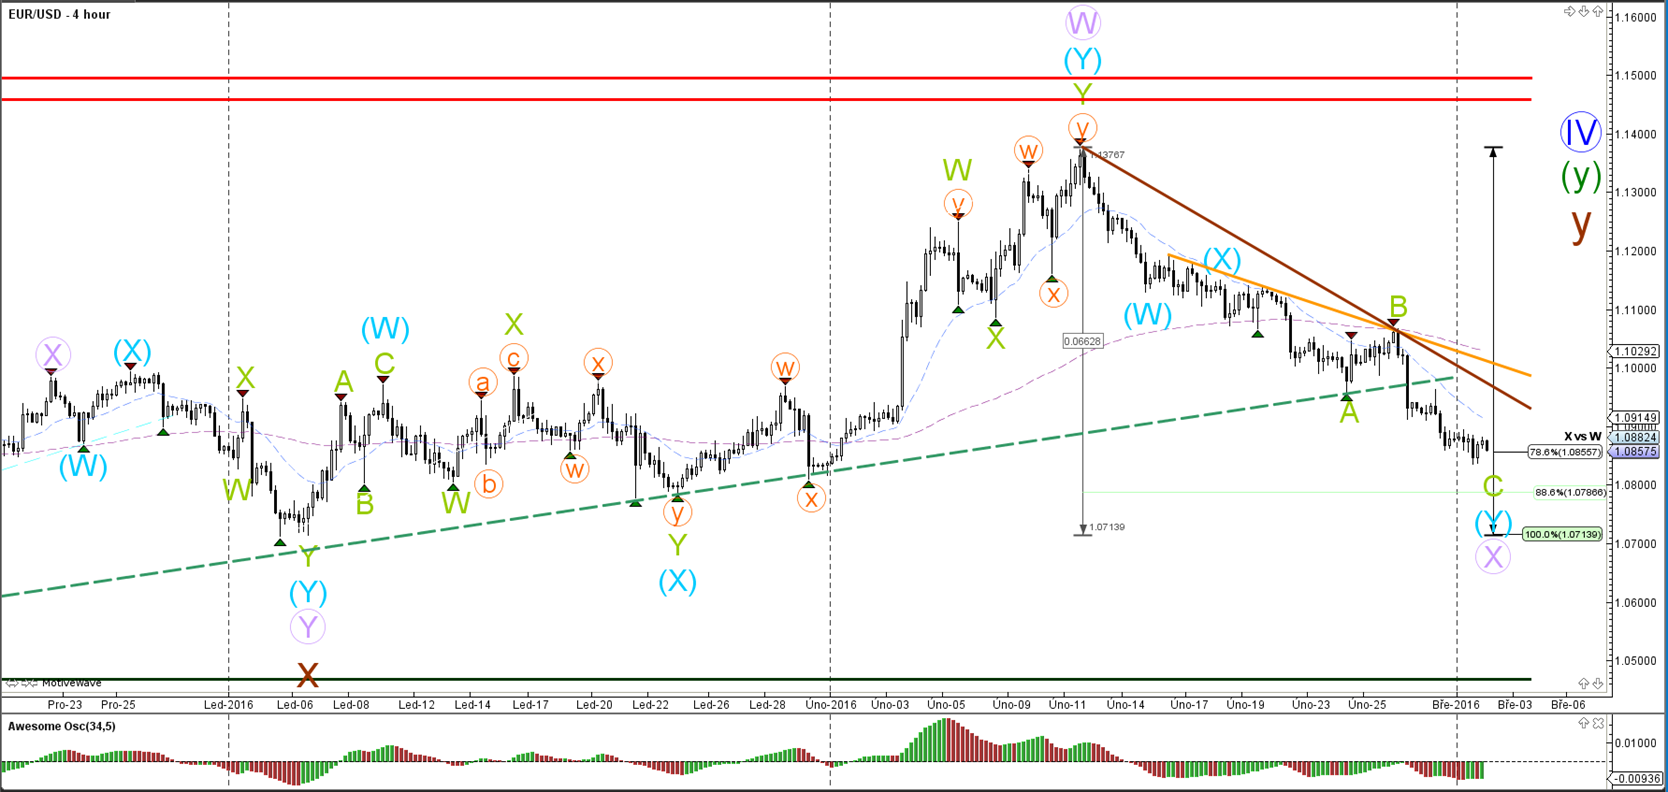
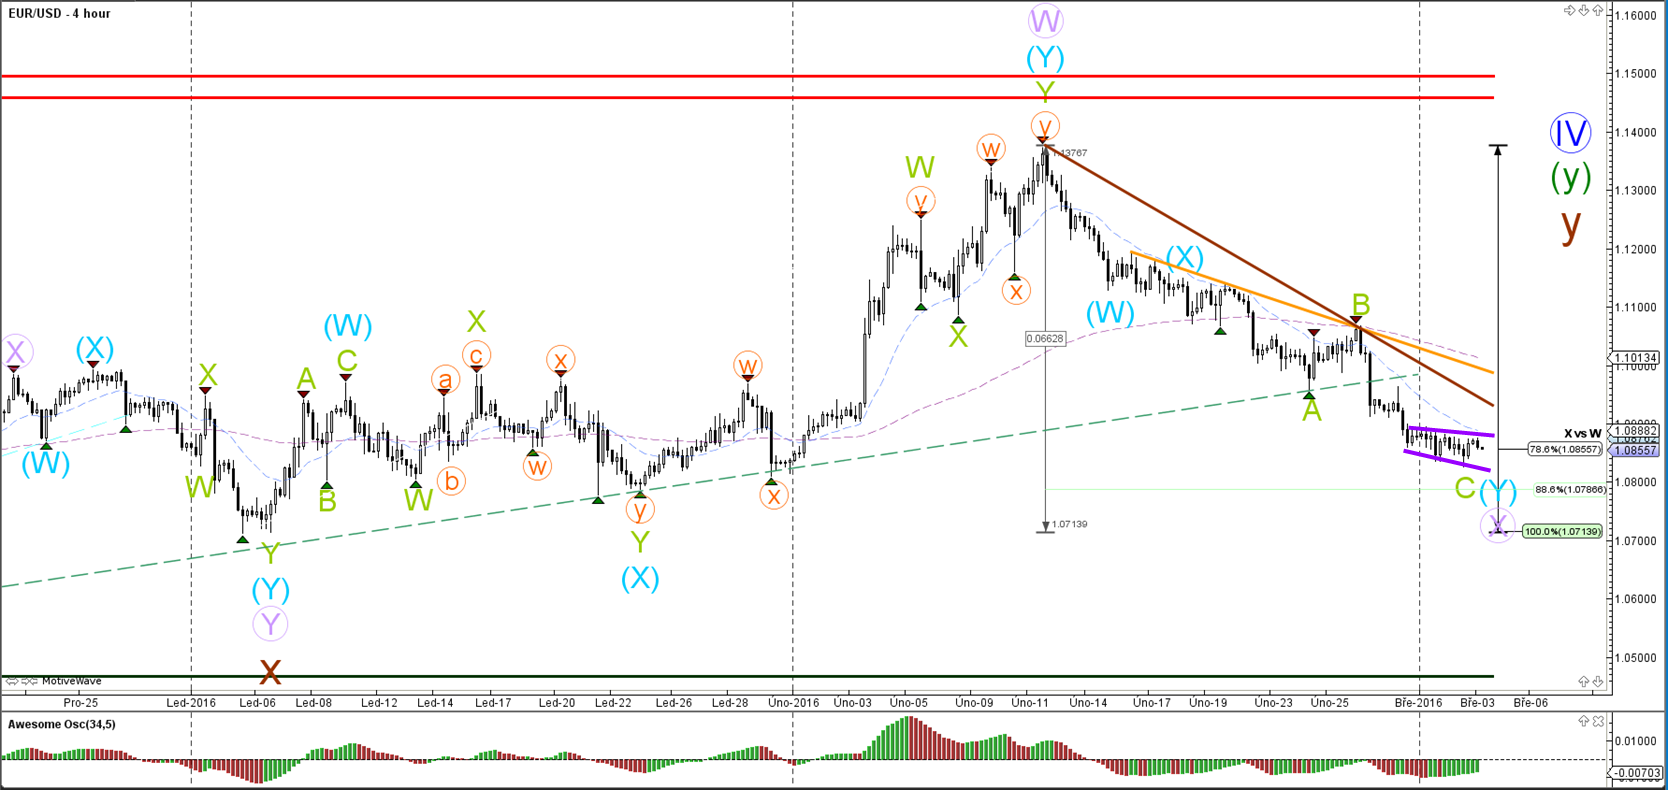
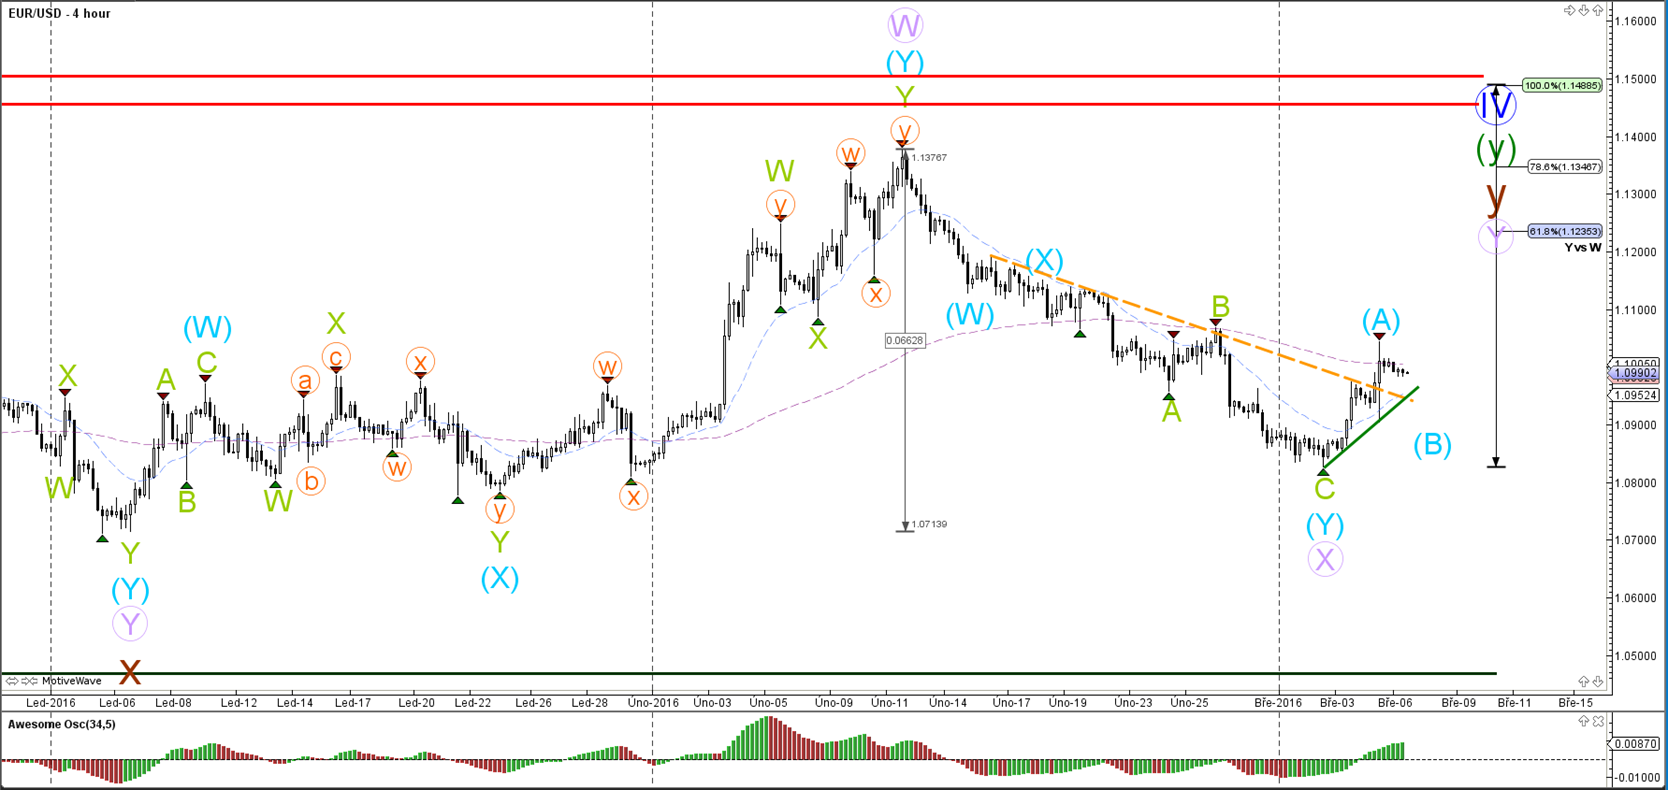
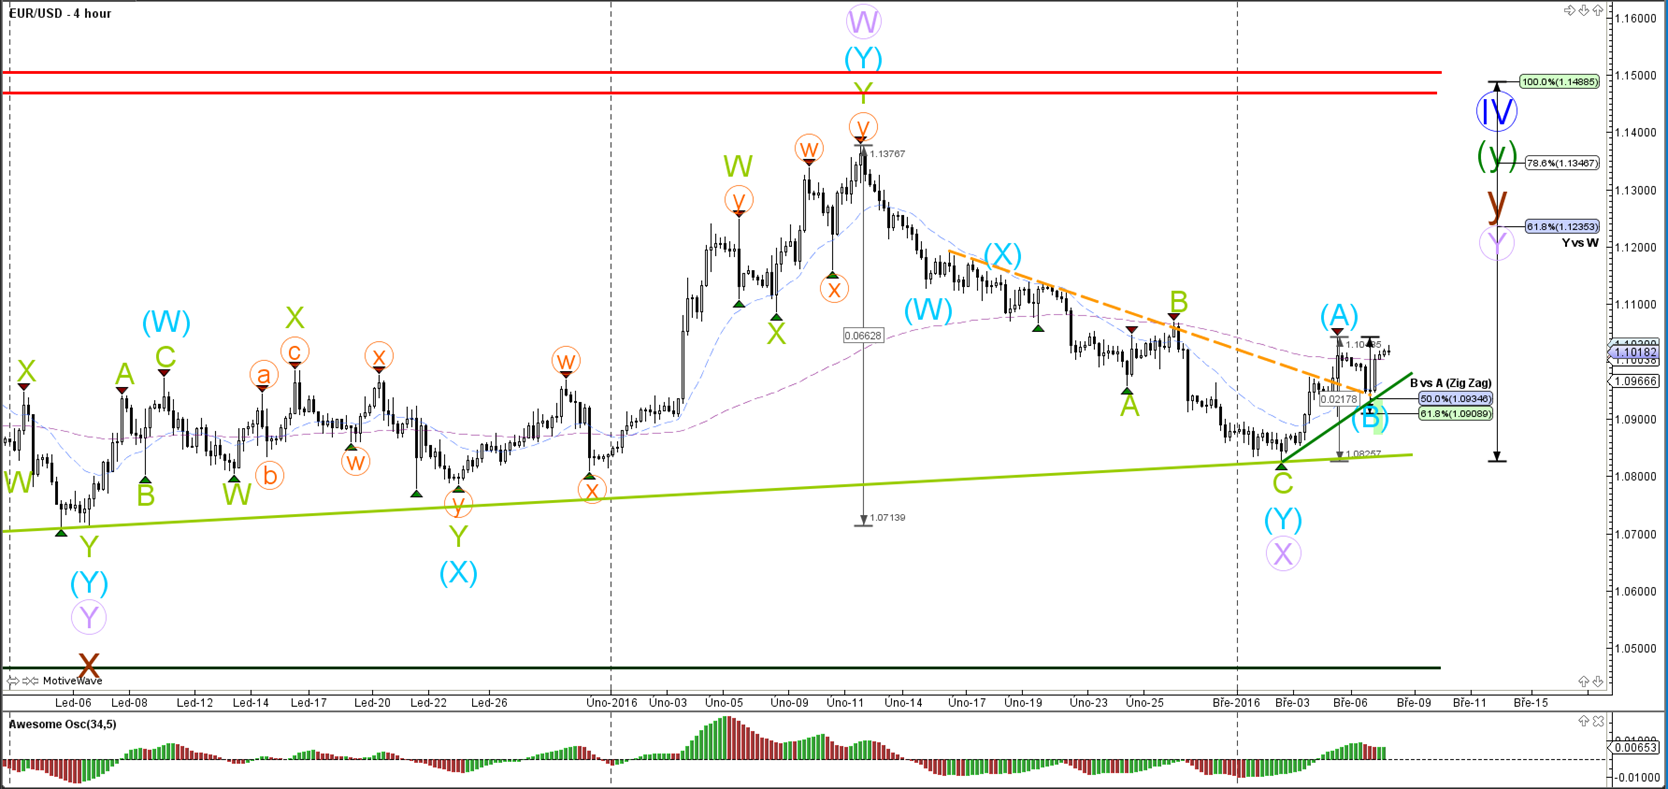
EUR/USD
4 hour

The EUR/USD is approaching potential support levels like the Fibonacci retracements and trend line. This zone could turn out to be a zone where price will show a bullish bounce (if it breaks above resistance) or a bearish break (if it breaks below support).
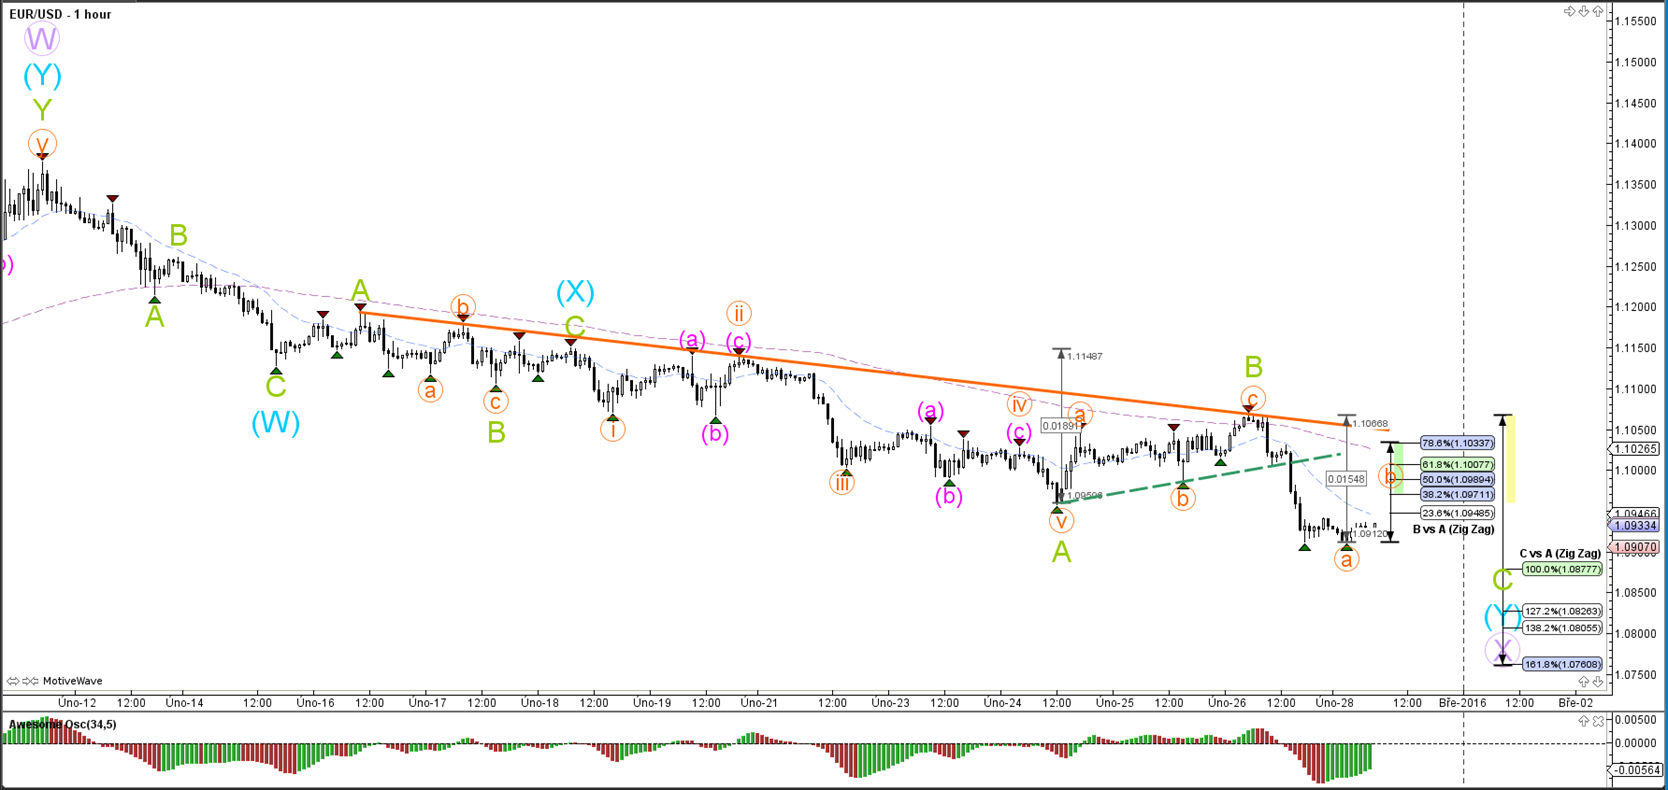
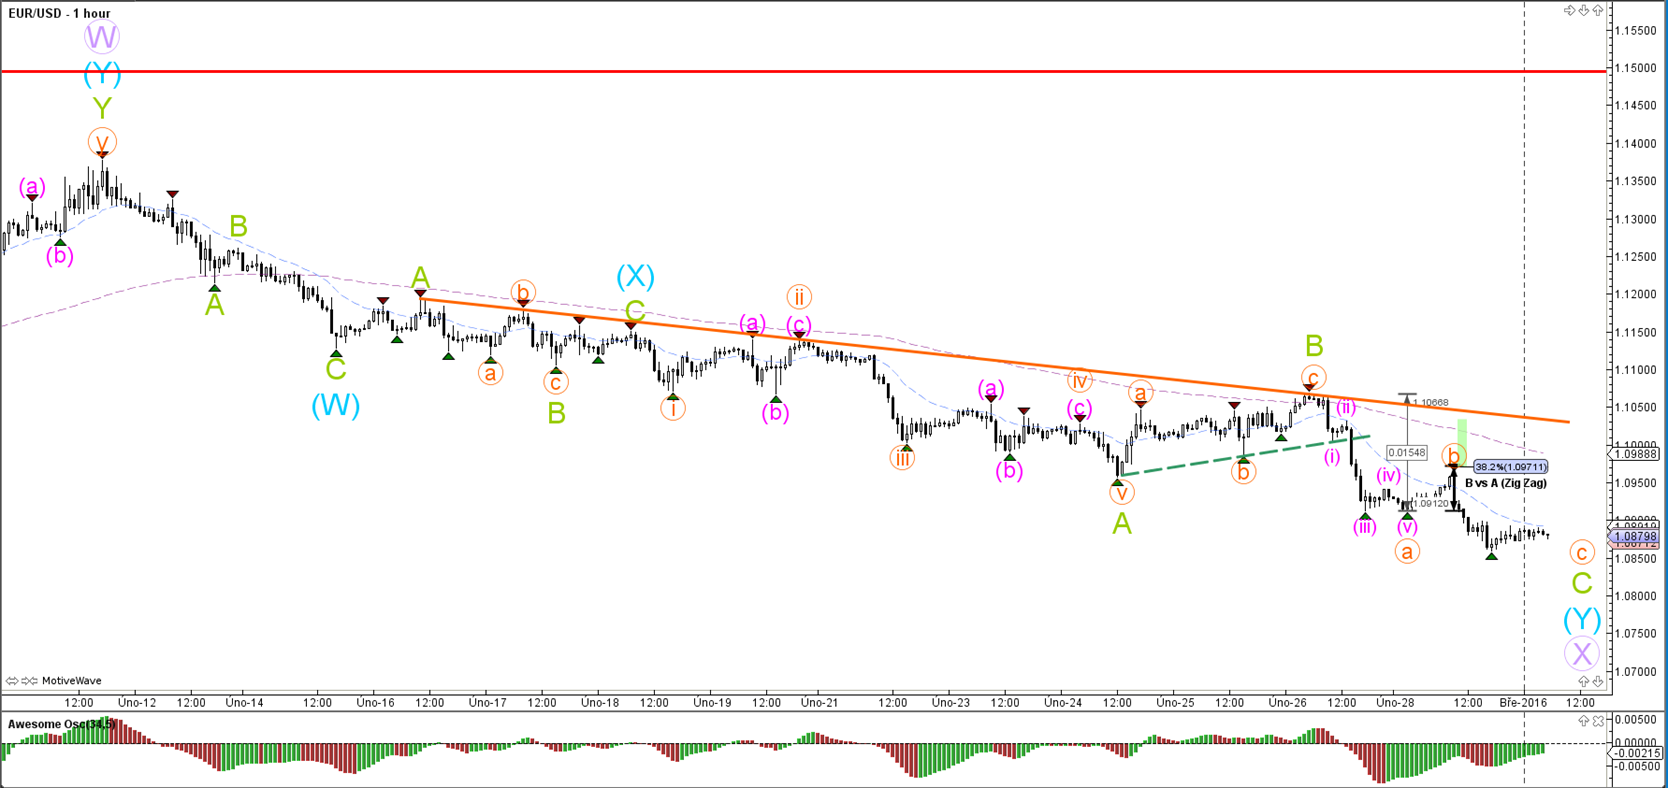
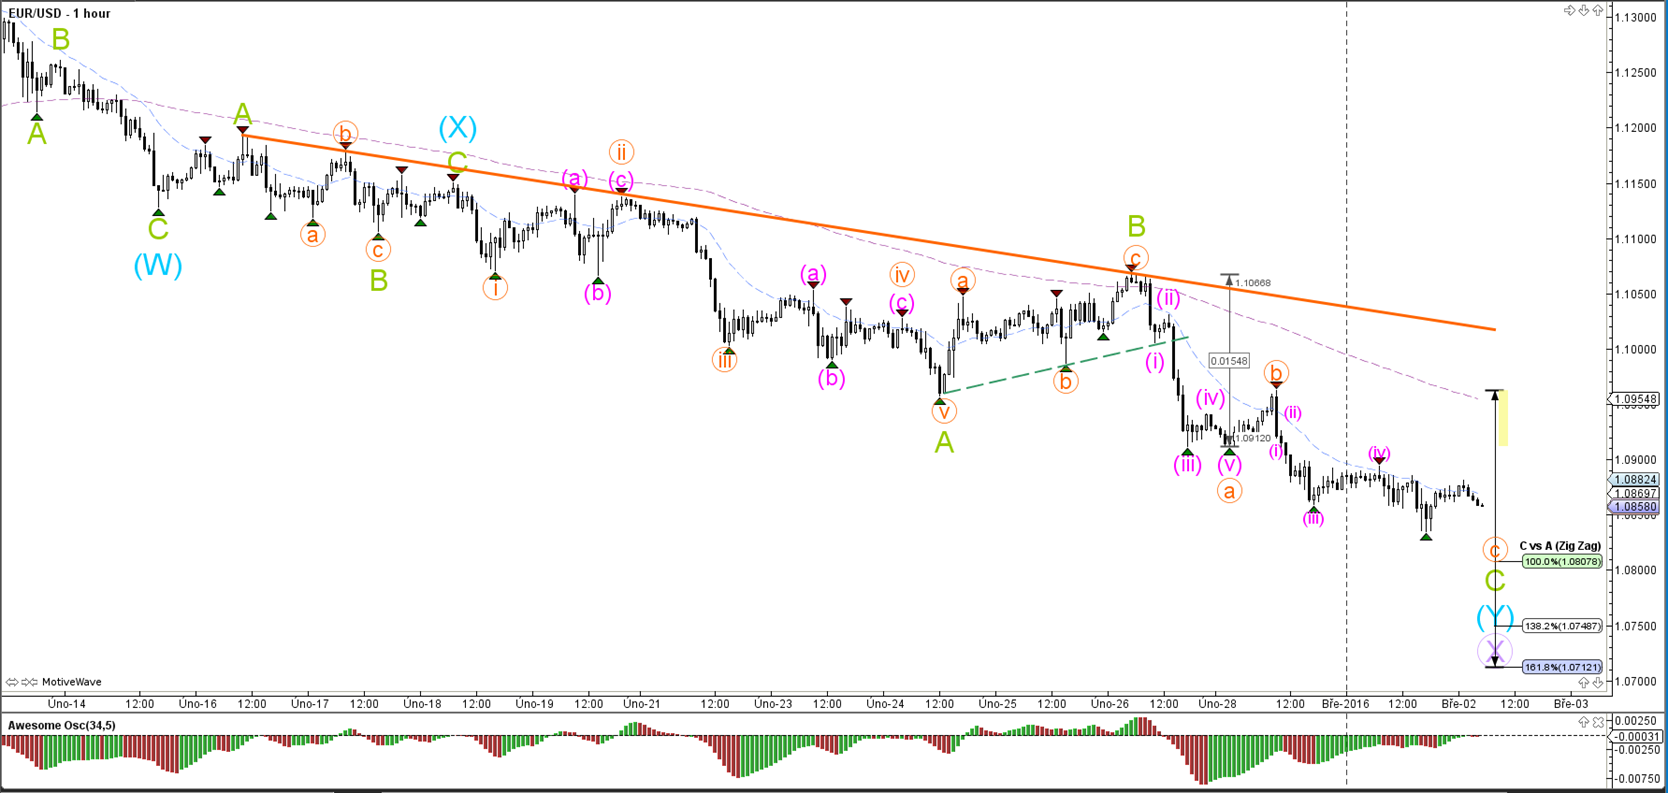
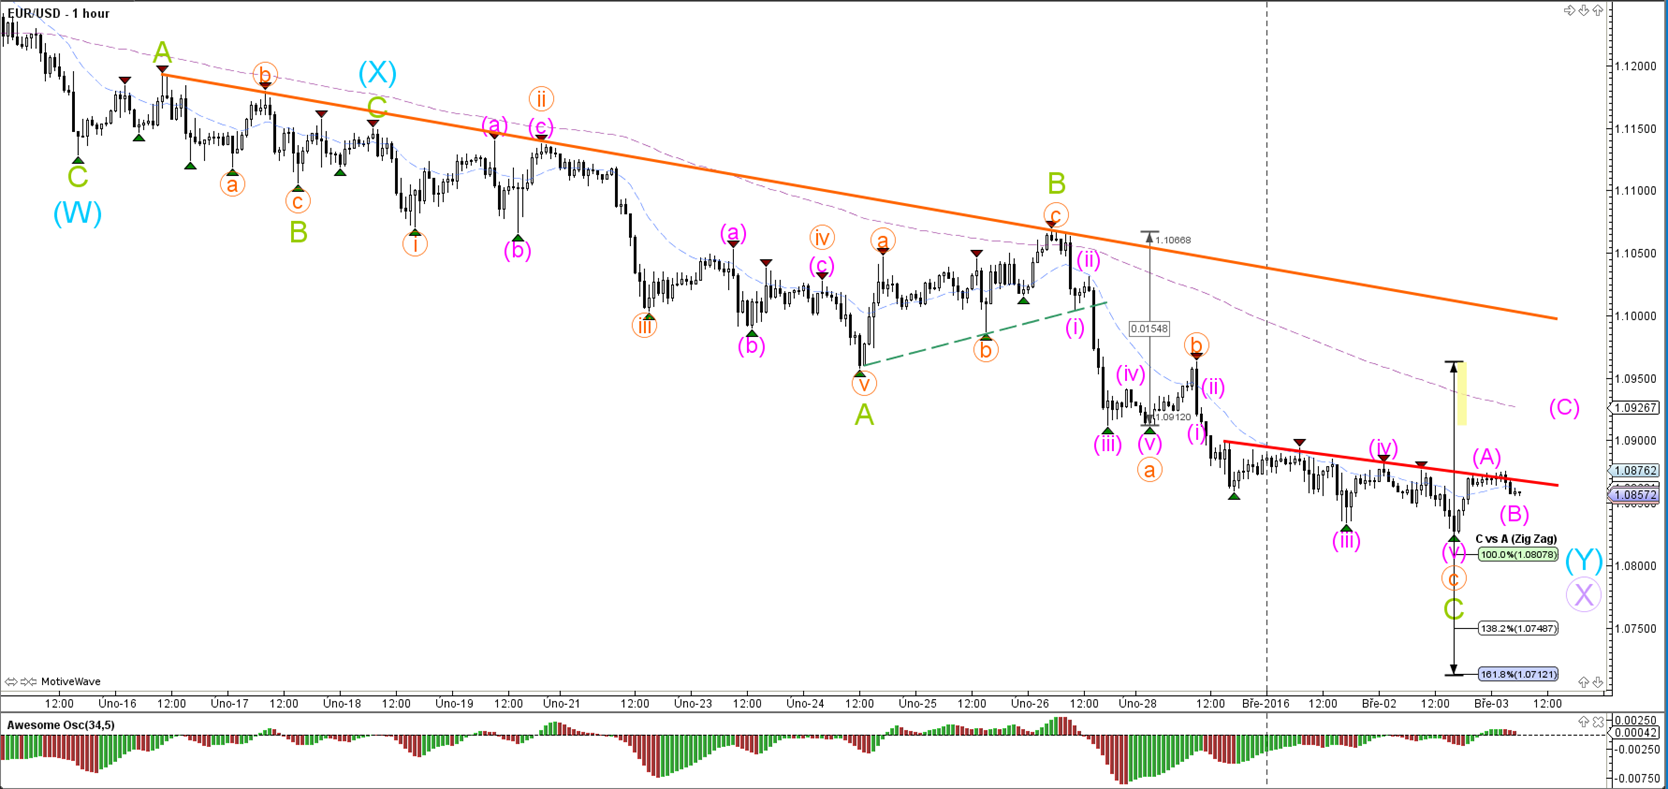
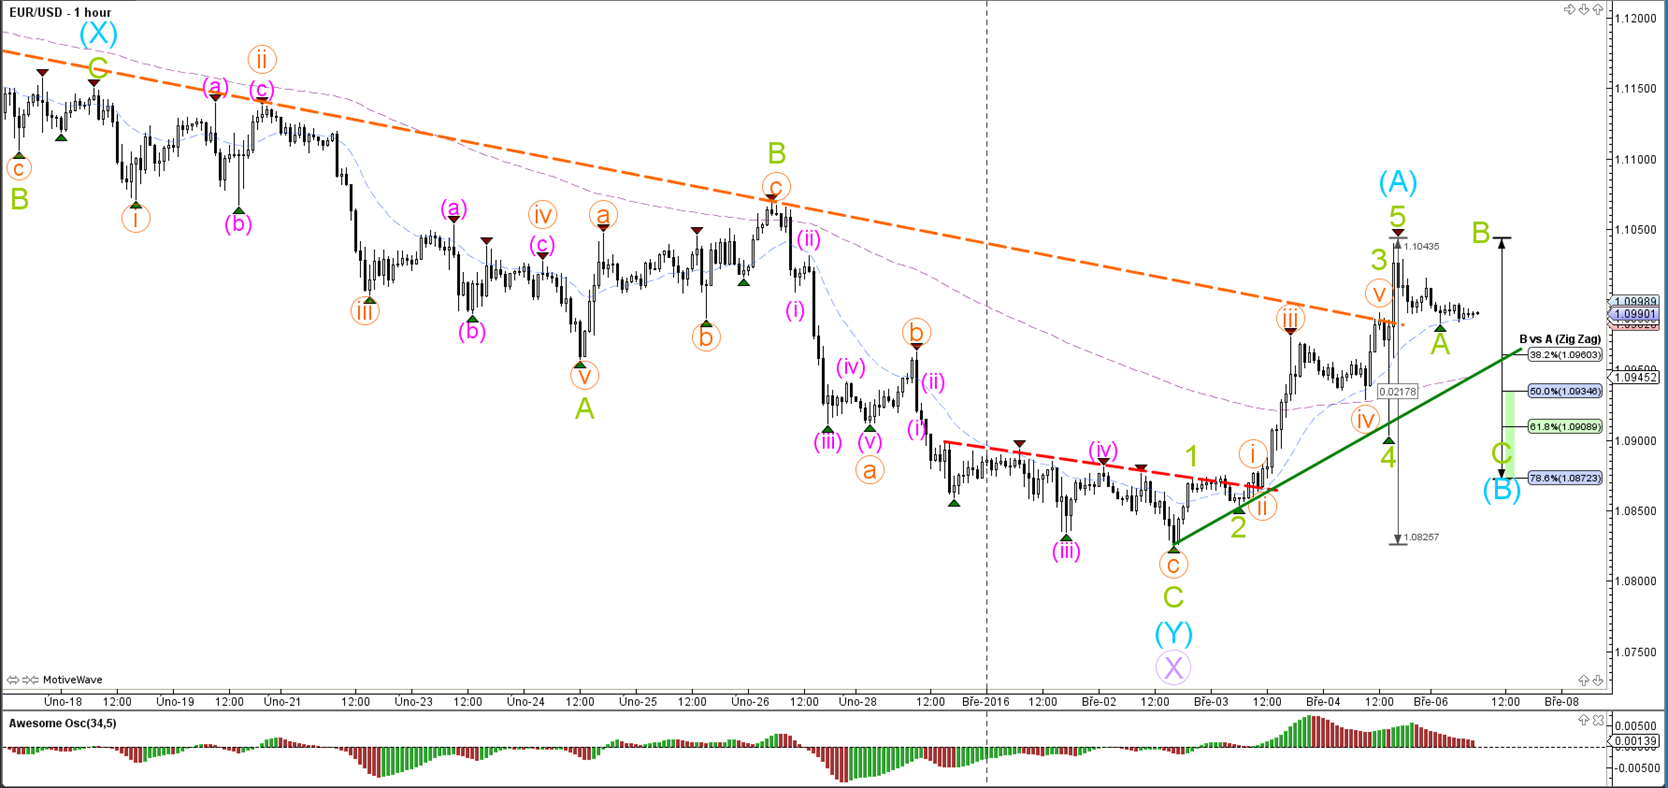
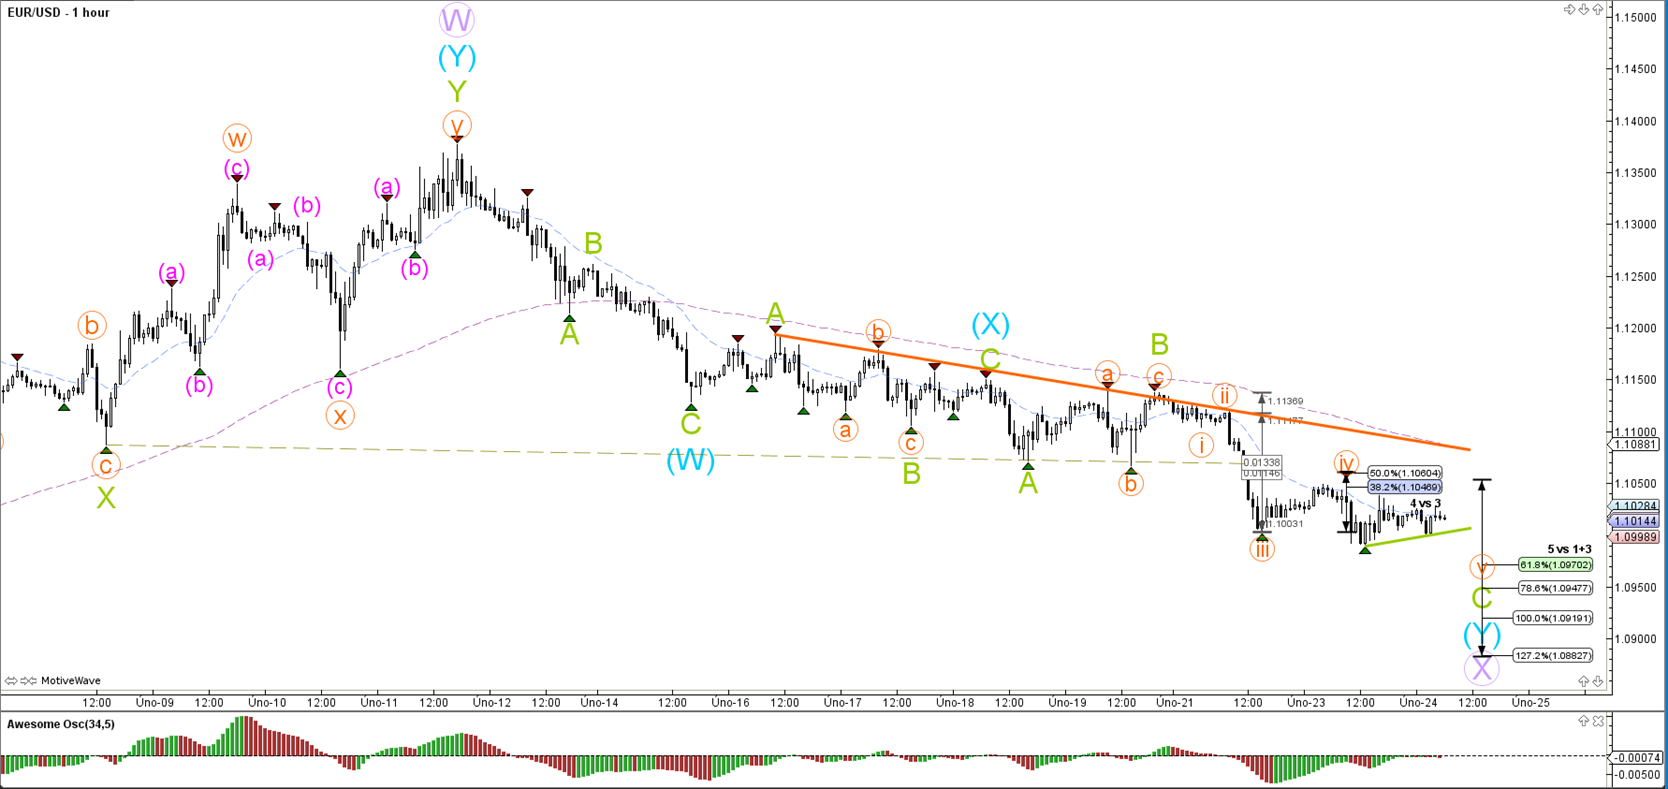
1 hour

The EUR/USD respected the Fibonacci levels of wave 4 (orange) and has turned bearish as part of wave 5. A break above the resistance trend line (orange) could indicate the completion of wave X (purple).
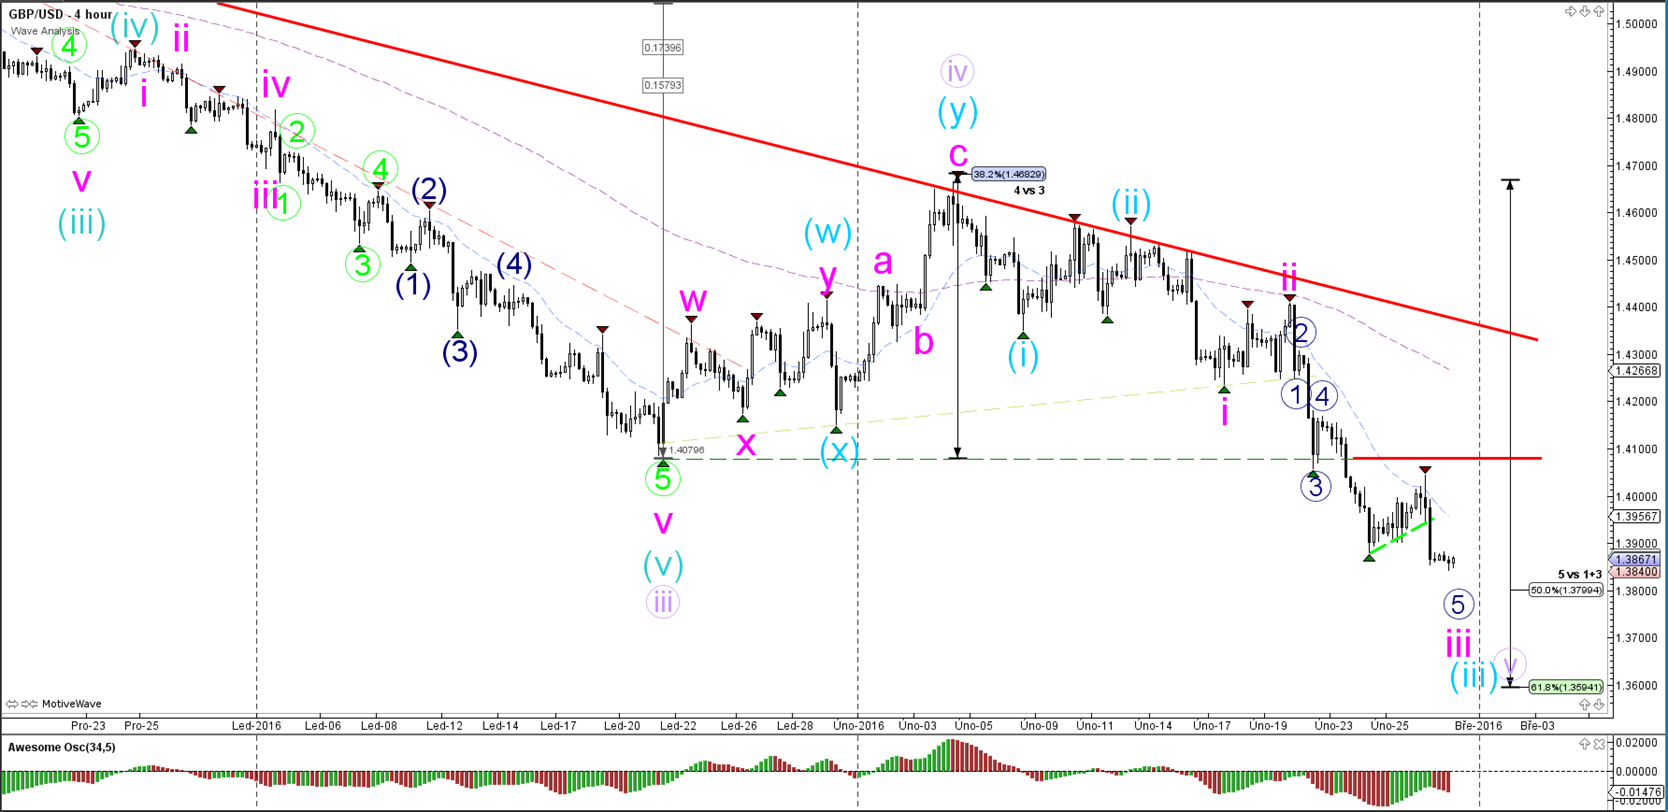
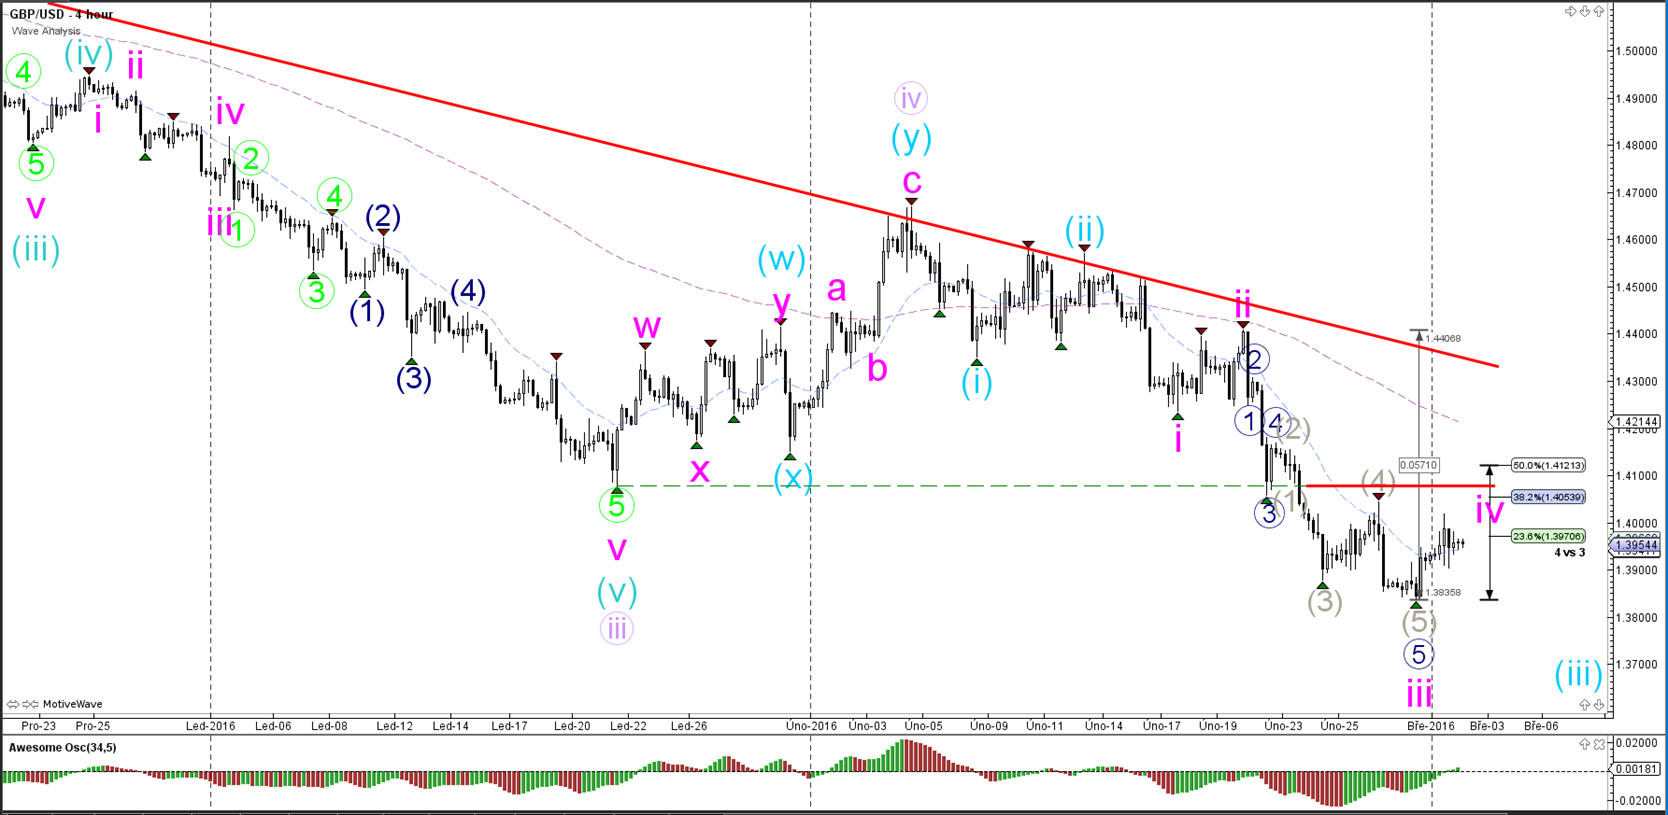
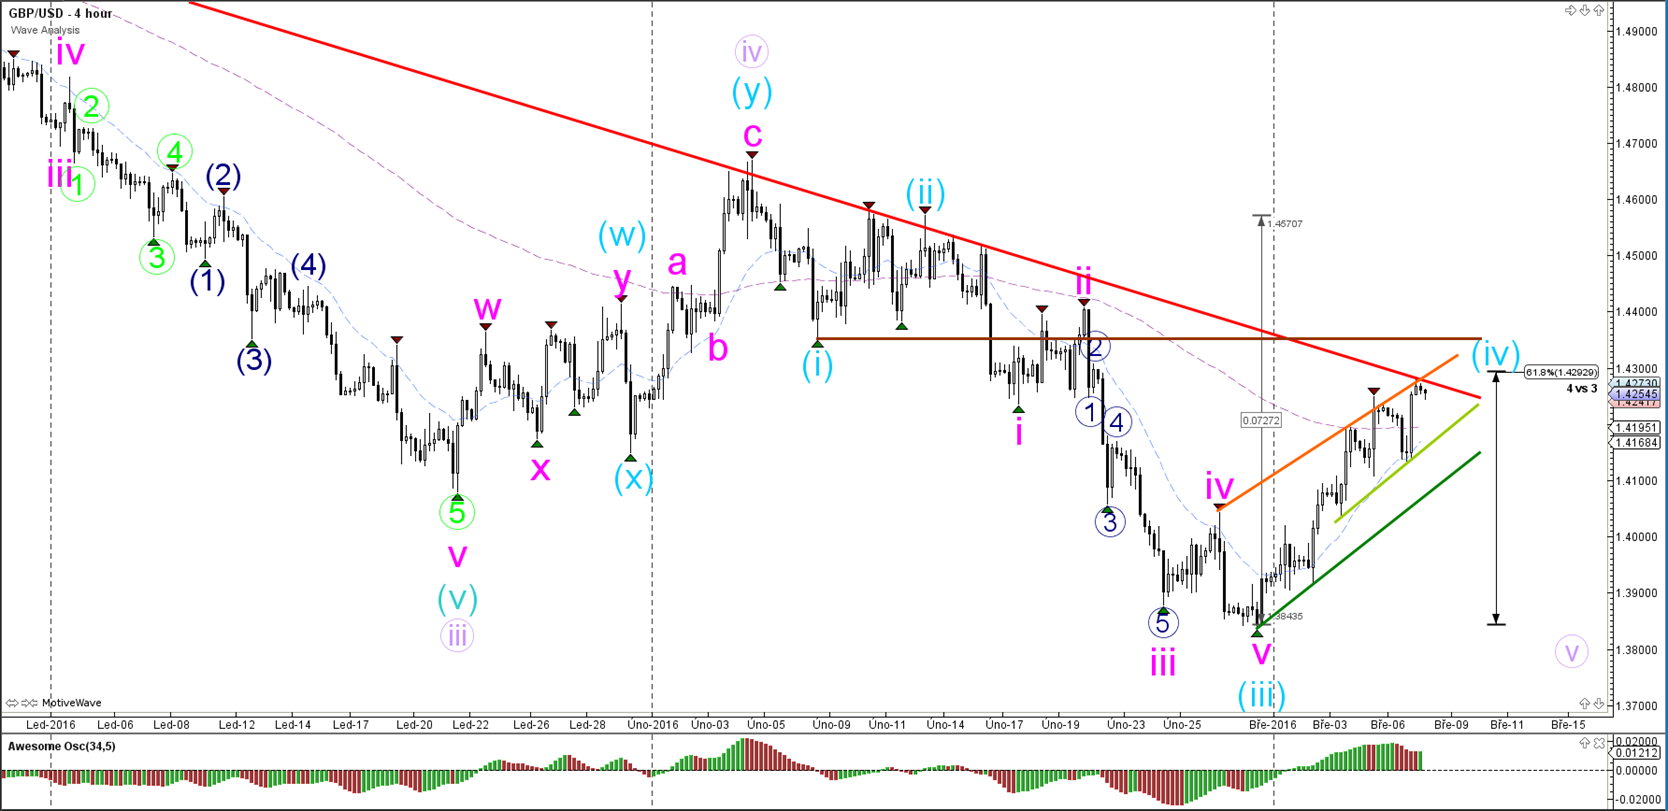
GBP/USD
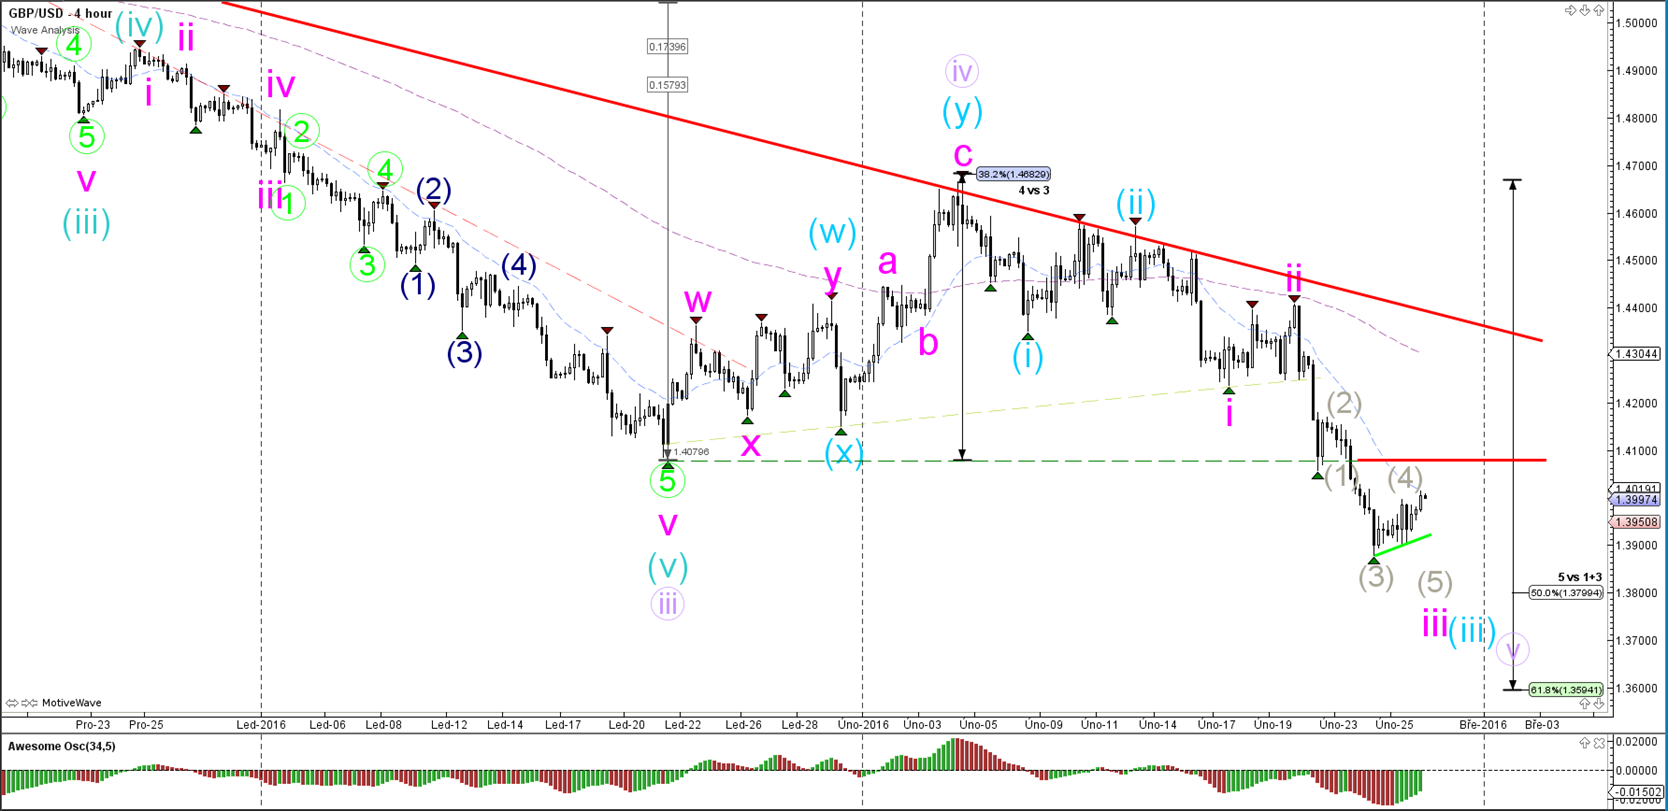
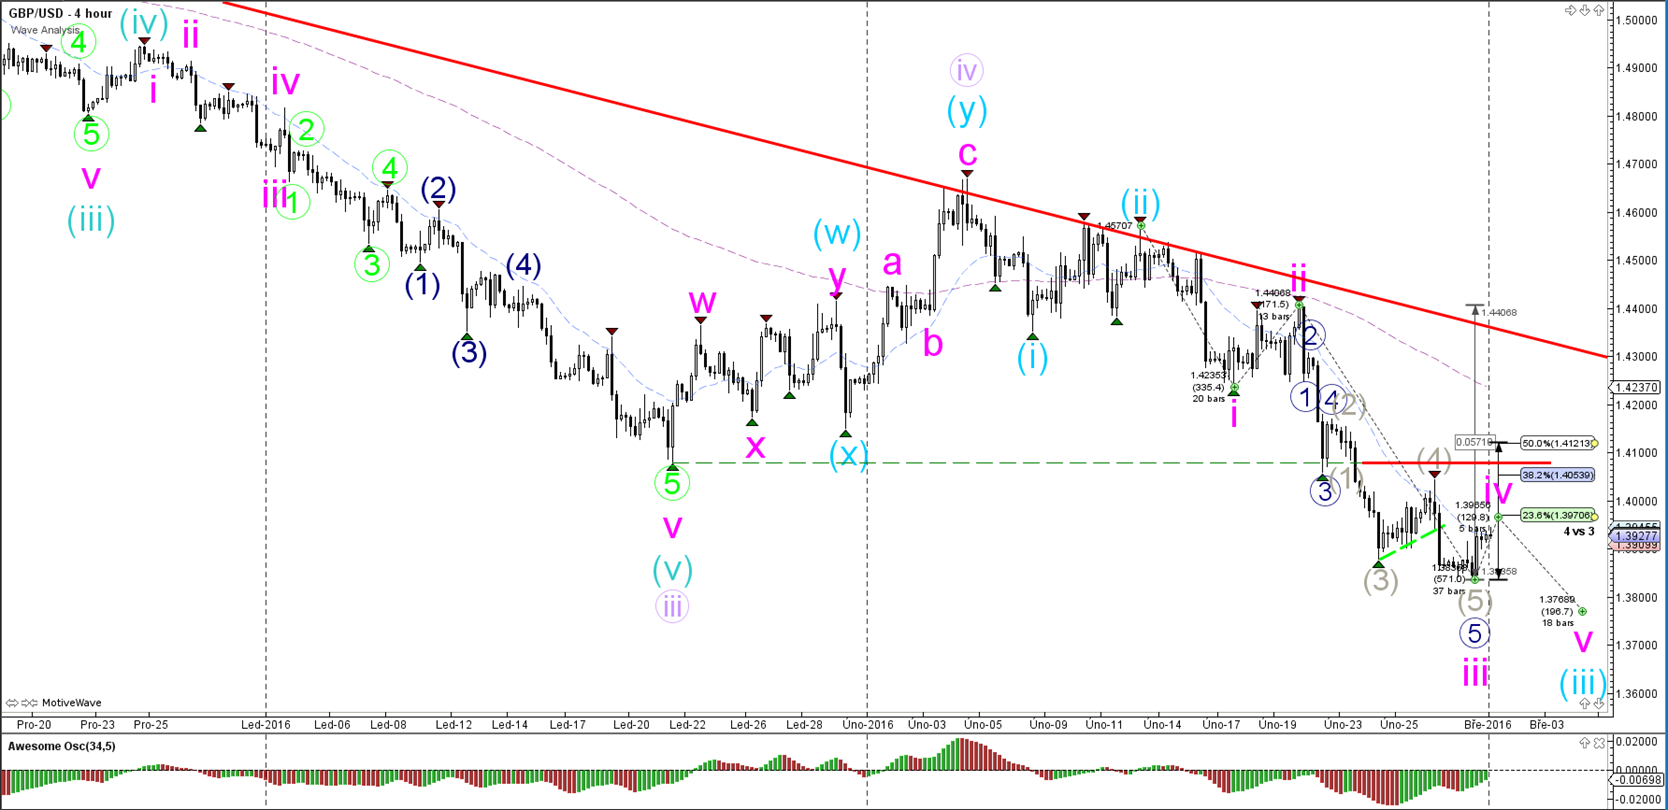
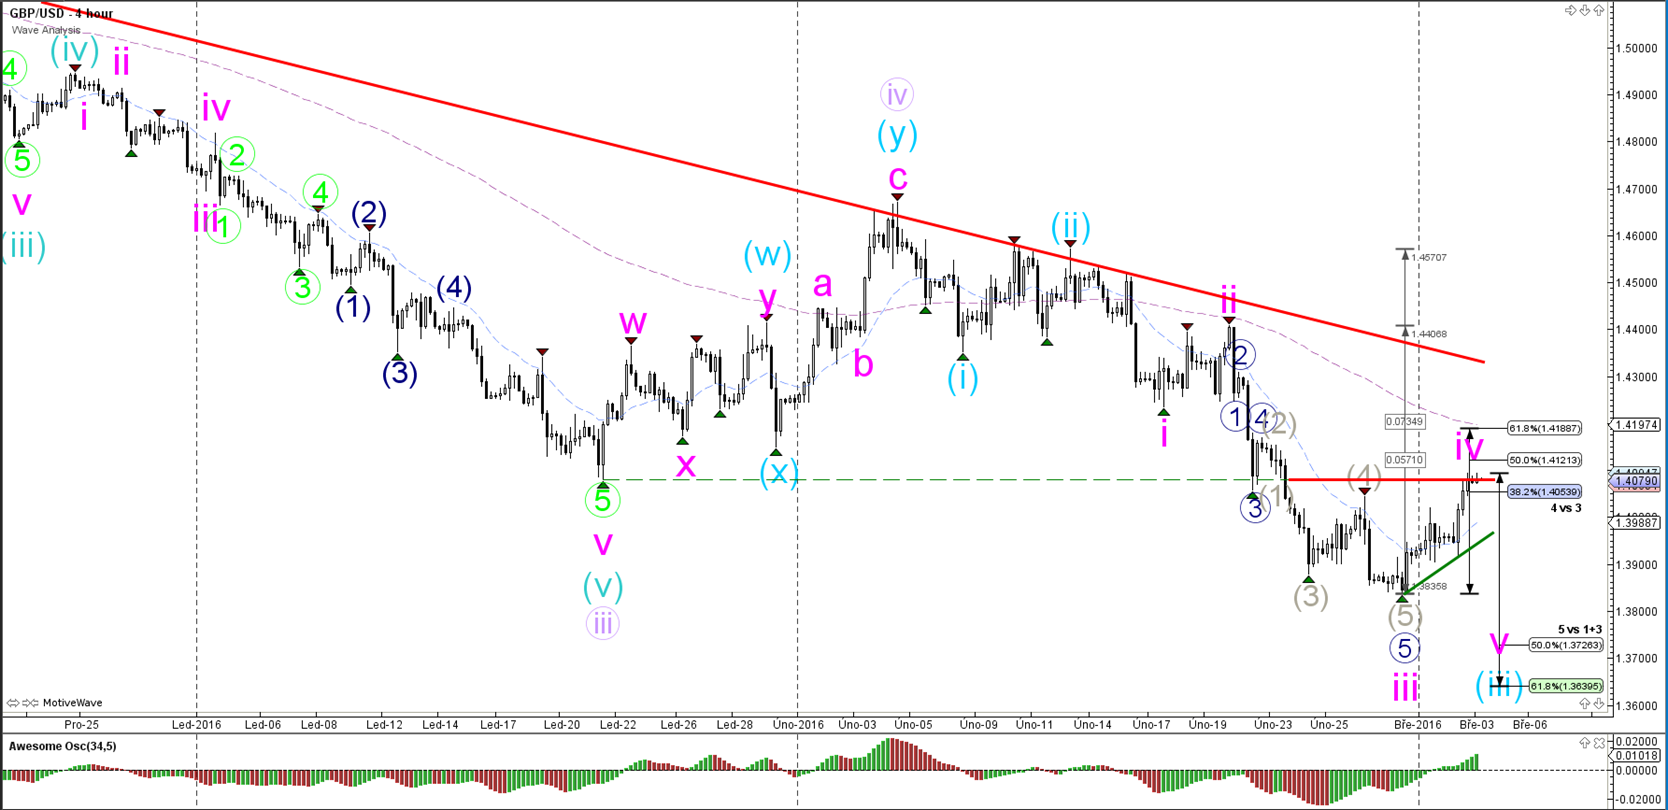
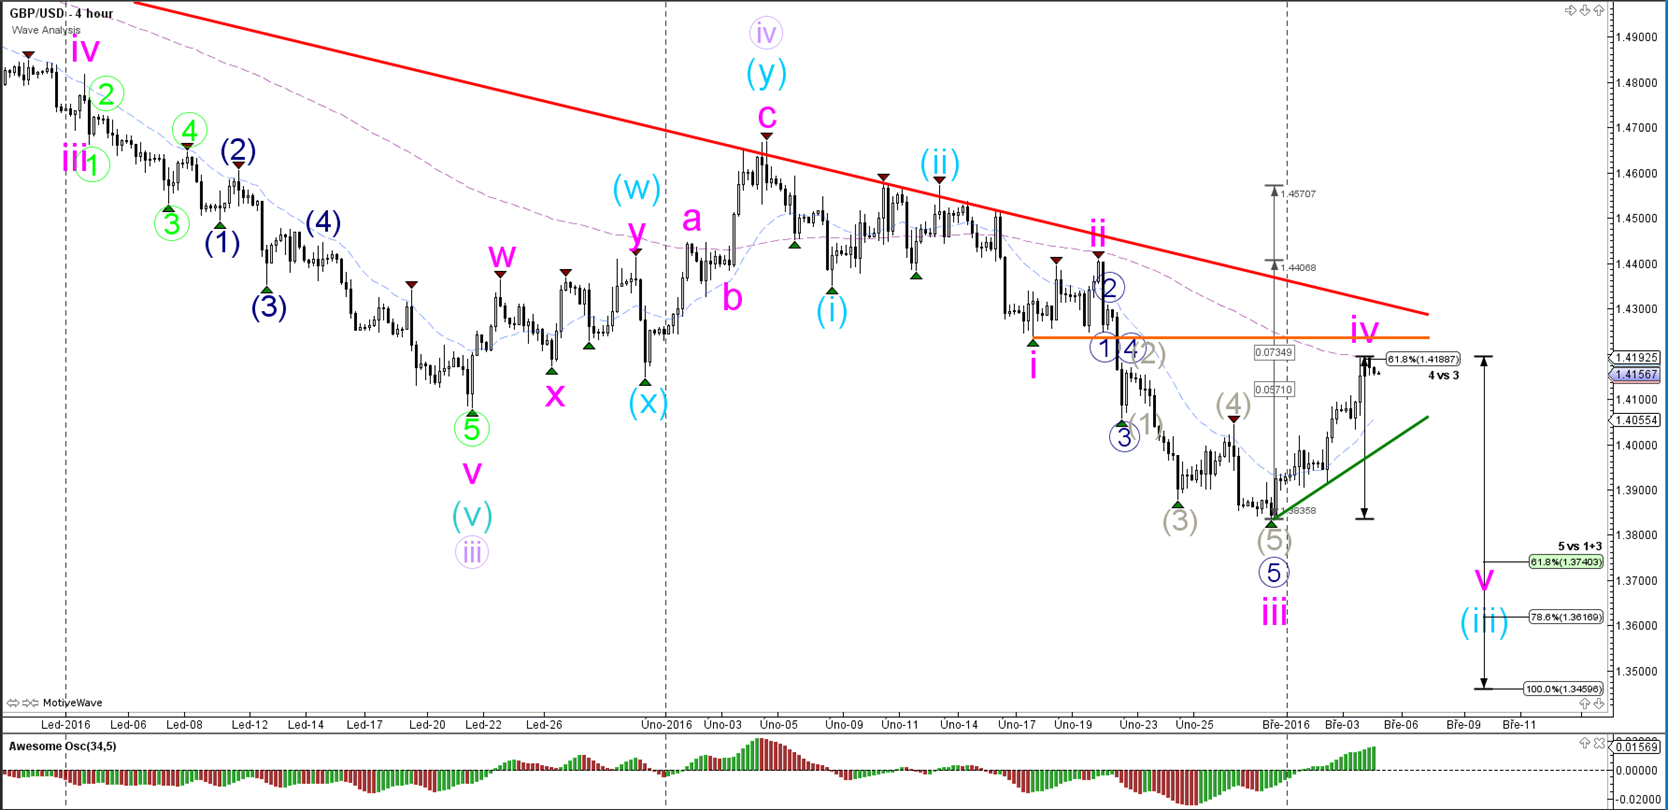
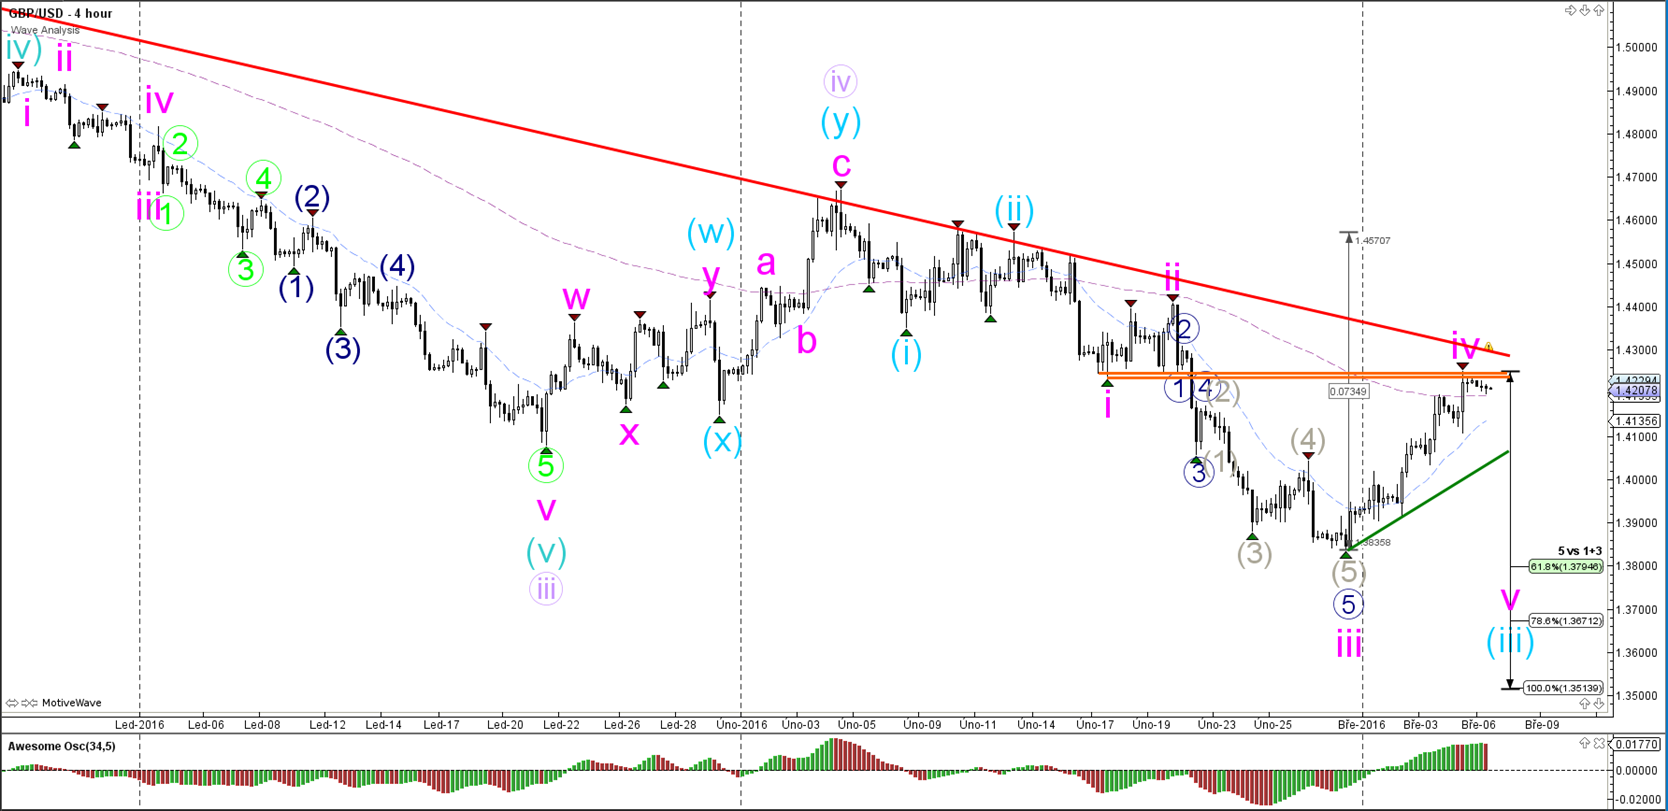
4 hour

The GBP/USD broke the bottom (dotted green) and has continued with its bearish momentum and trend.
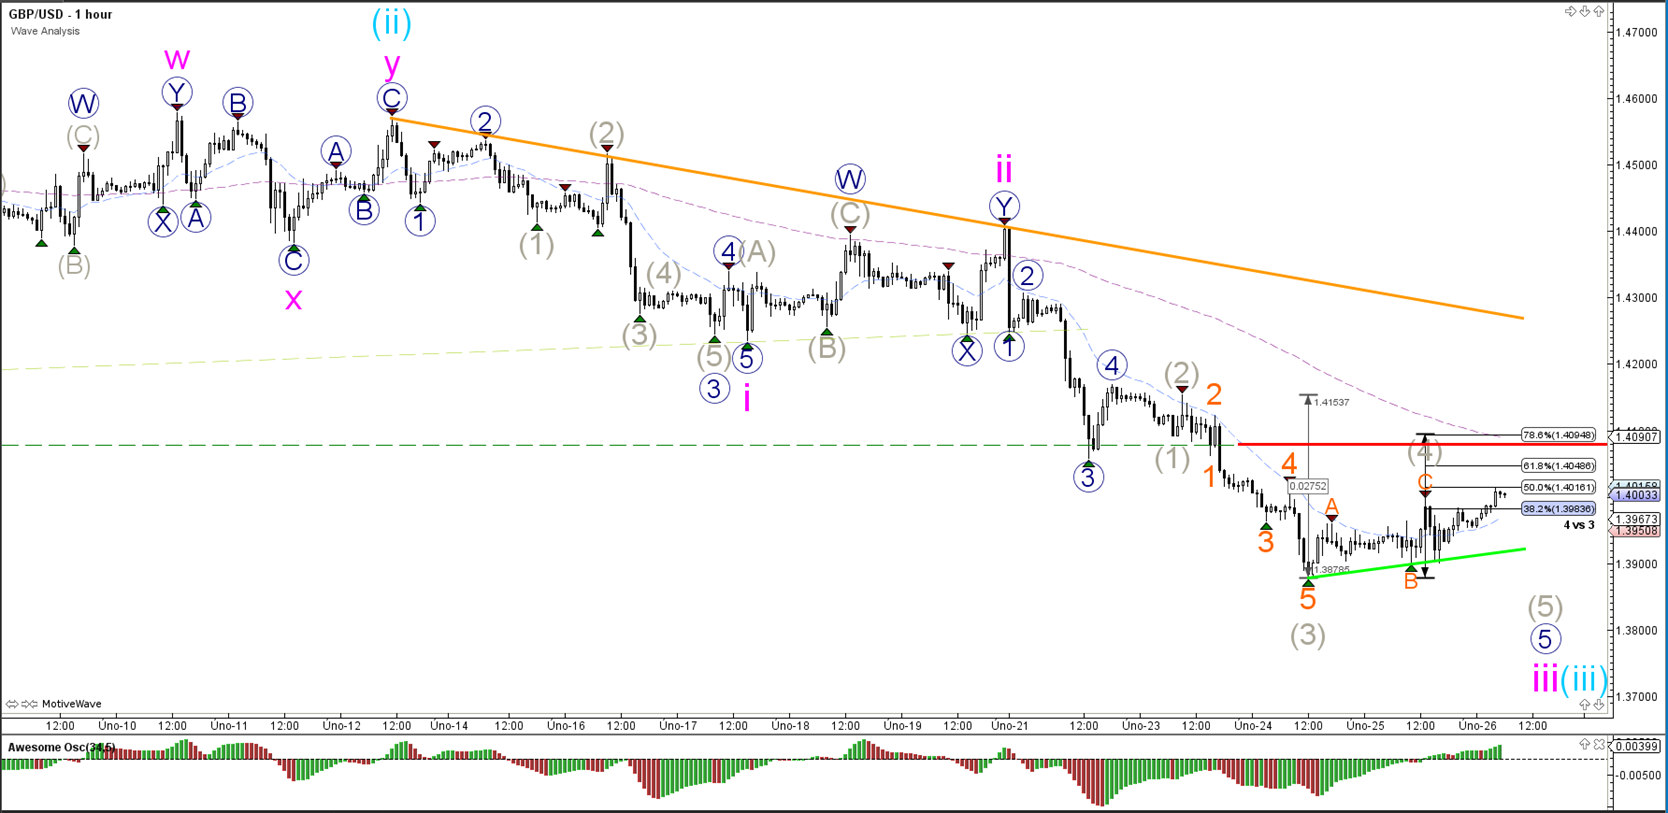
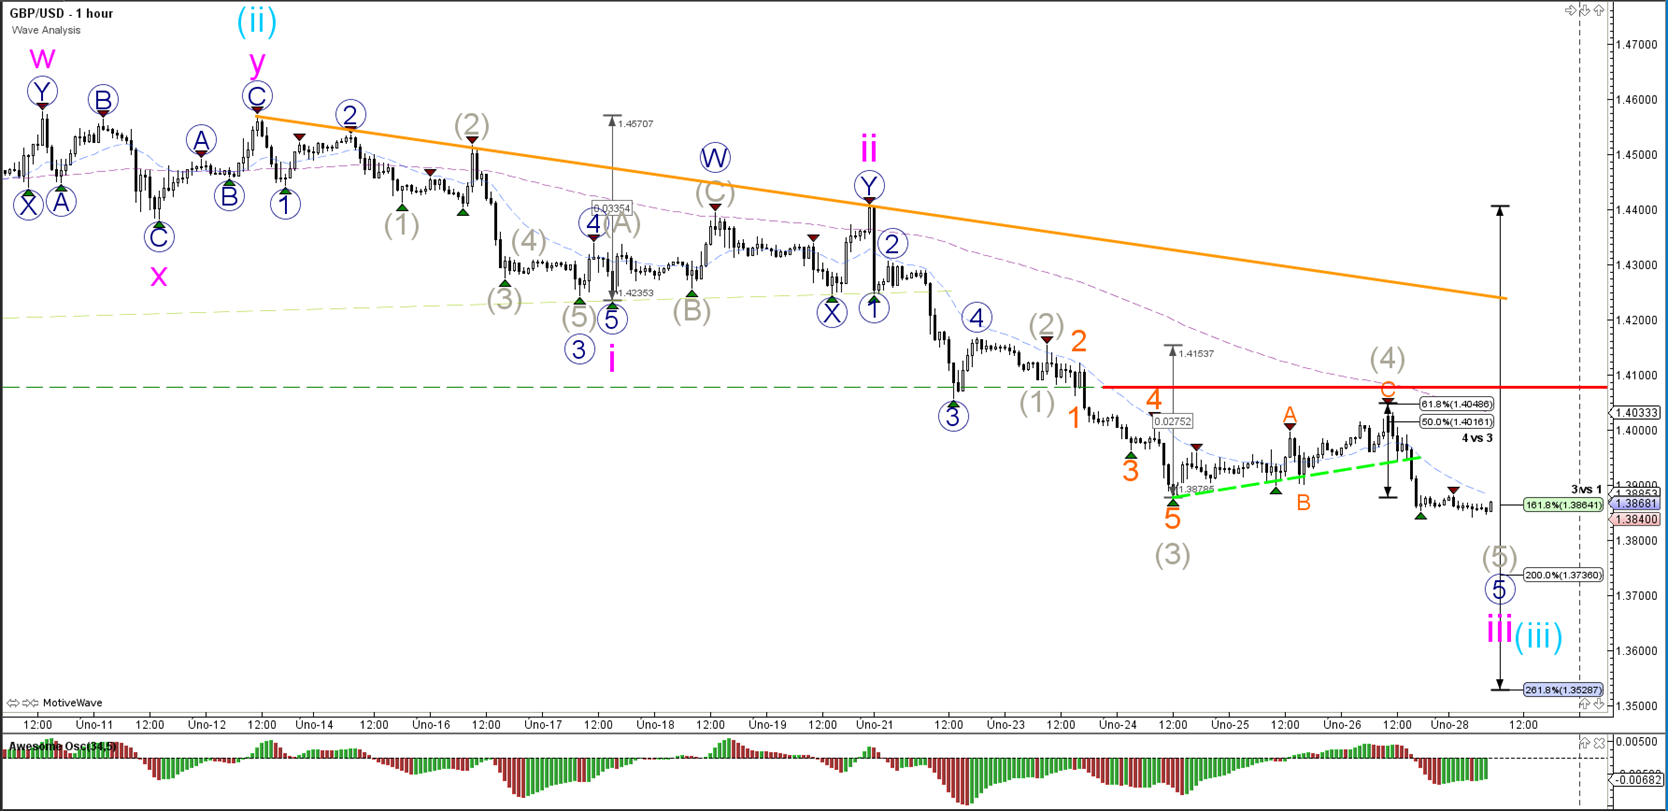
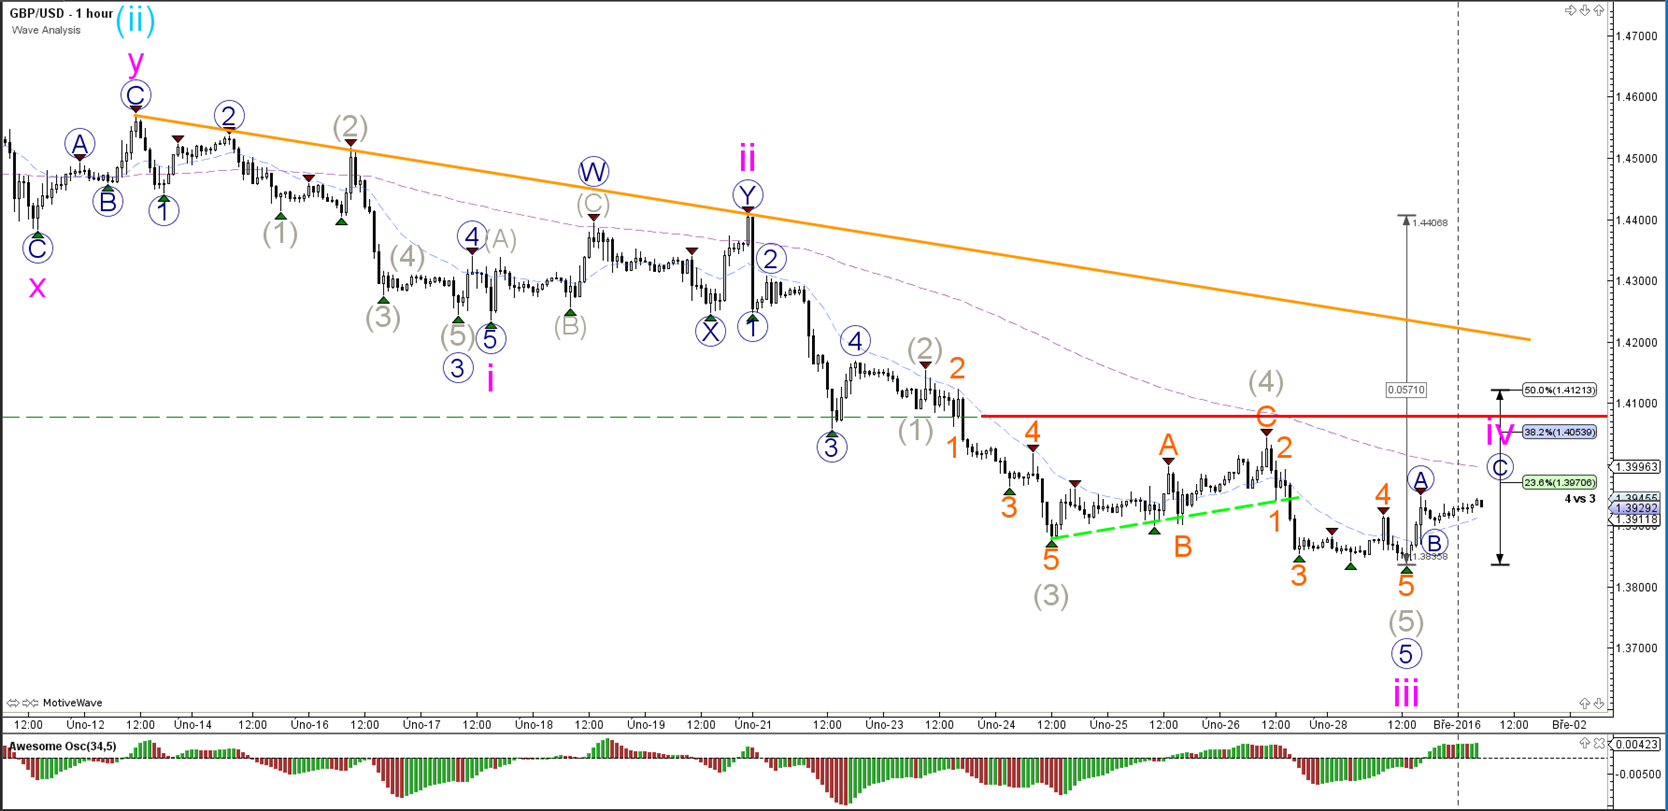
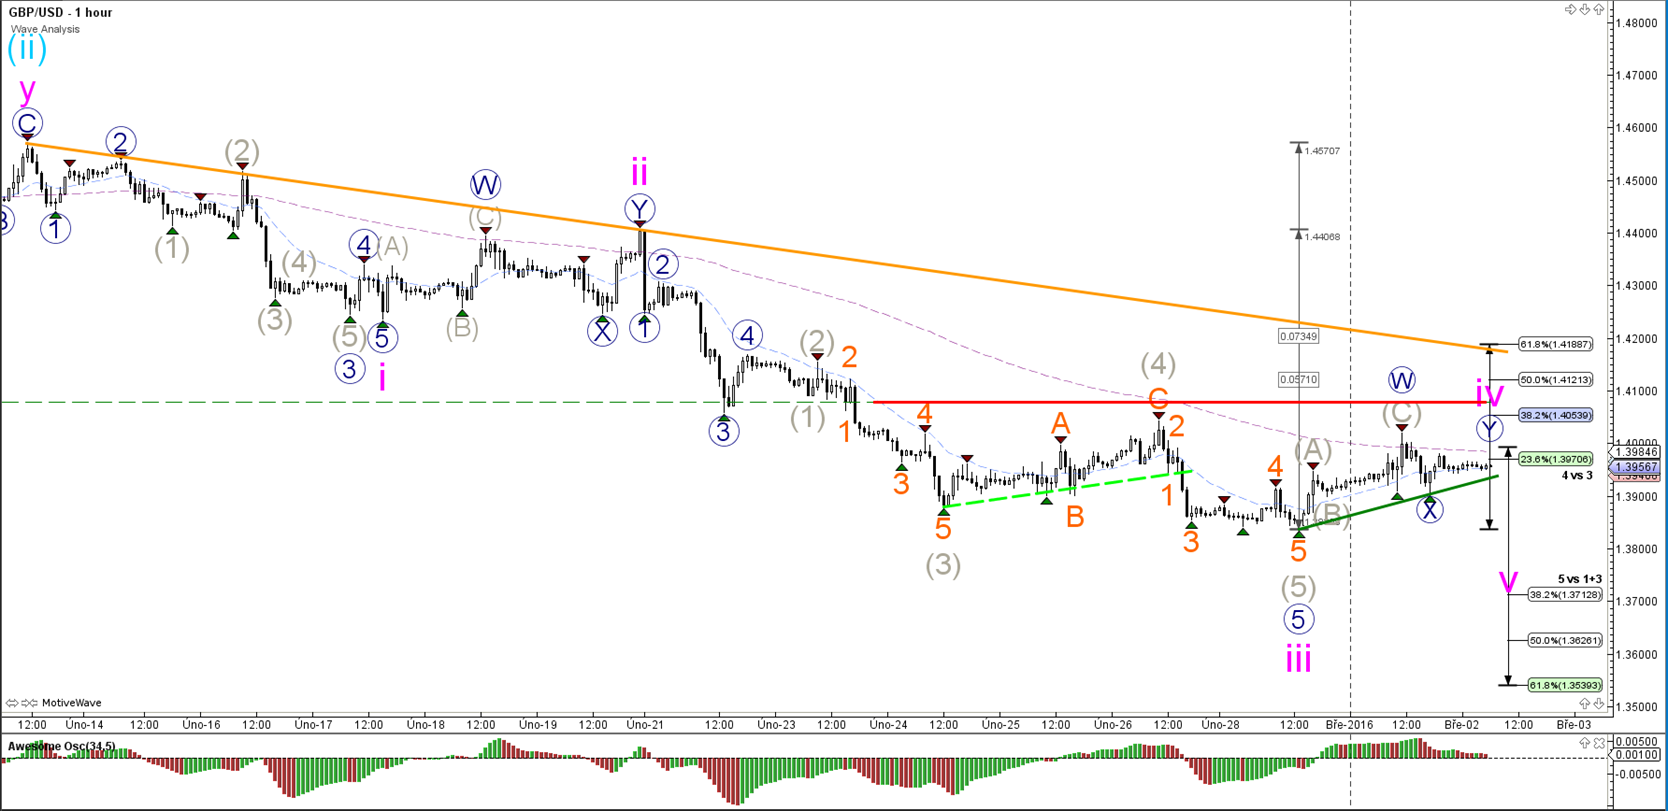
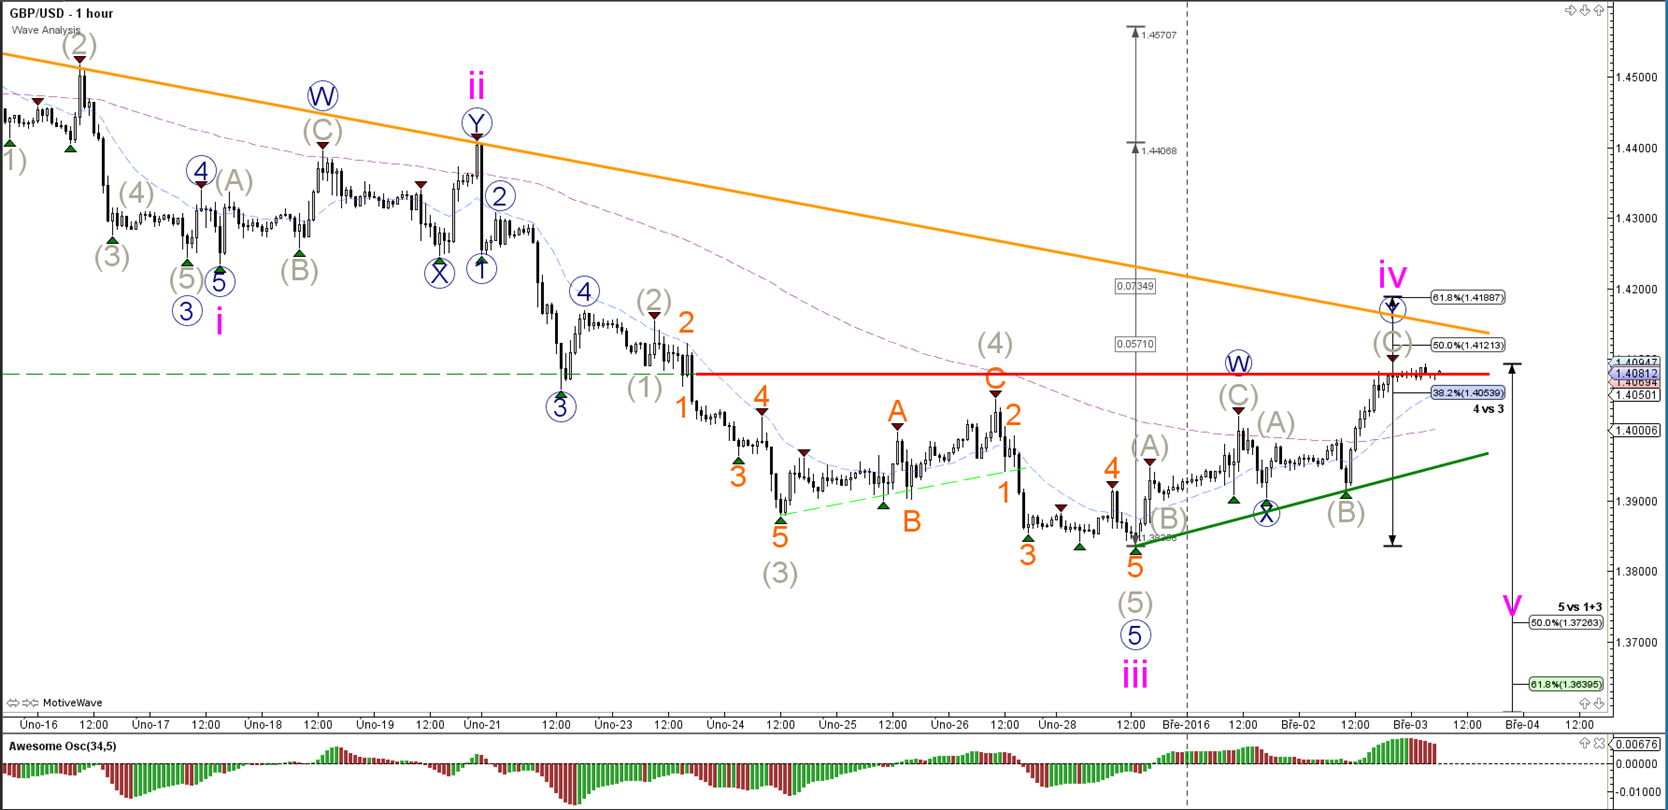
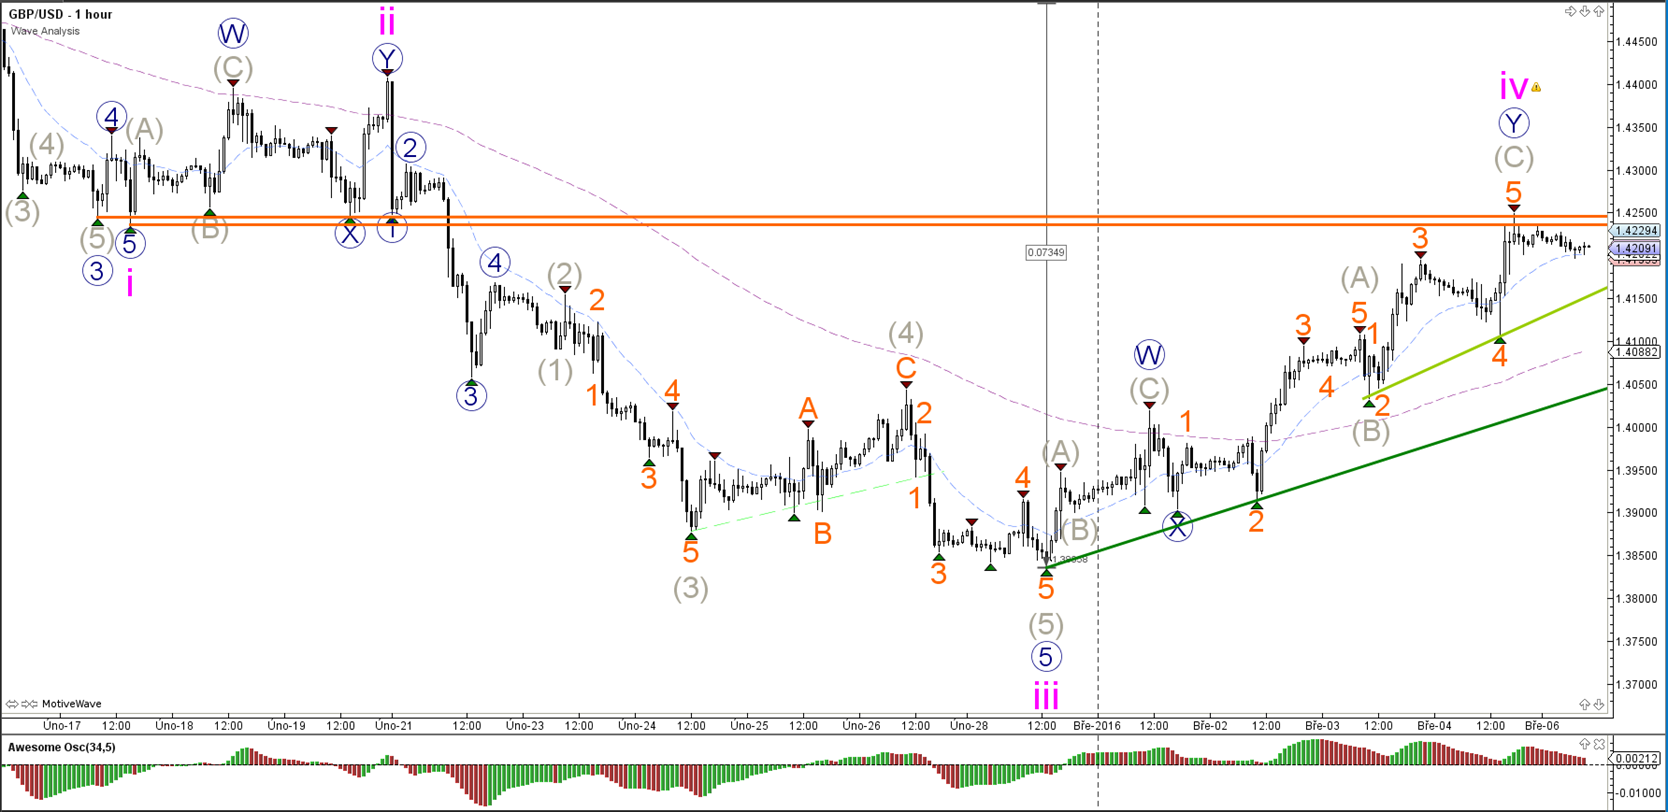
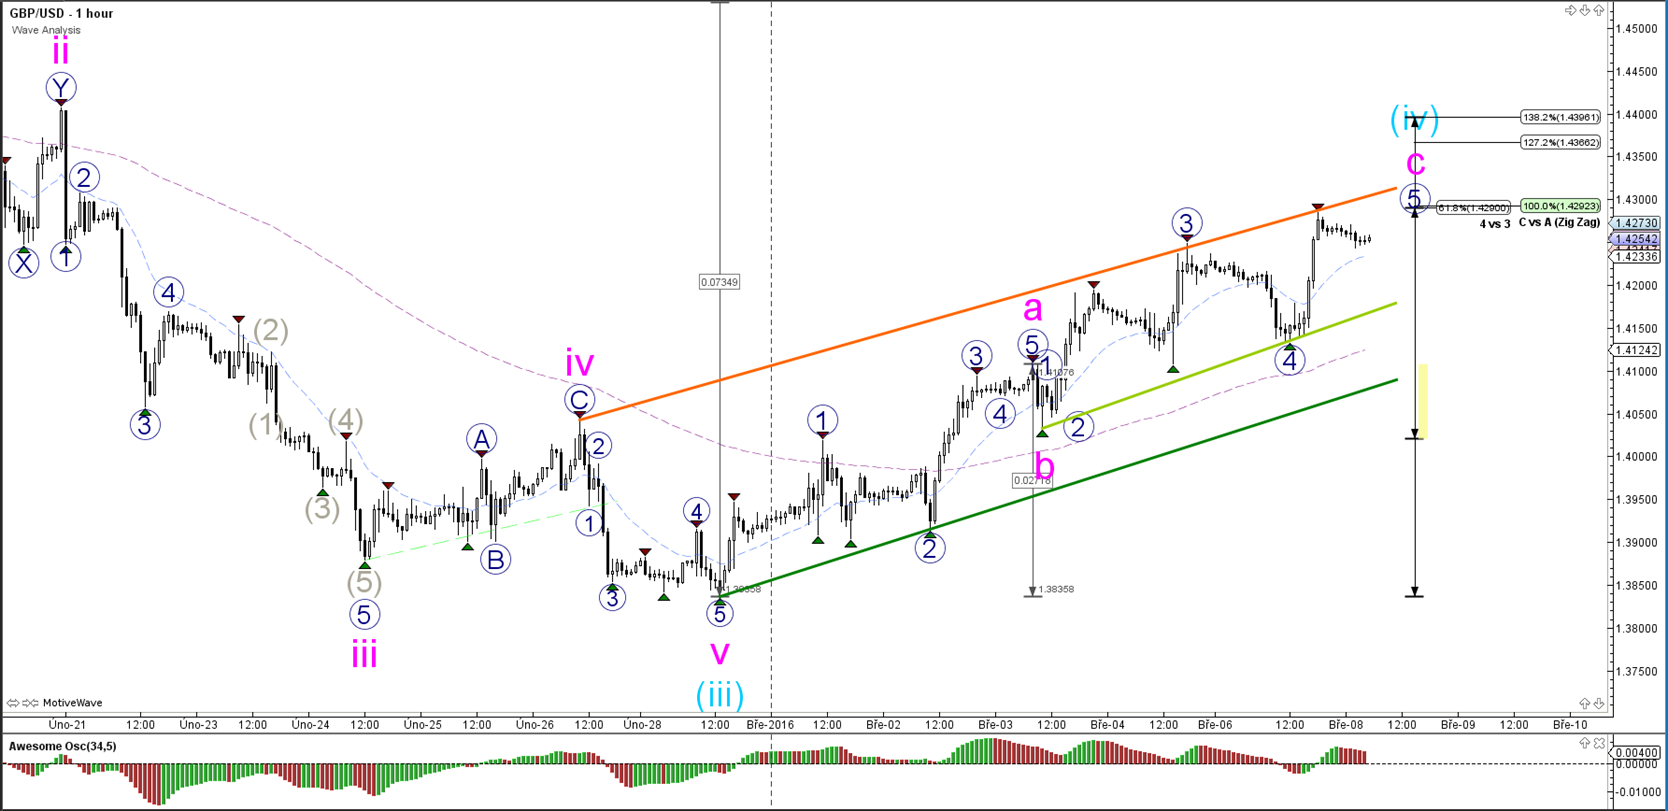
1 hour

The GBP/USD respected the shallow Fibonacci levels of the wave 4 (blue) and price is moving lower as part of the 5th wave (blue) towards Fibonacci targets to complete most likely wave 3 (pink).
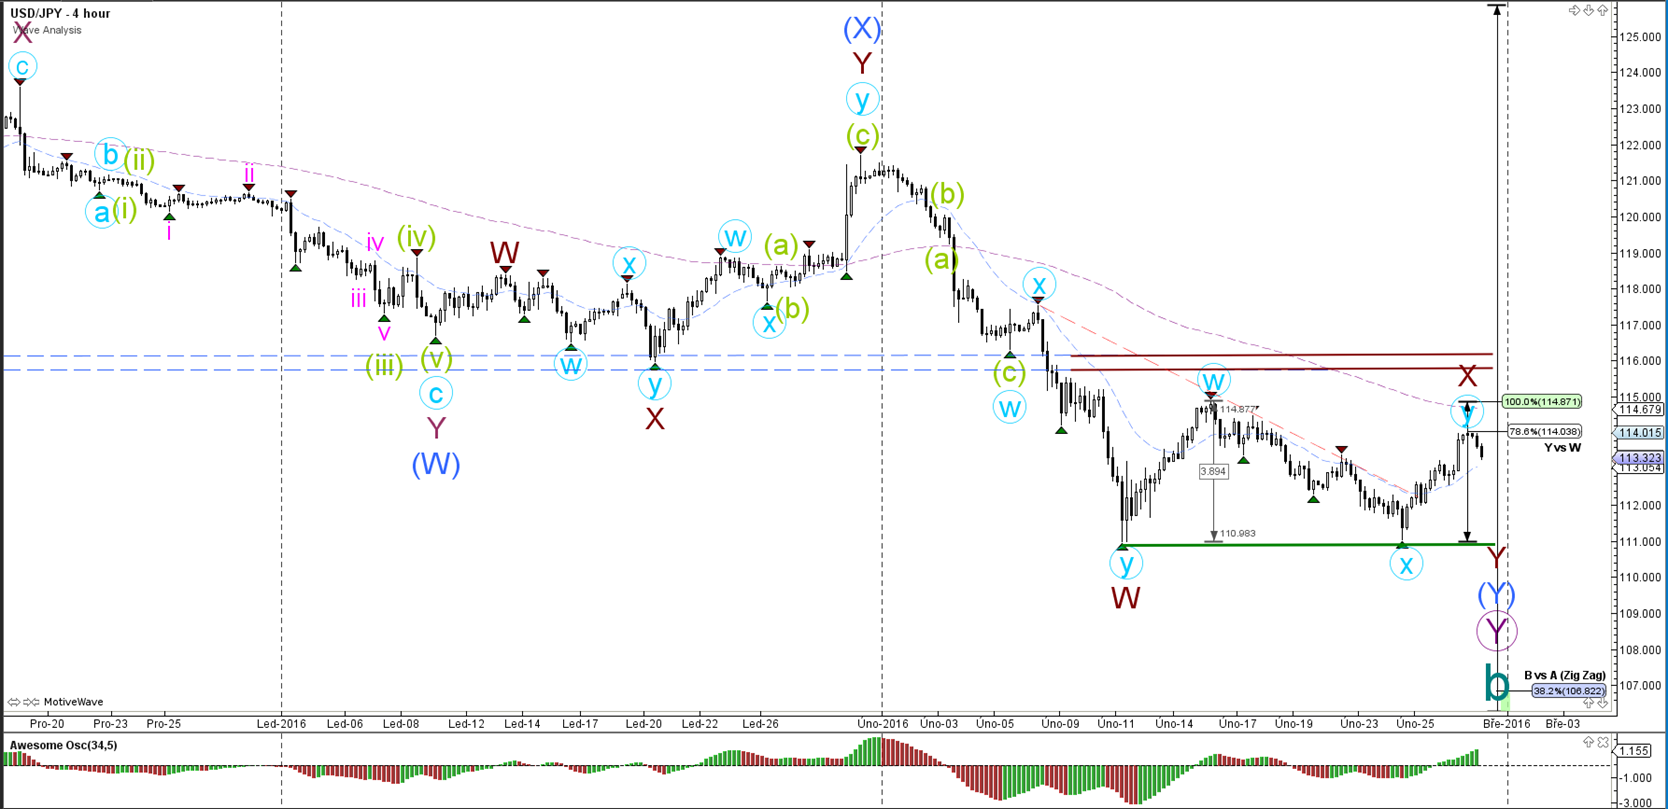
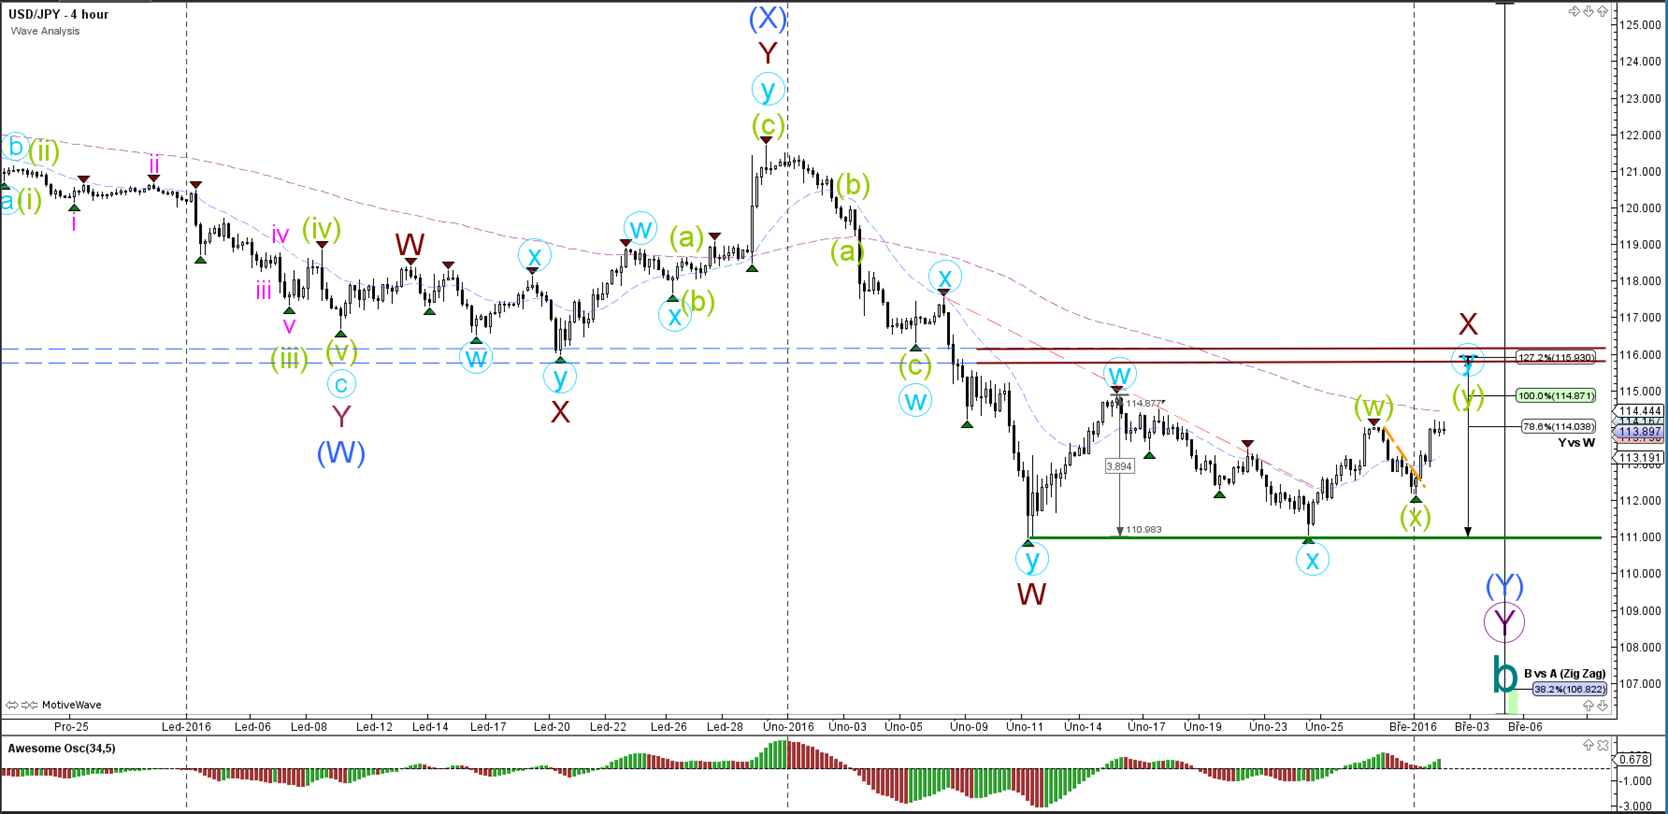
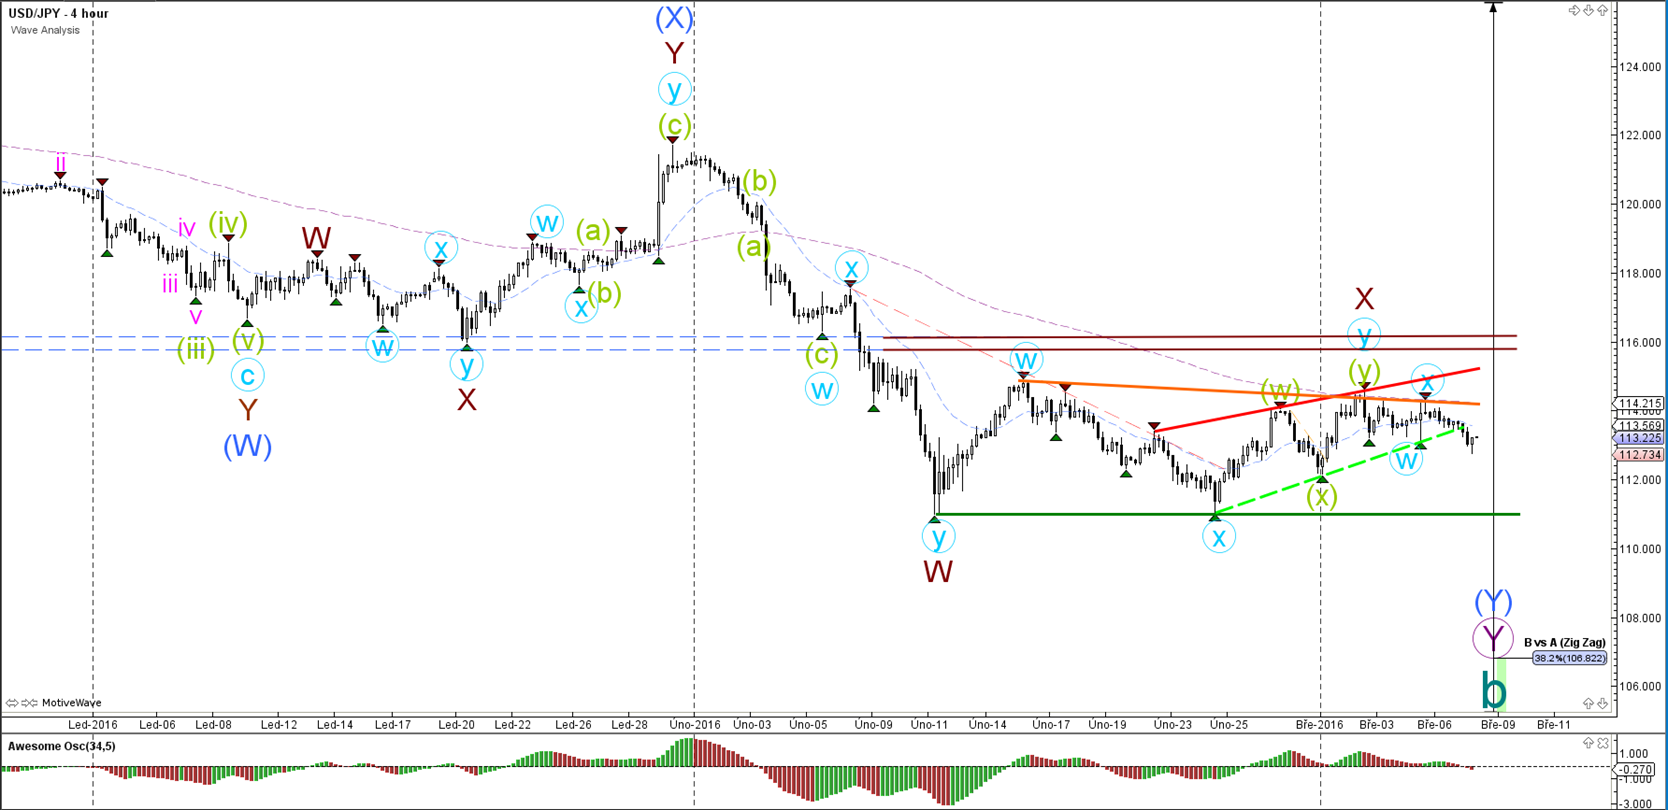
USD/JPY
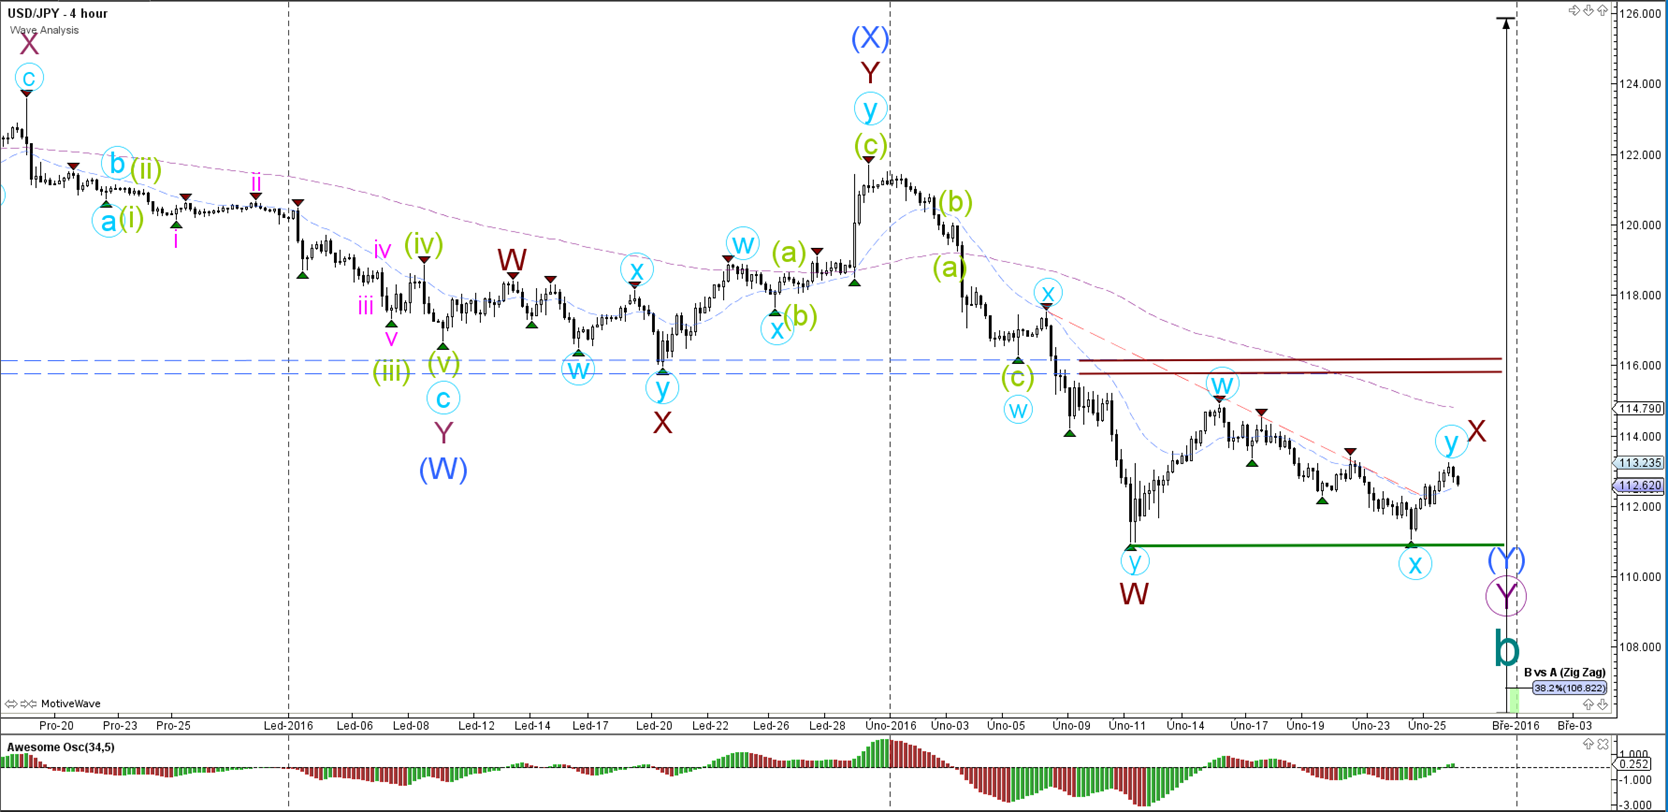
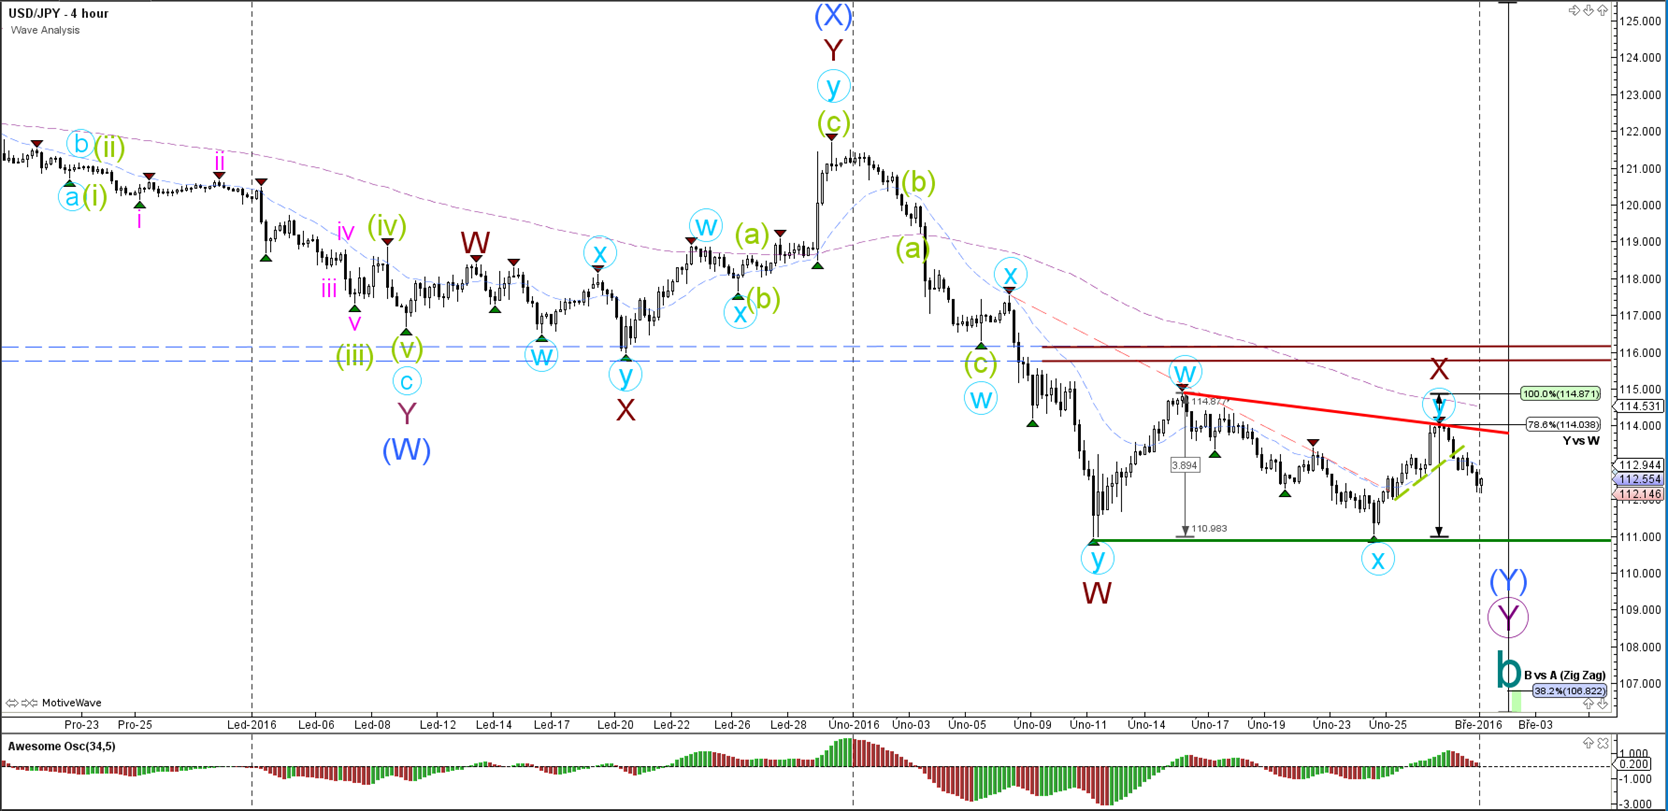
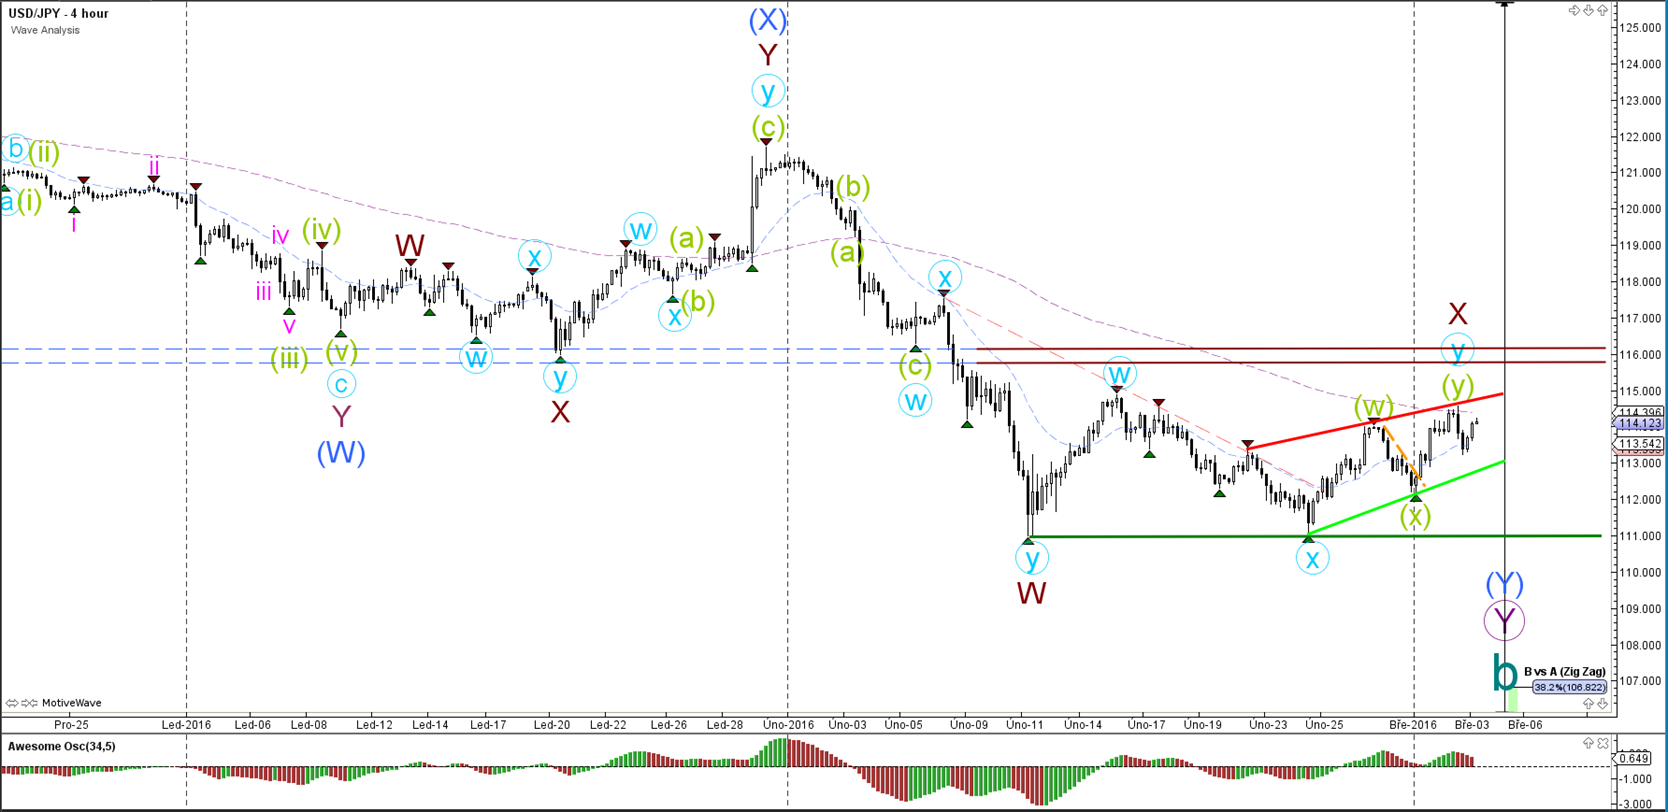
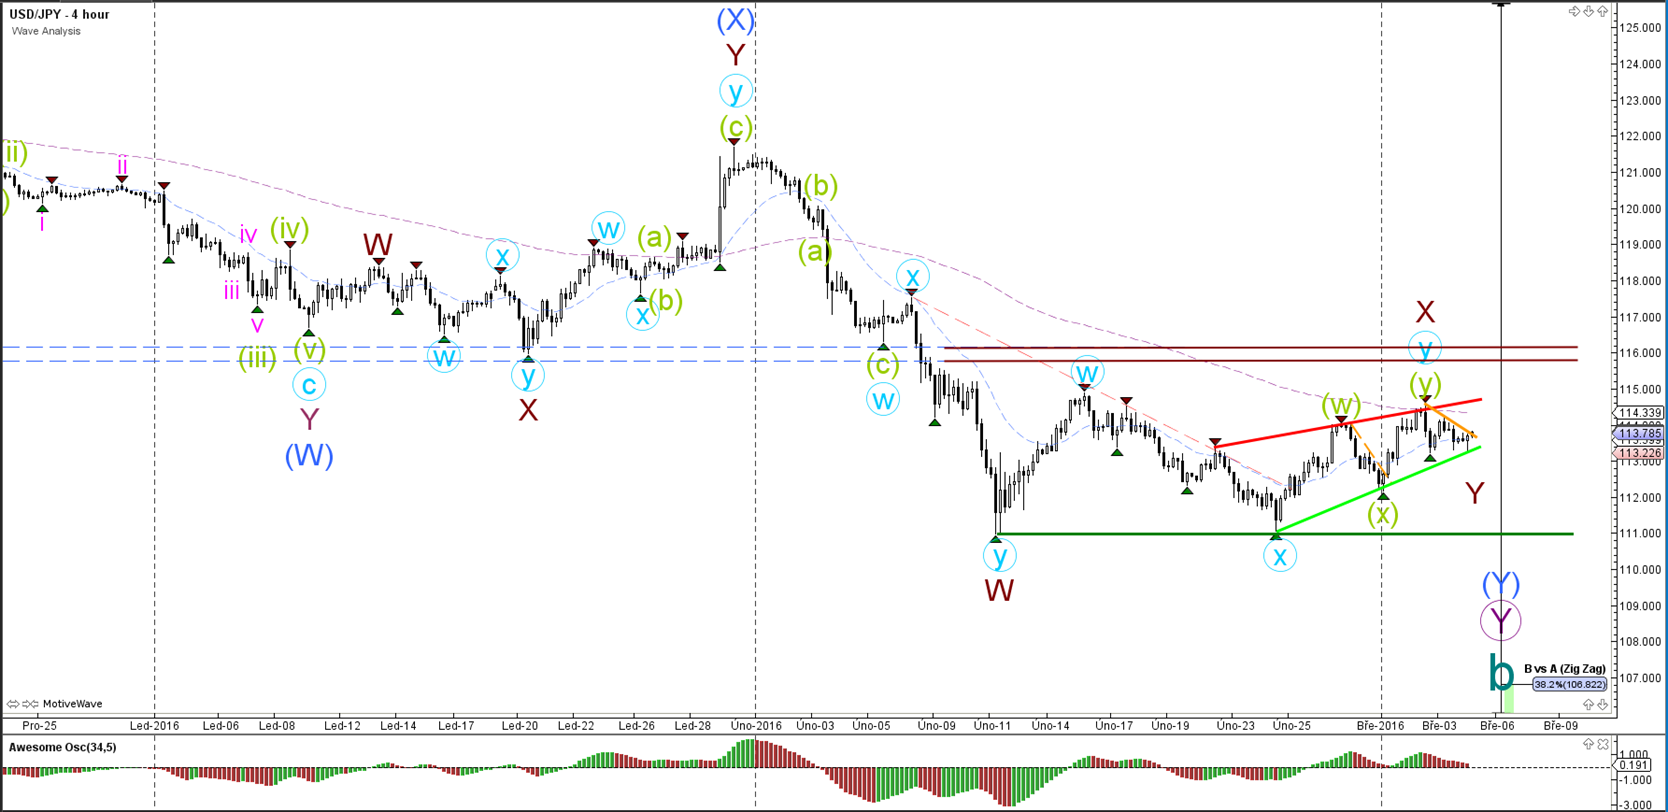
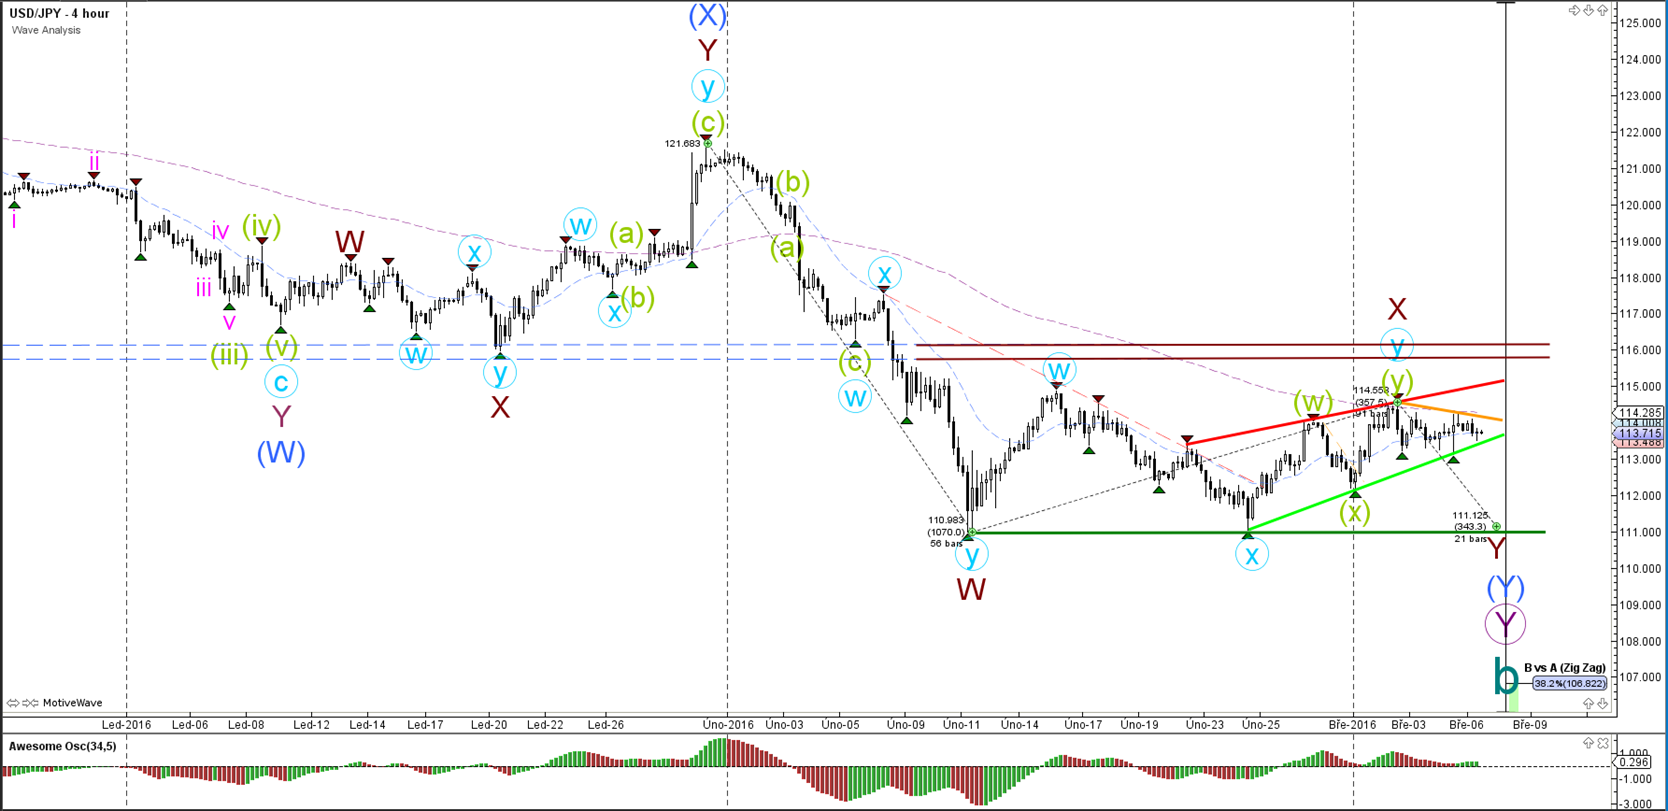
4 hour

The USD/JPY break below the support trend lines (dotted greens) but price action has been slow. Whether price has sufficient momentum to break the bottom (solid green) remains to be seen. A break below could price fall towards the Fibonacci levels.
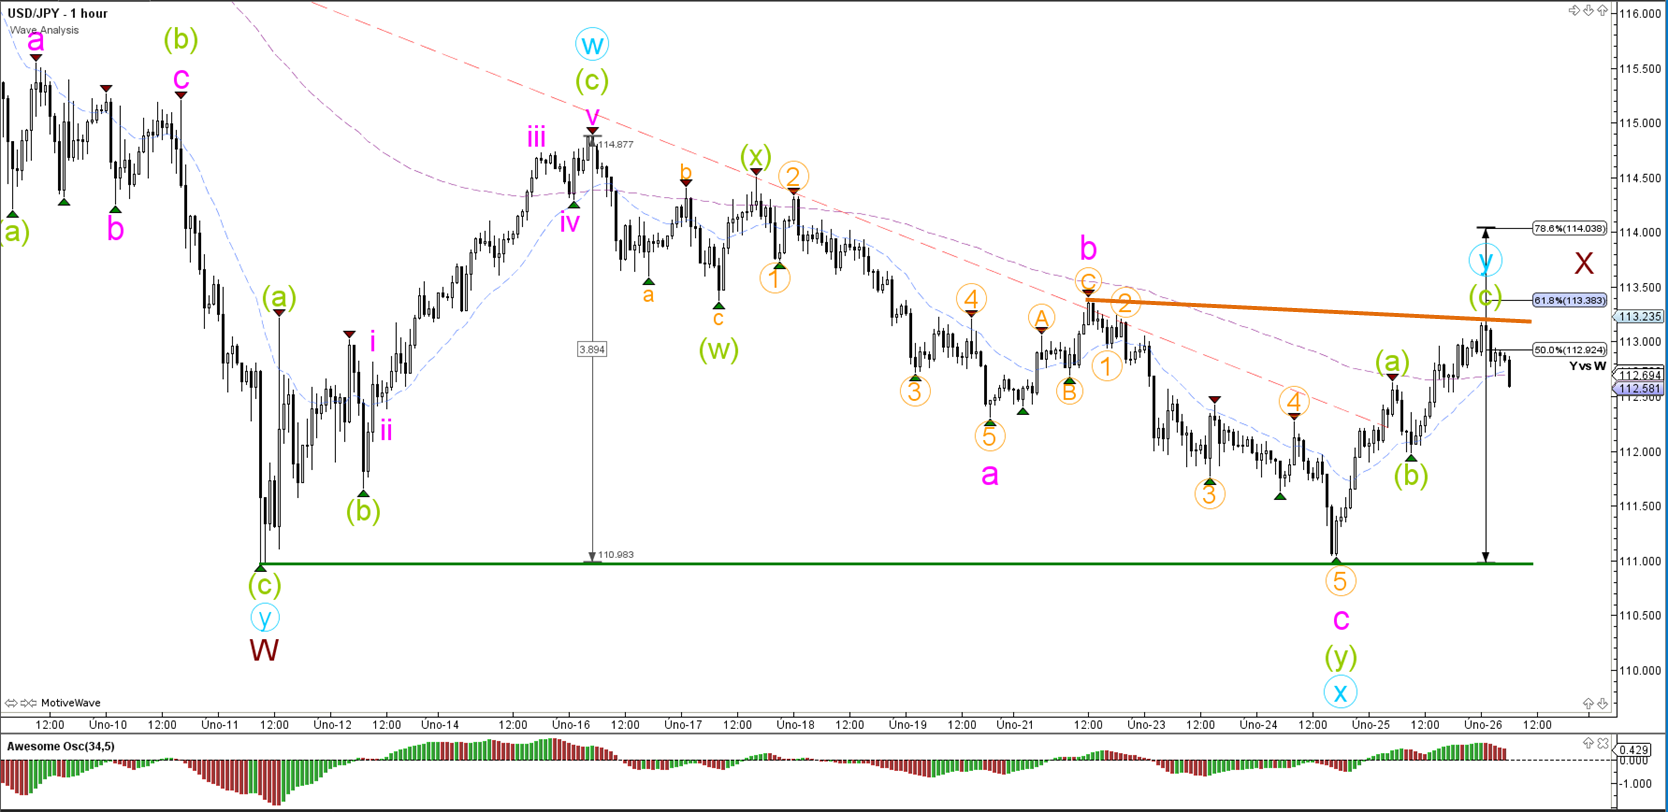
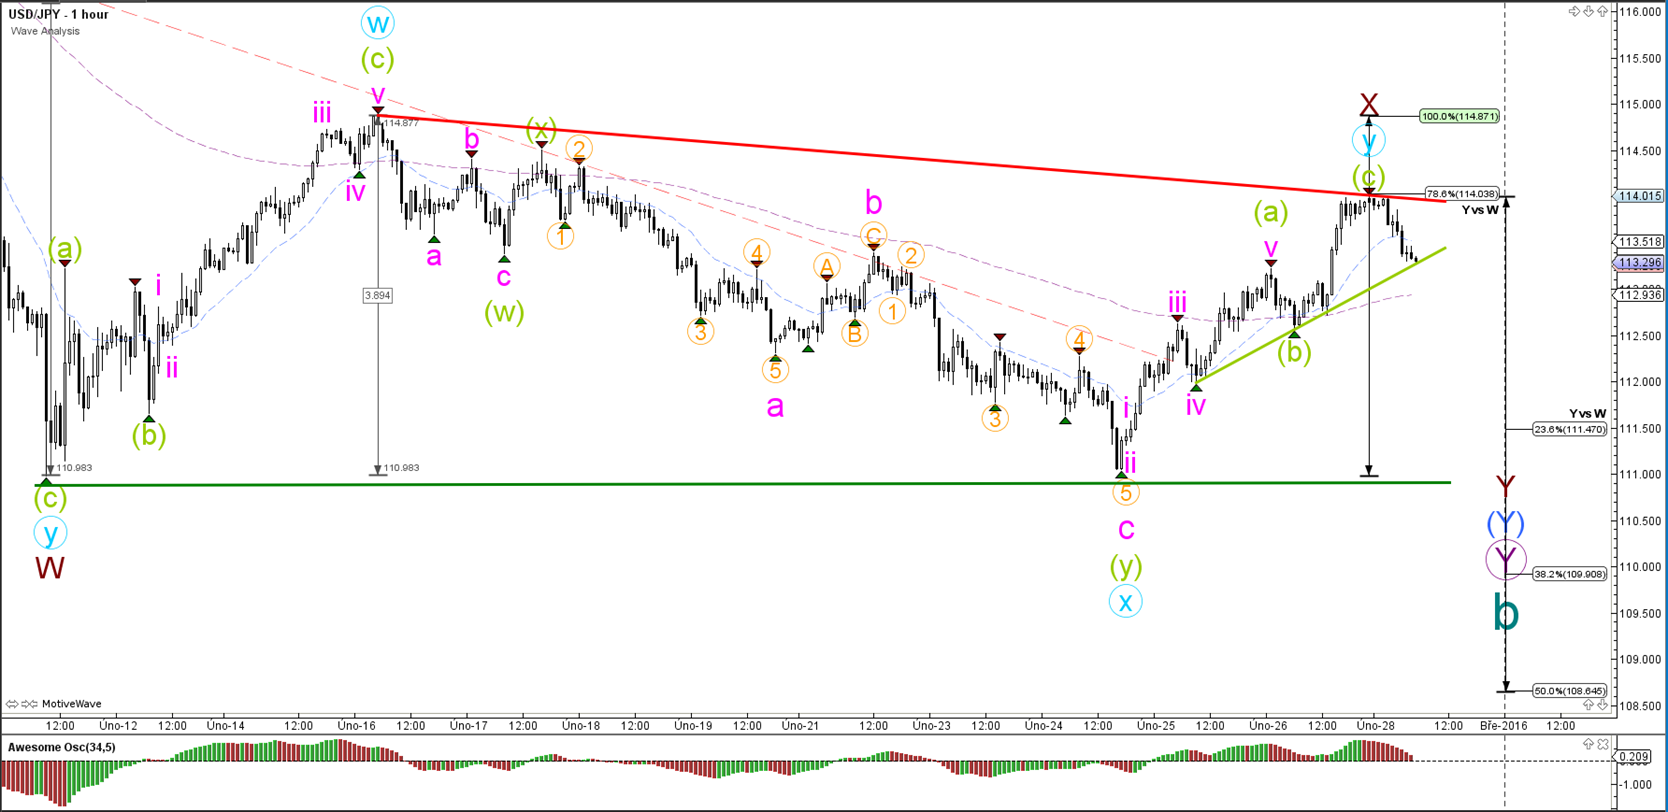
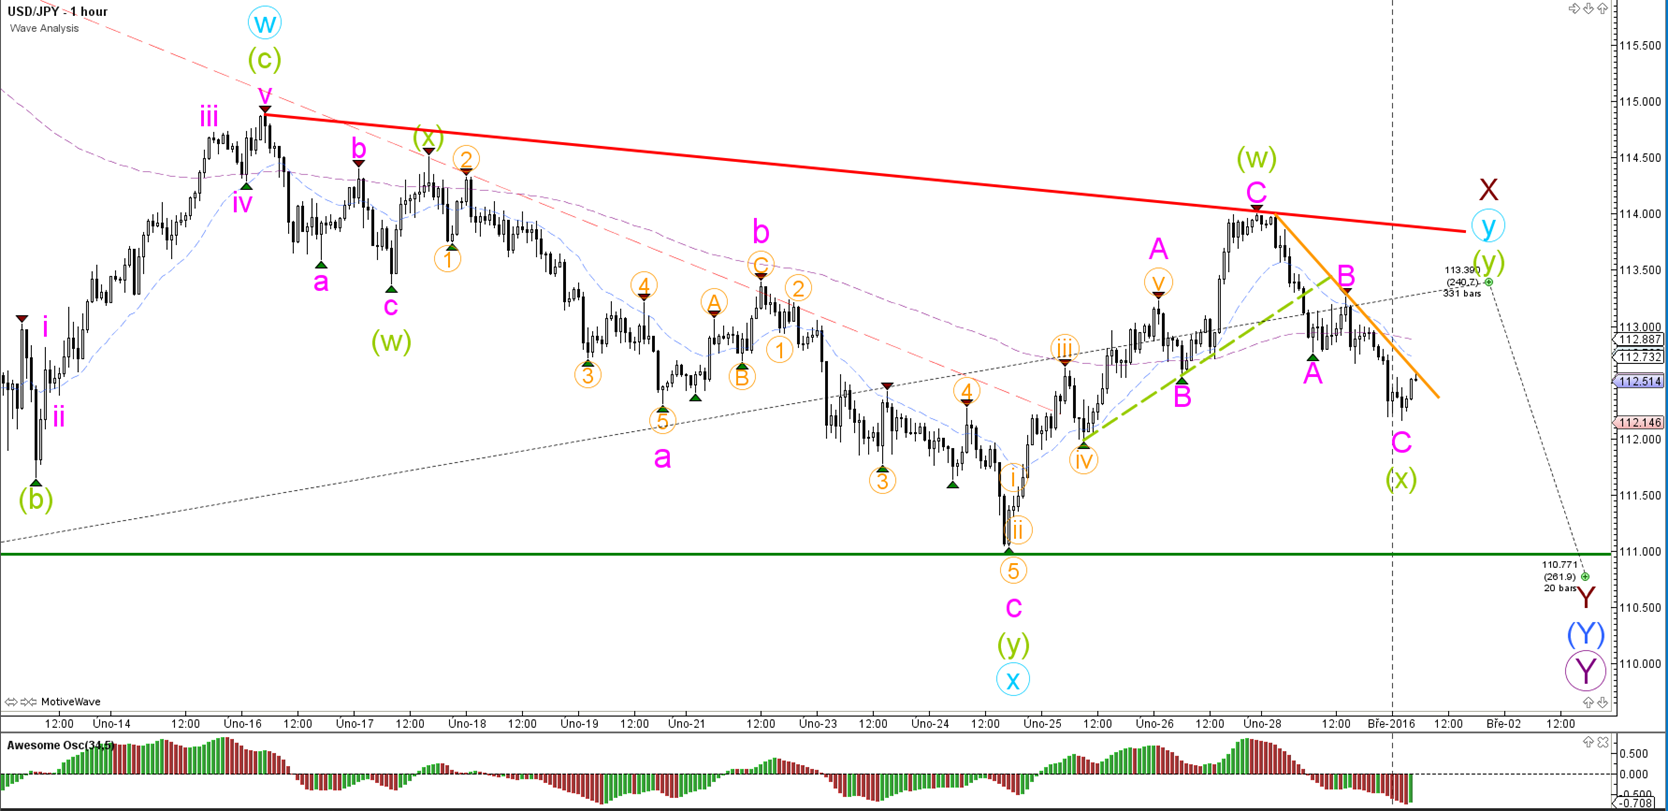
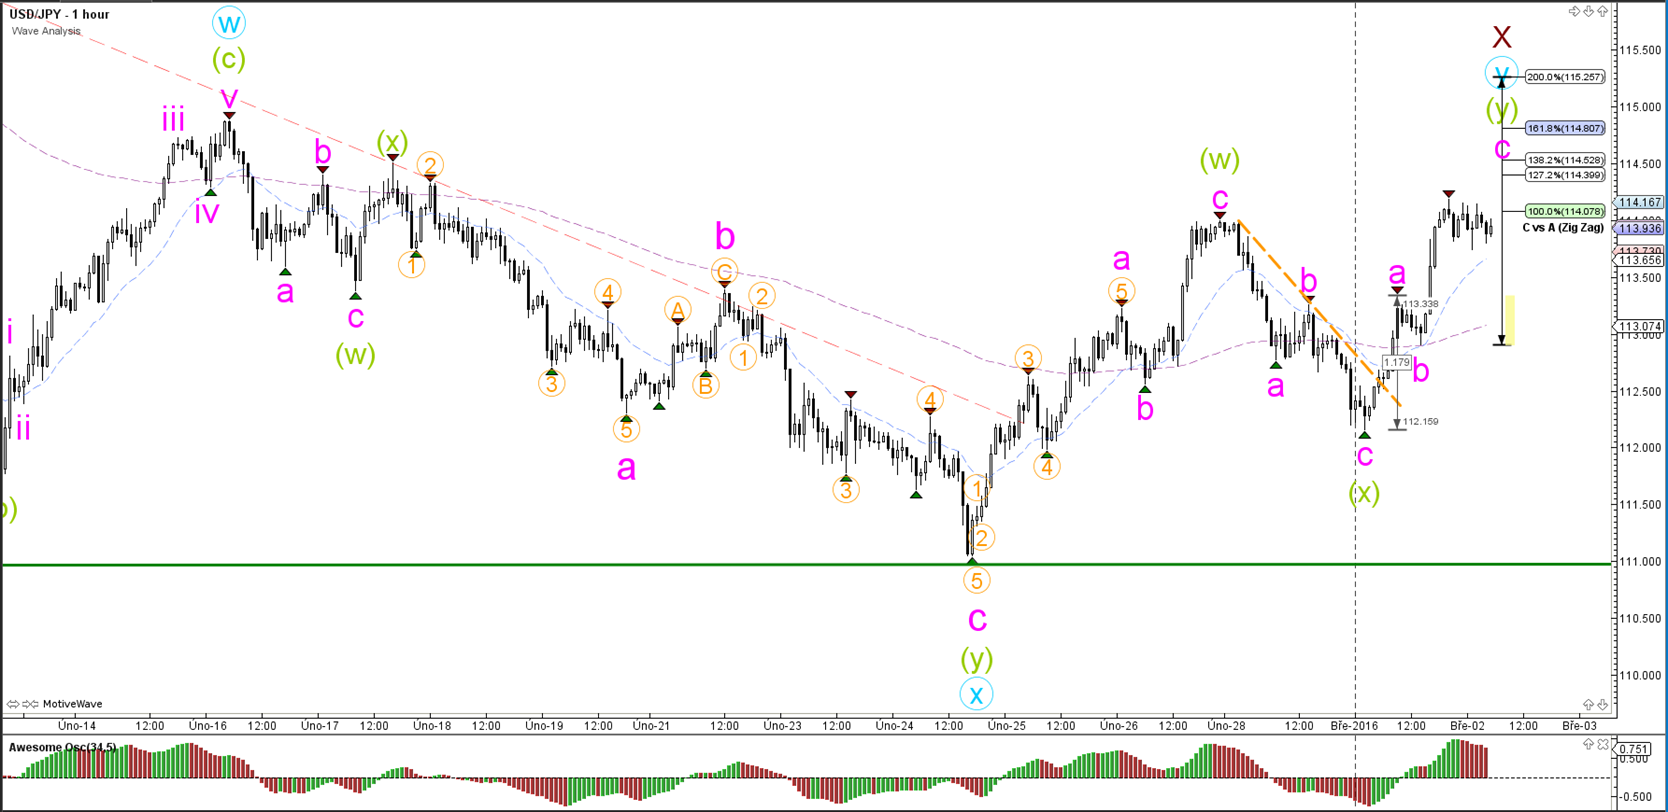
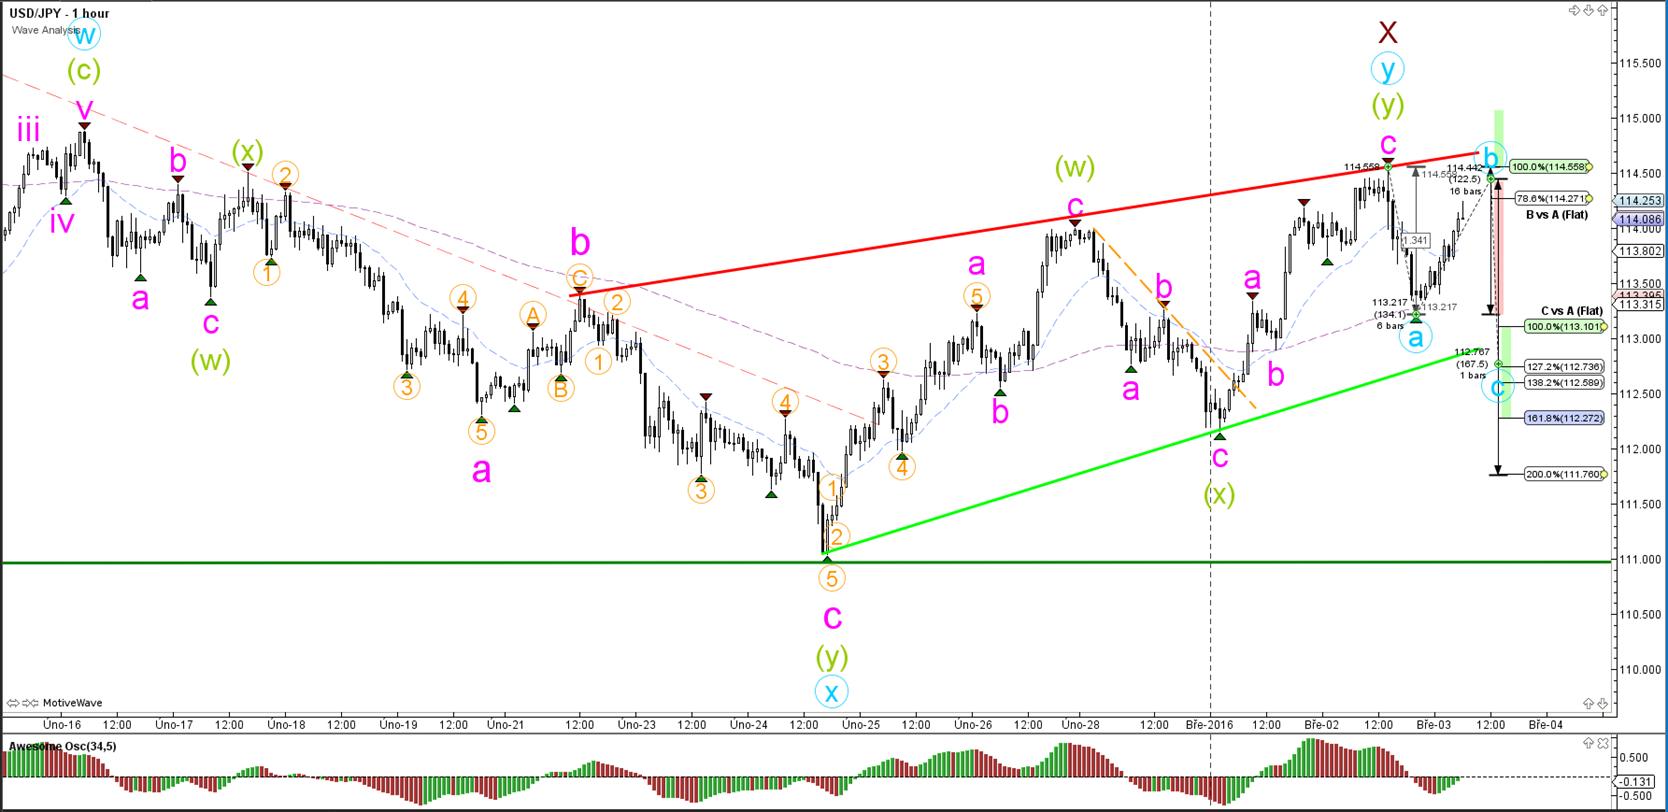
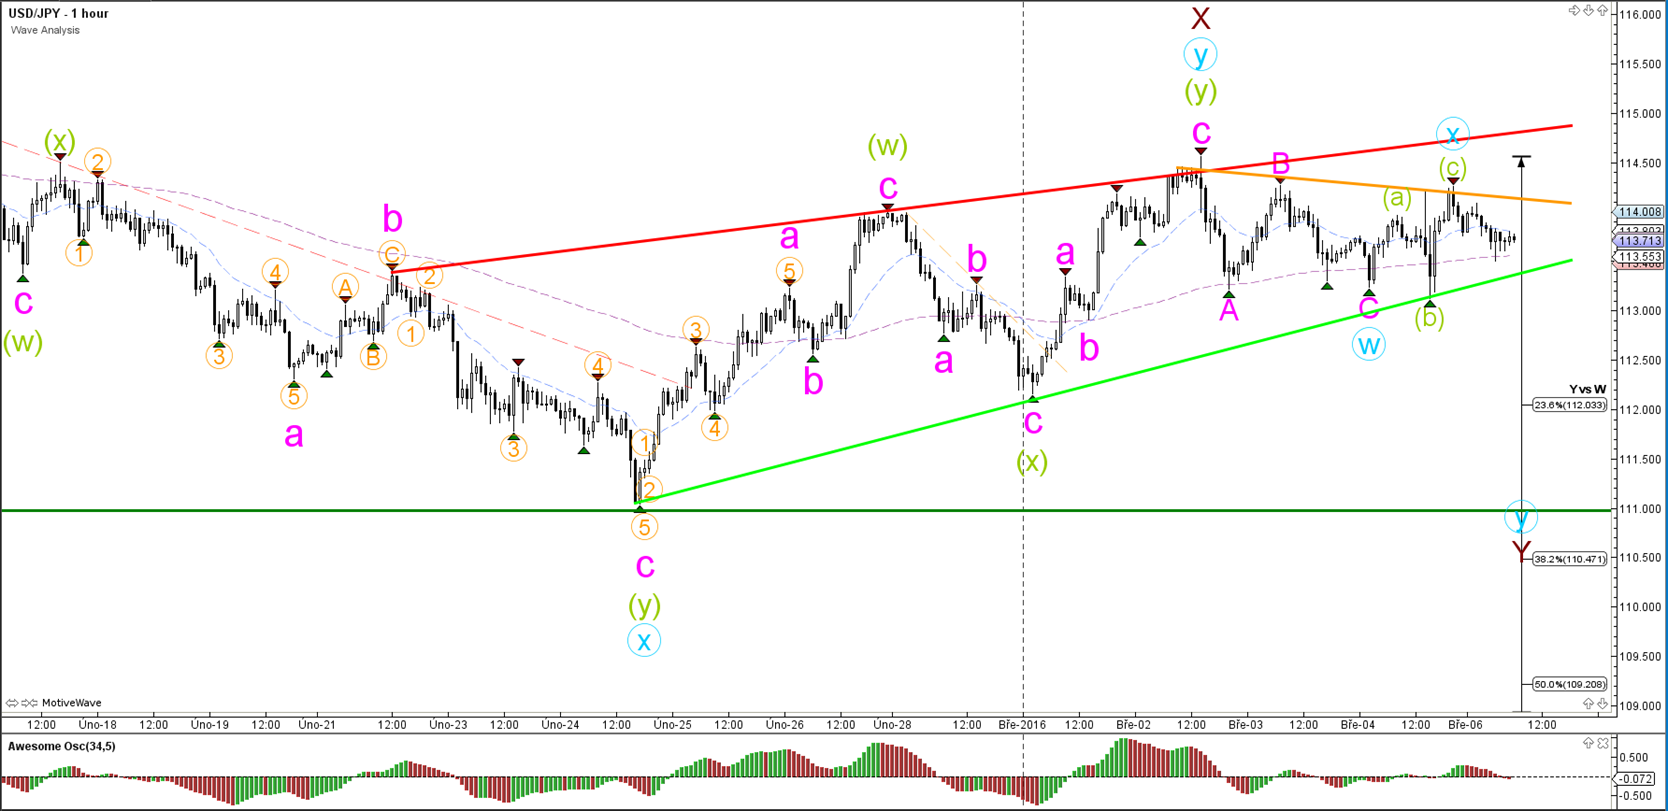
1 hour

The USD/JPY completed a corrective wave which is now marked as a wave 2 (orange). Price could now be in a potential wave 3, but it would require strong bearish momentum.
“Original analysis is provided by Admiral Markets”
EUR/USD
4 hour

The EUR/USD is approaching potential support levels like the Fibonacci retracements and trend line. This zone could turn out to be a zone where price will show a bullish bounce (if it breaks above resistance) or a bearish break (if it breaks below support).
1 hour
The EUR/USD respected the Fibonacci levels of wave 4 (orange) and has turned bearish as part of wave 5. A break above the resistance trend line (orange) could indicate the completion of wave X (purple).
GBP/USD
4 hour

The GBP/USD broke the bottom (dotted green) and has continued with its bearish momentum and trend.
1 hour

The GBP/USD respected the shallow Fibonacci levels of the wave 4 (blue) and price is moving lower as part of the 5th wave (blue) towards Fibonacci targets to complete most likely wave 3 (pink).
USD/JPY
4 hour

The USD/JPY break below the support trend lines (dotted greens) but price action has been slow. Whether price has sufficient momentum to break the bottom (solid green) remains to be seen. A break below could price fall towards the Fibonacci levels.
1 hour

The USD/JPY completed a corrective wave which is now marked as a wave 2 (orange). Price could now be in a potential wave 3, but it would require strong bearish momentum.
“Original analysis is provided by Admiral Markets”