Admiral Markets
AdmiralMarkets.com Representative
- Messages
- 95
EUR/USD’s Bullish Bounce, GBP/USD’s Tumble Lower
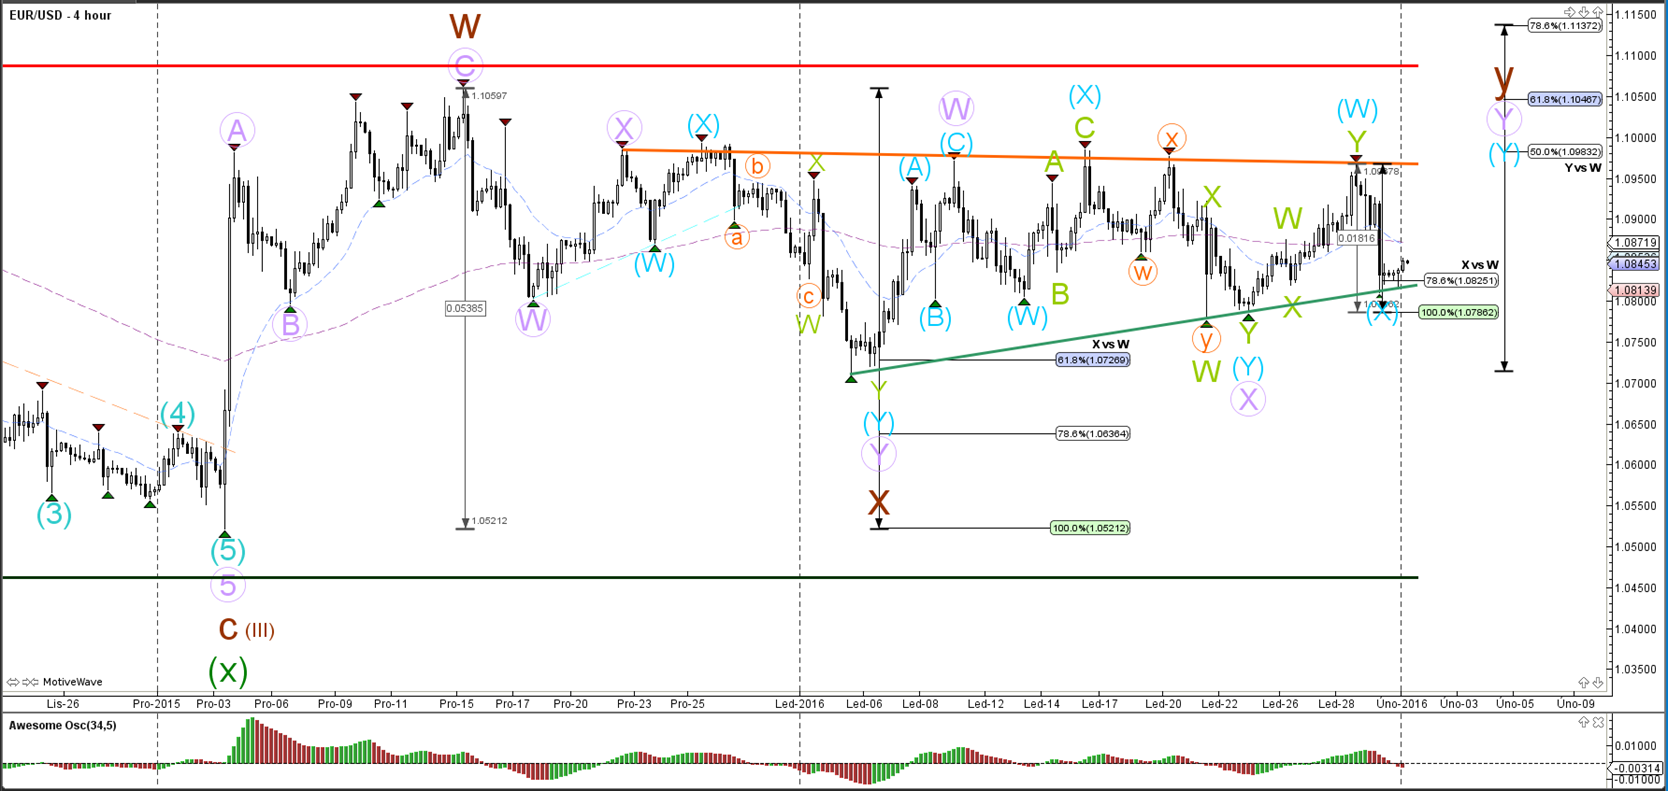
EUR/USD
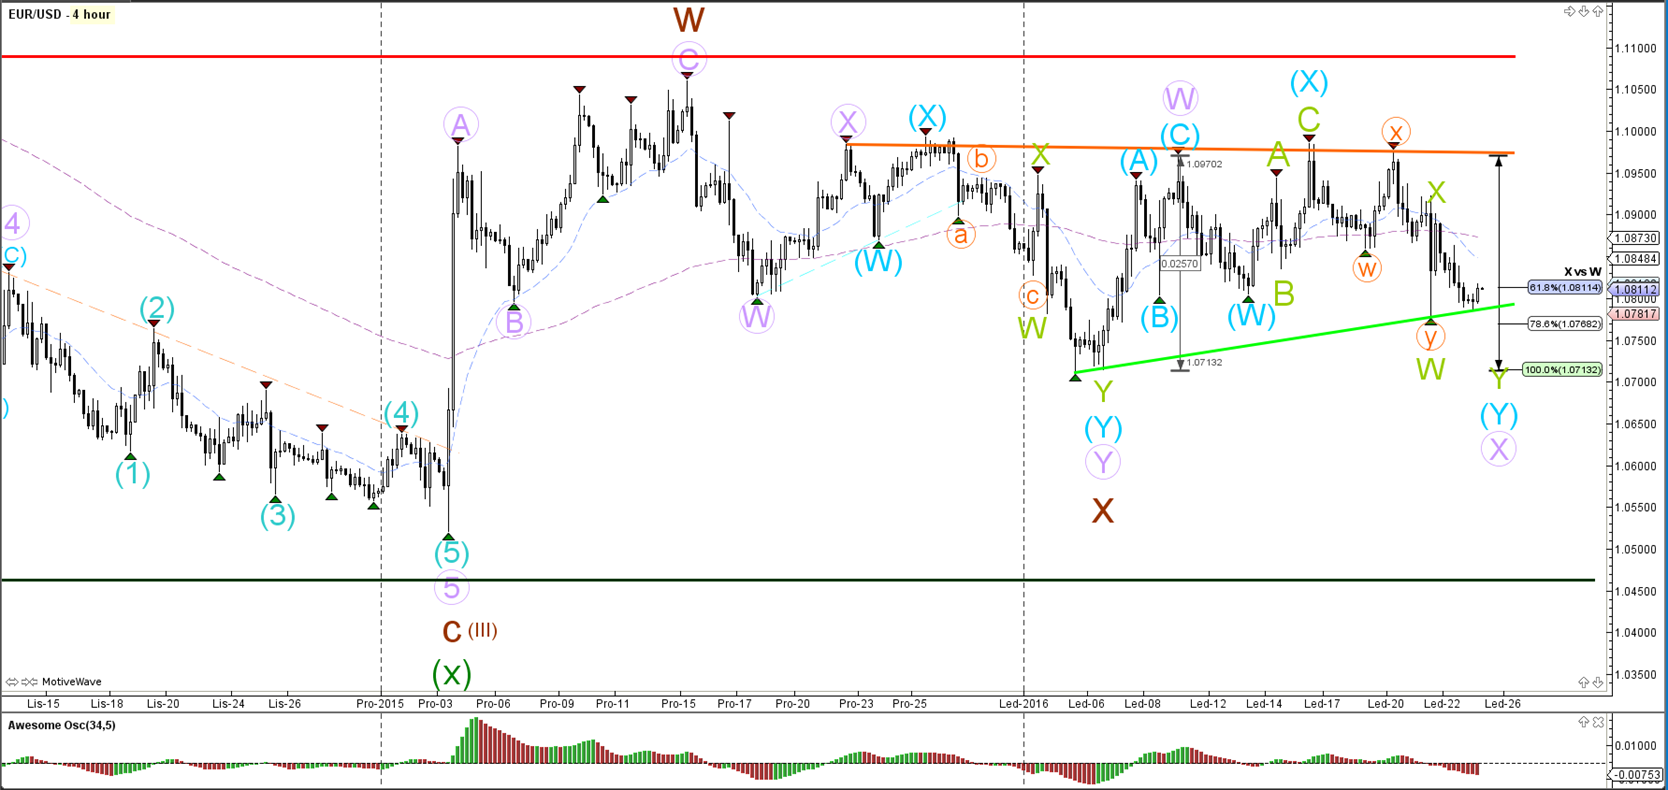
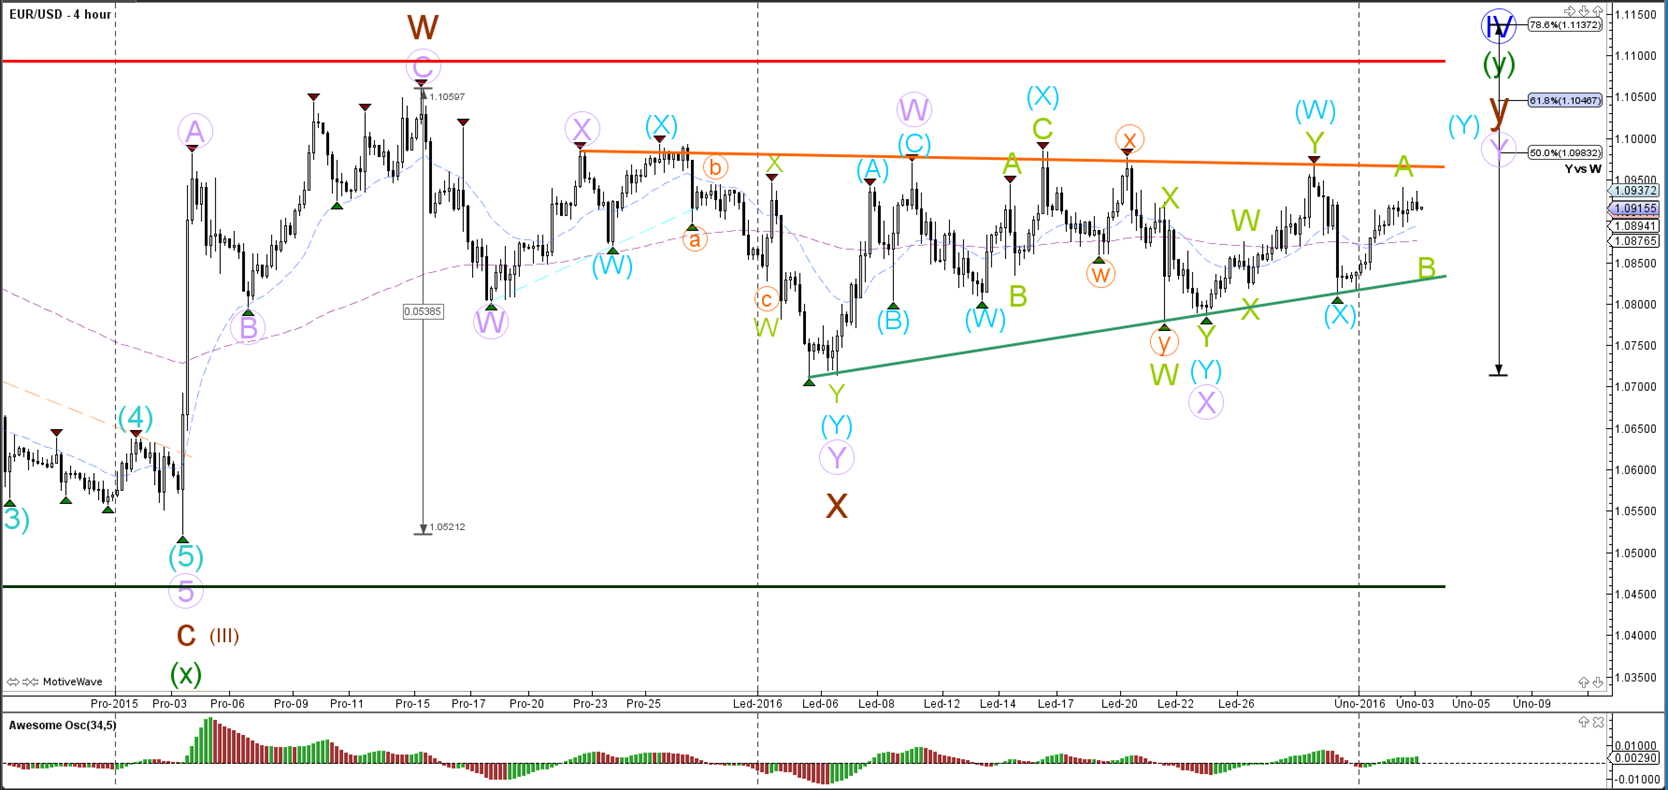
4 hour

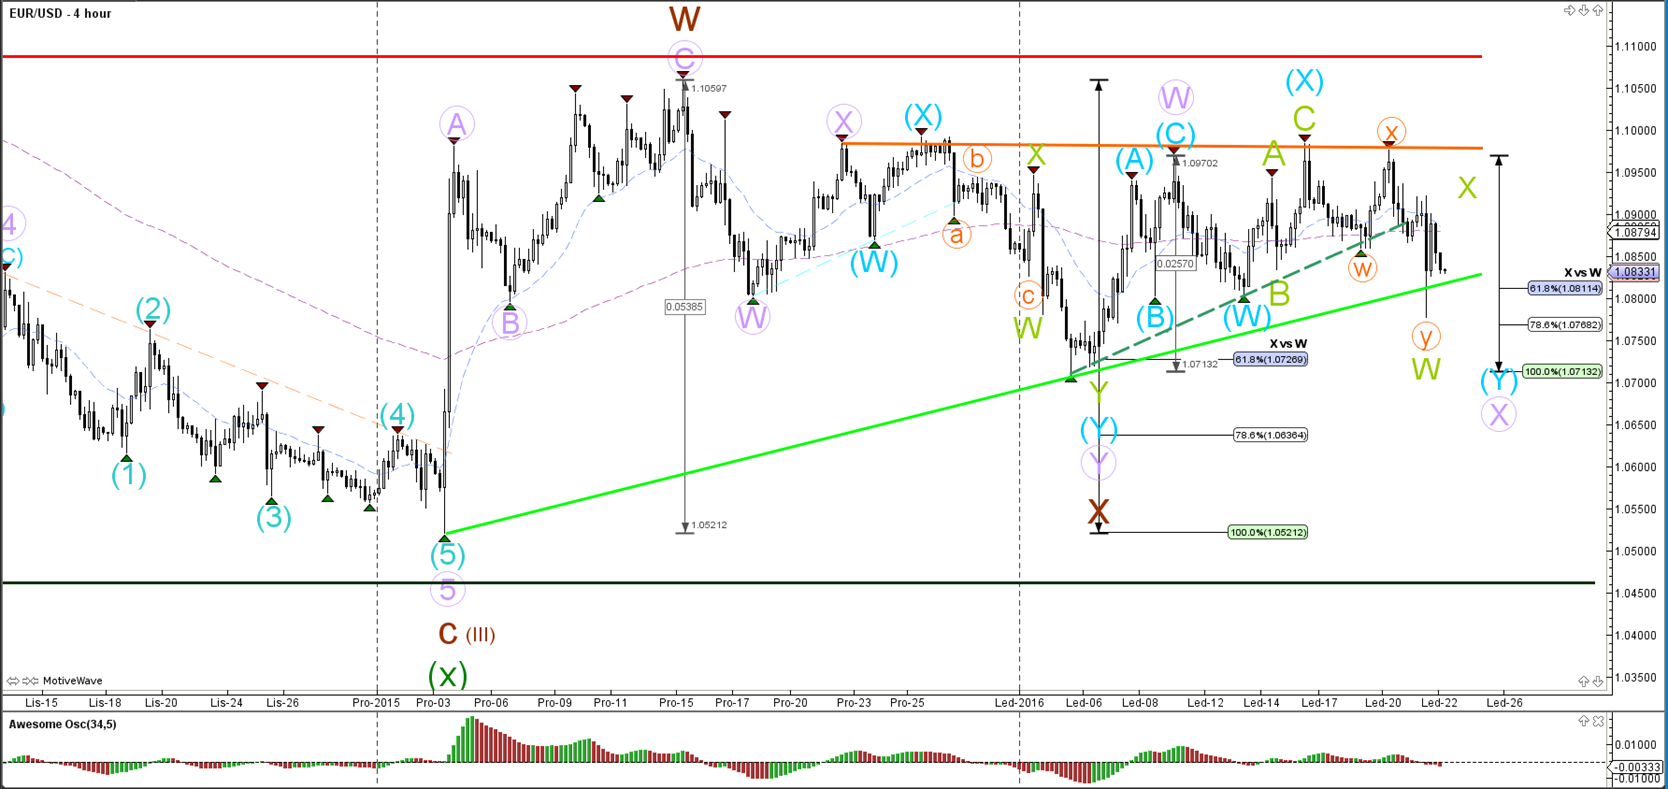
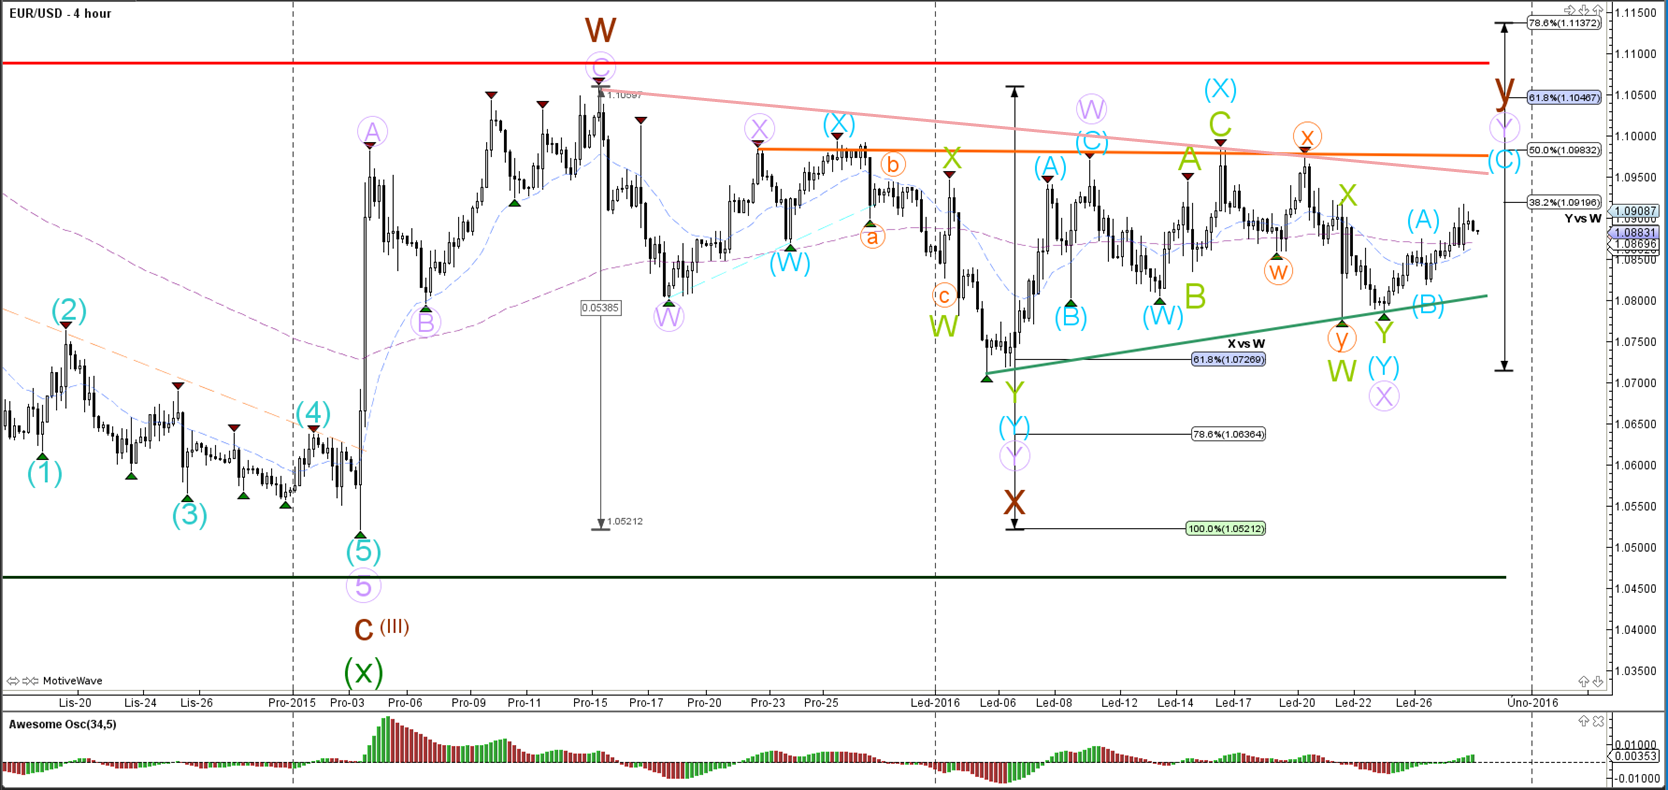
The EUR/USD bounced as part of the wave X (blue) support and indeed seems to be expanding the WXY correction. The trend line (orange) at 1.10 is an important resistance spot. A break above that could see price continue its bullish price action towards the 100% Fibonacci levels and thereafter perhaps to the higher Fib targets.
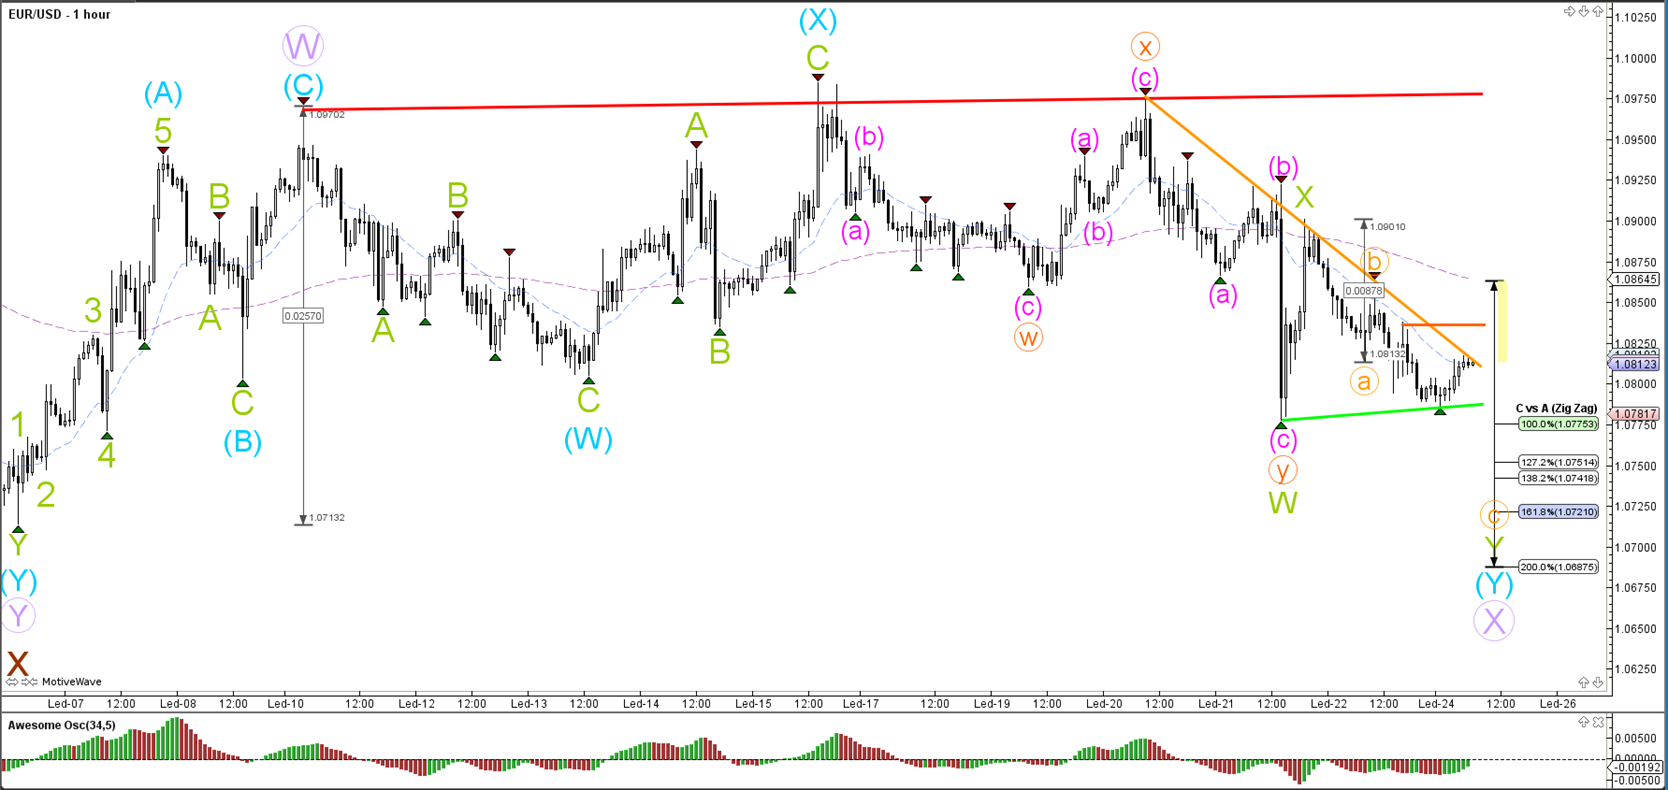
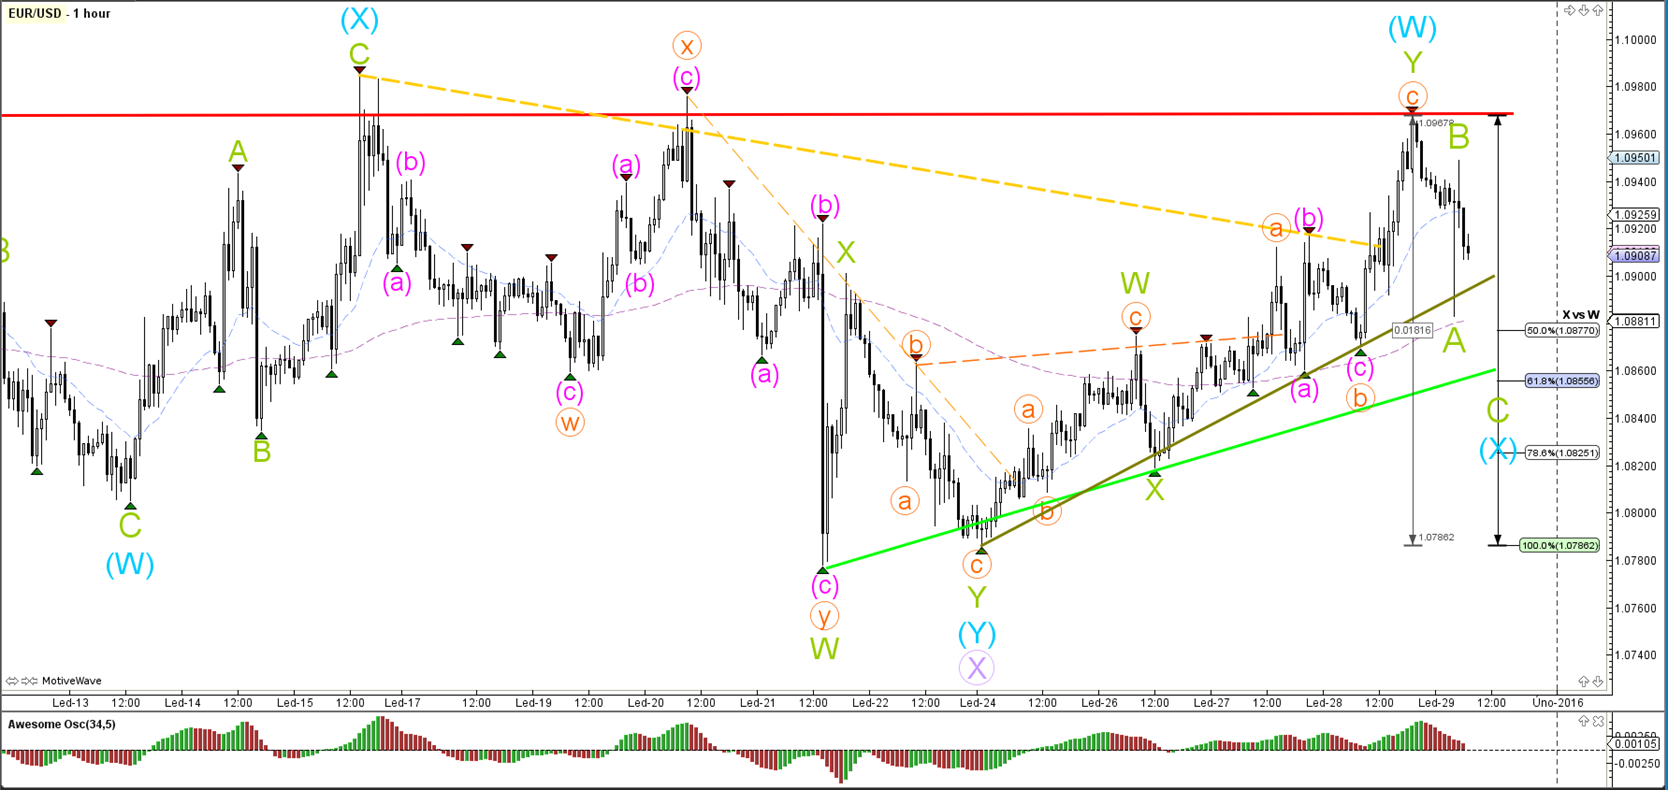
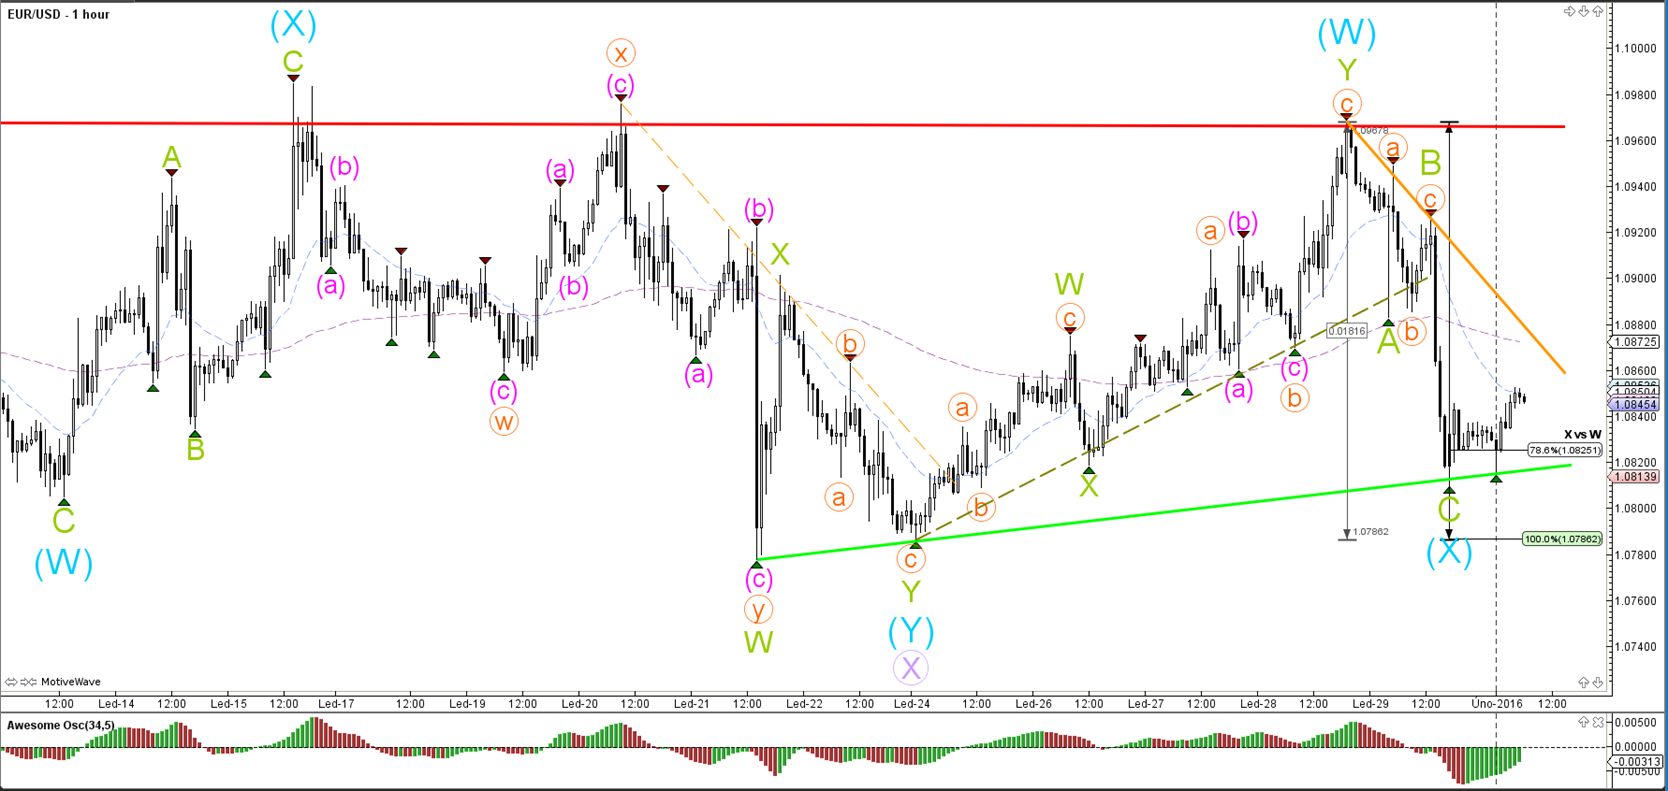
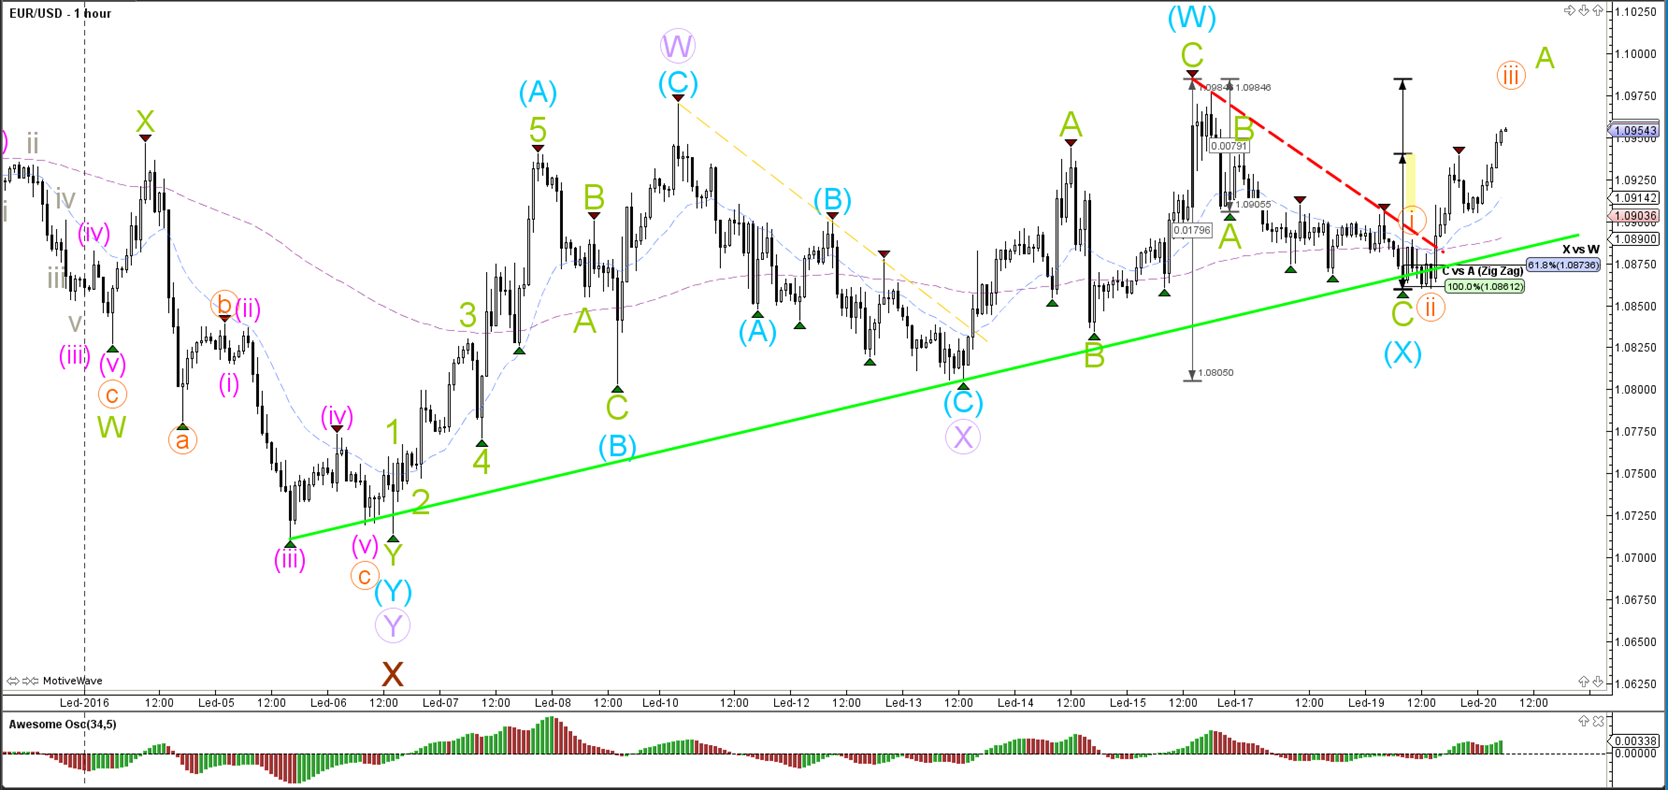
1 hour

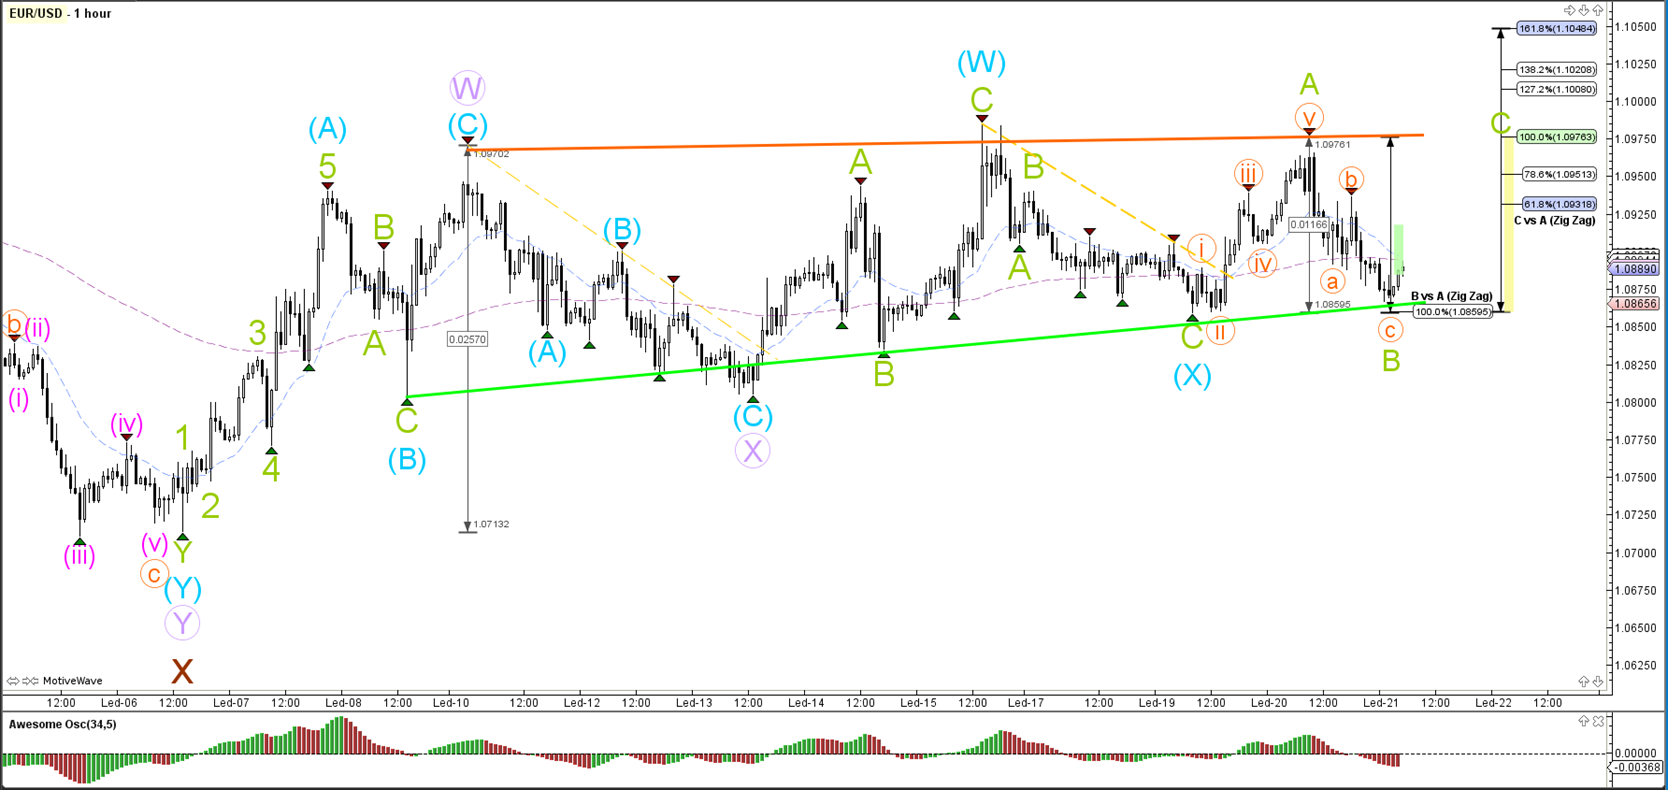
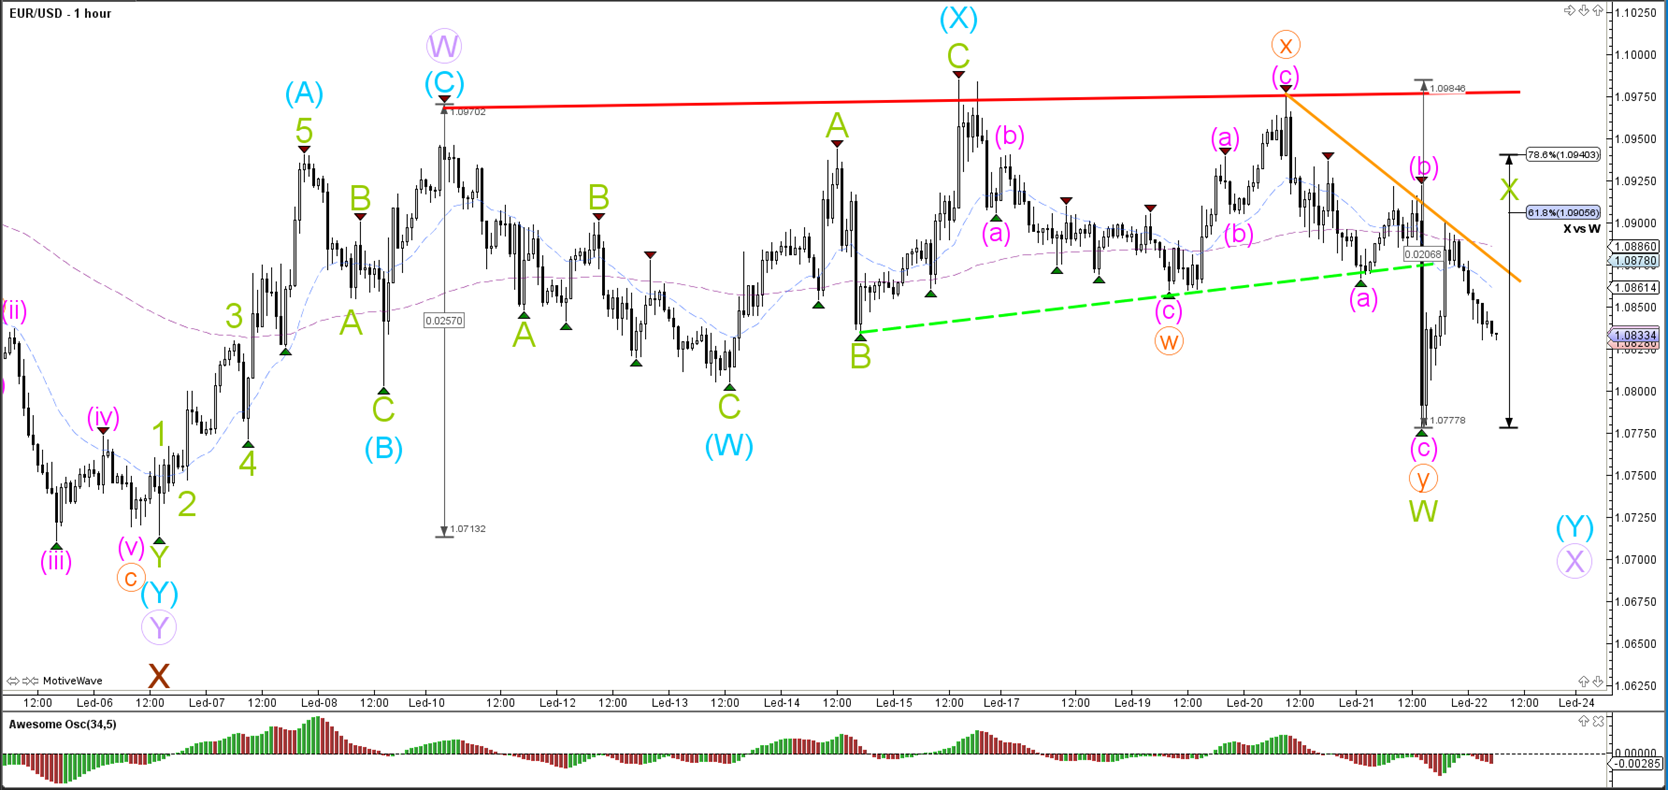
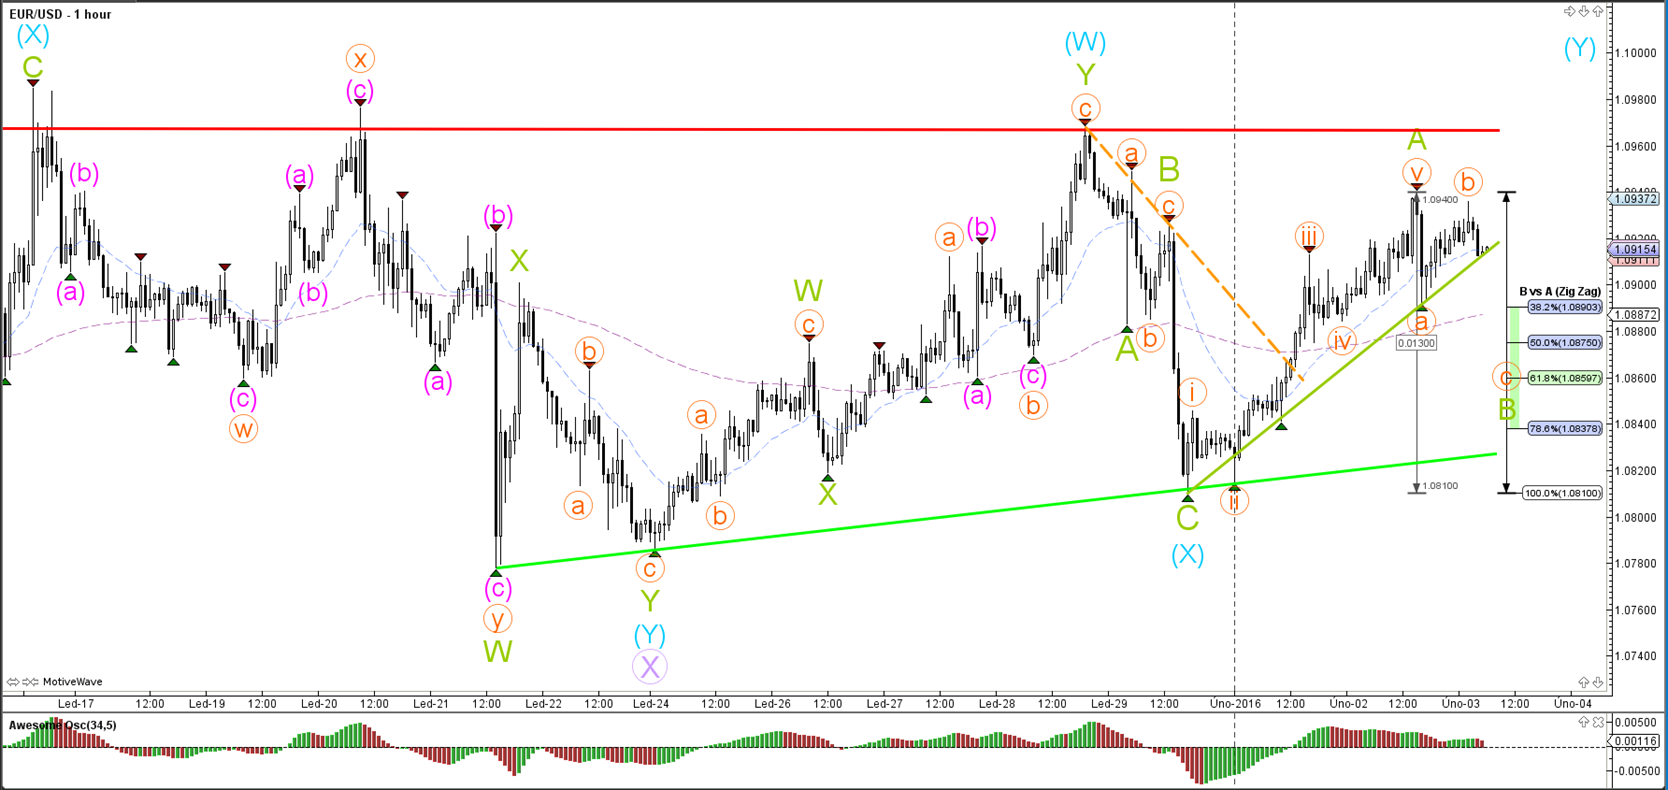
The EUR/USD bounced at the confluence of 61.8% Fibonacci retracement and 100% Fibonacci target levels.
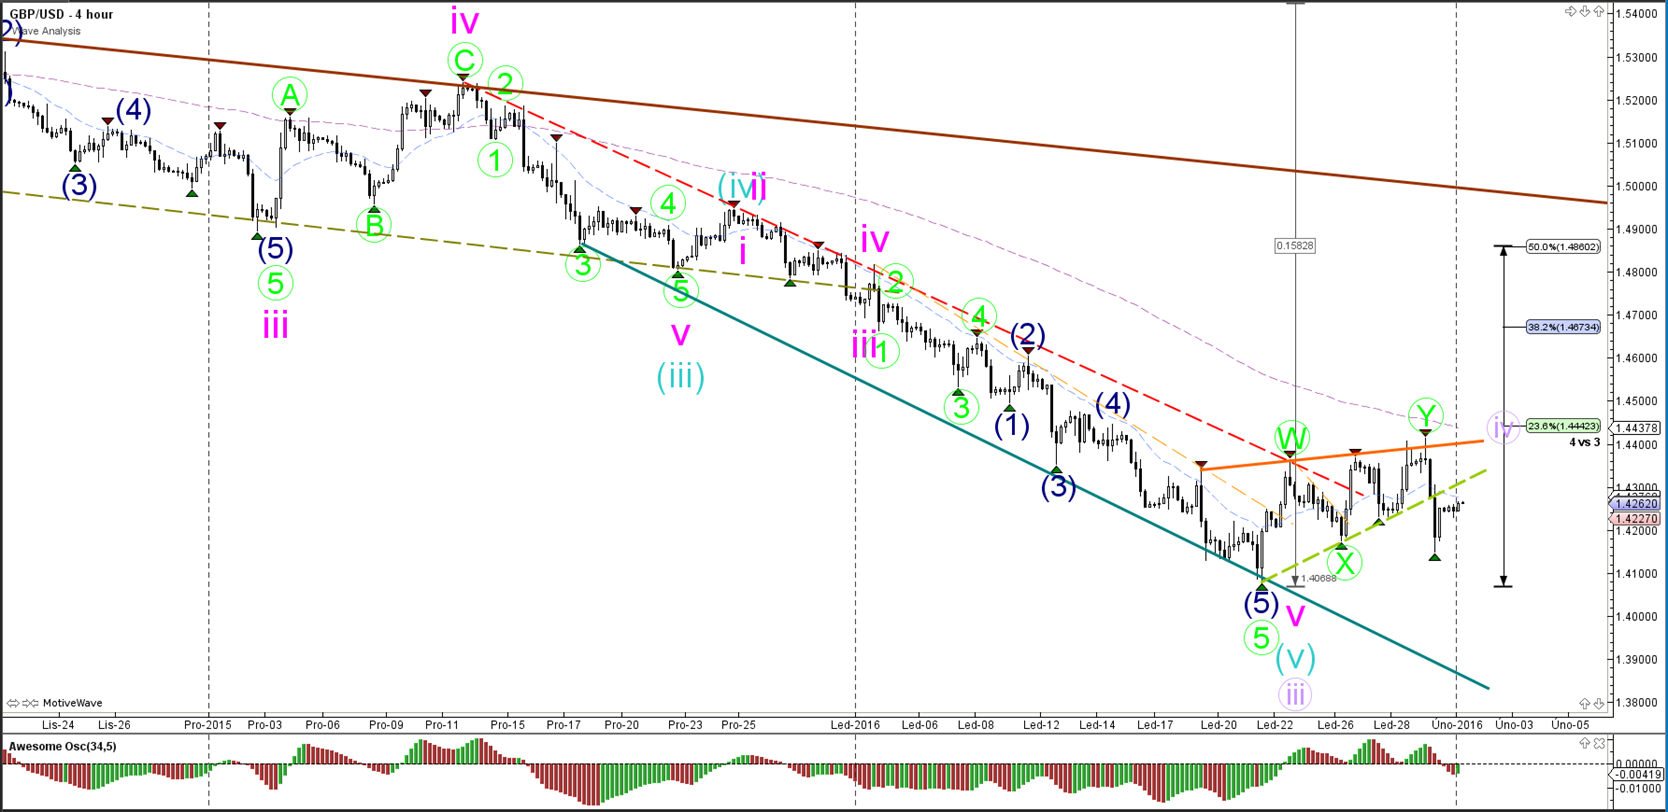
GBP/USD
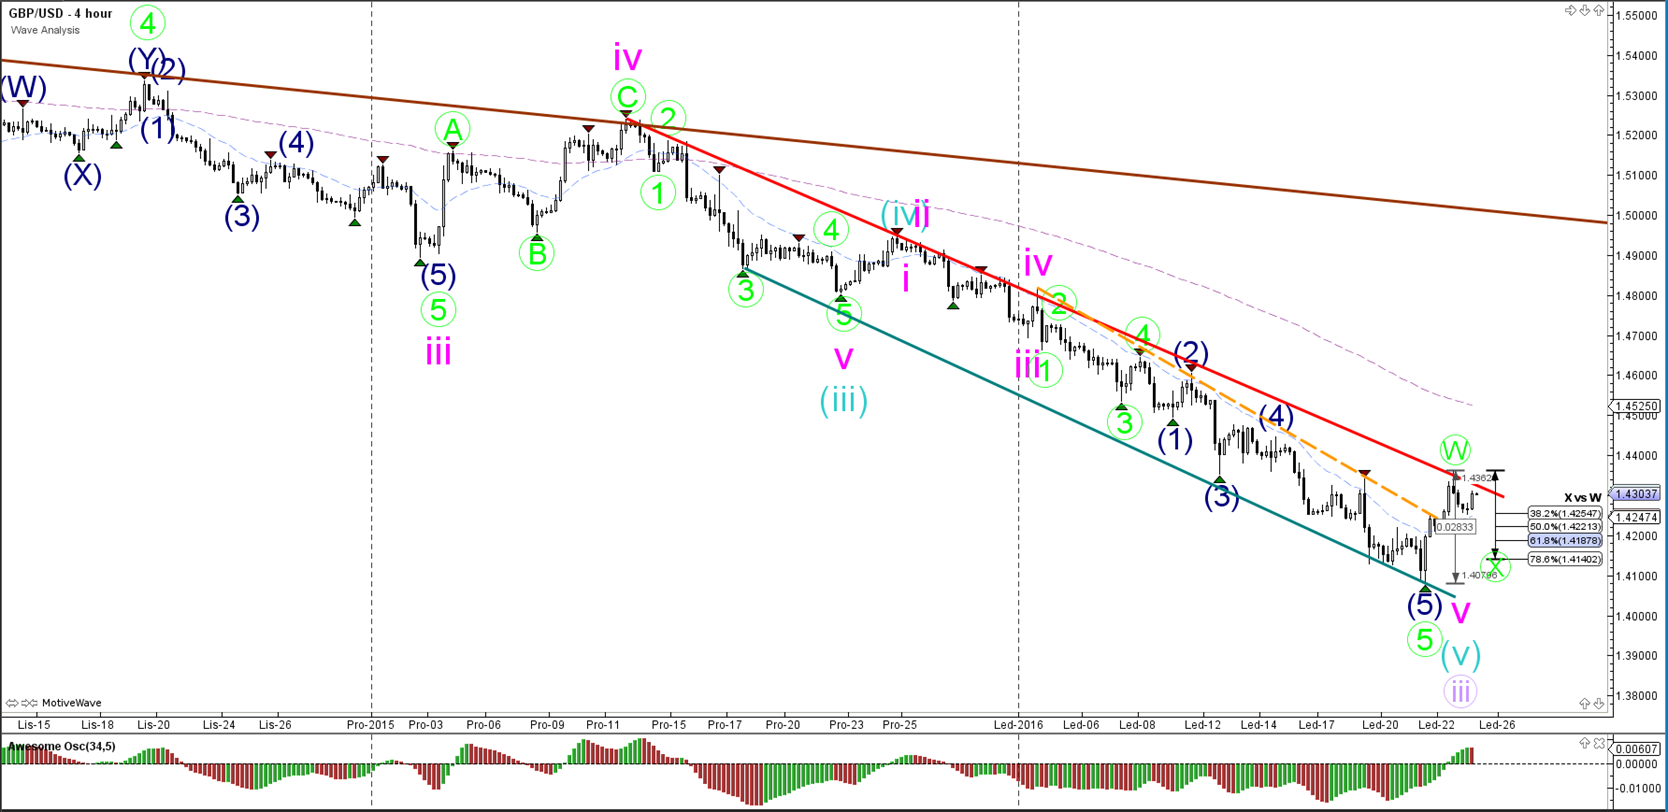
4 hour

The GBP/USD keeps pushing the downtrend to new extremes and price is now approaching the 261.8% Fibonacci target at 1.3942 of wave 3 versus wave 1 (purple).
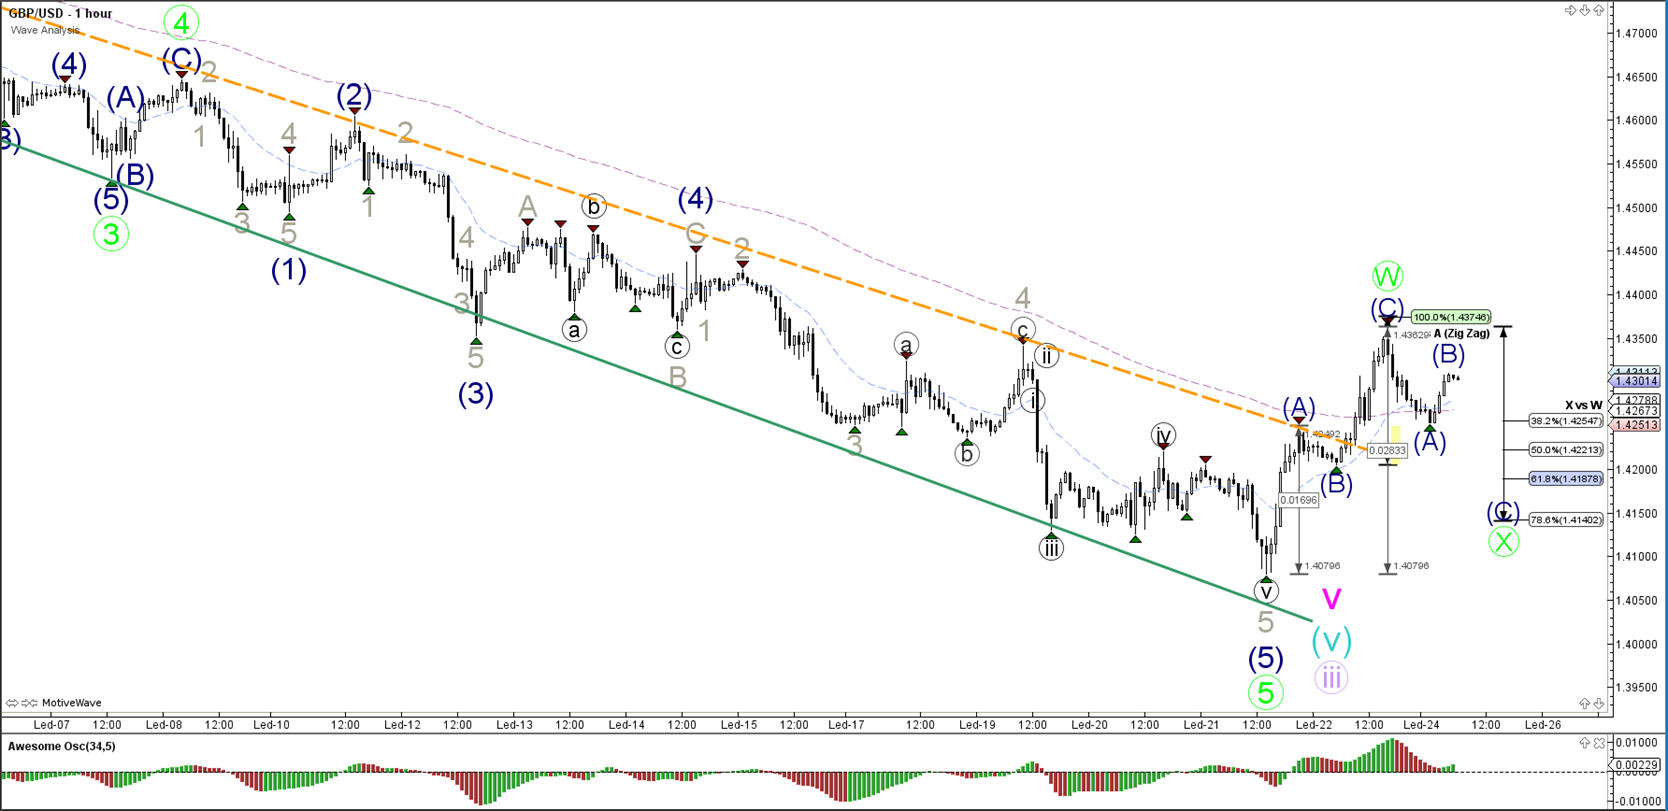
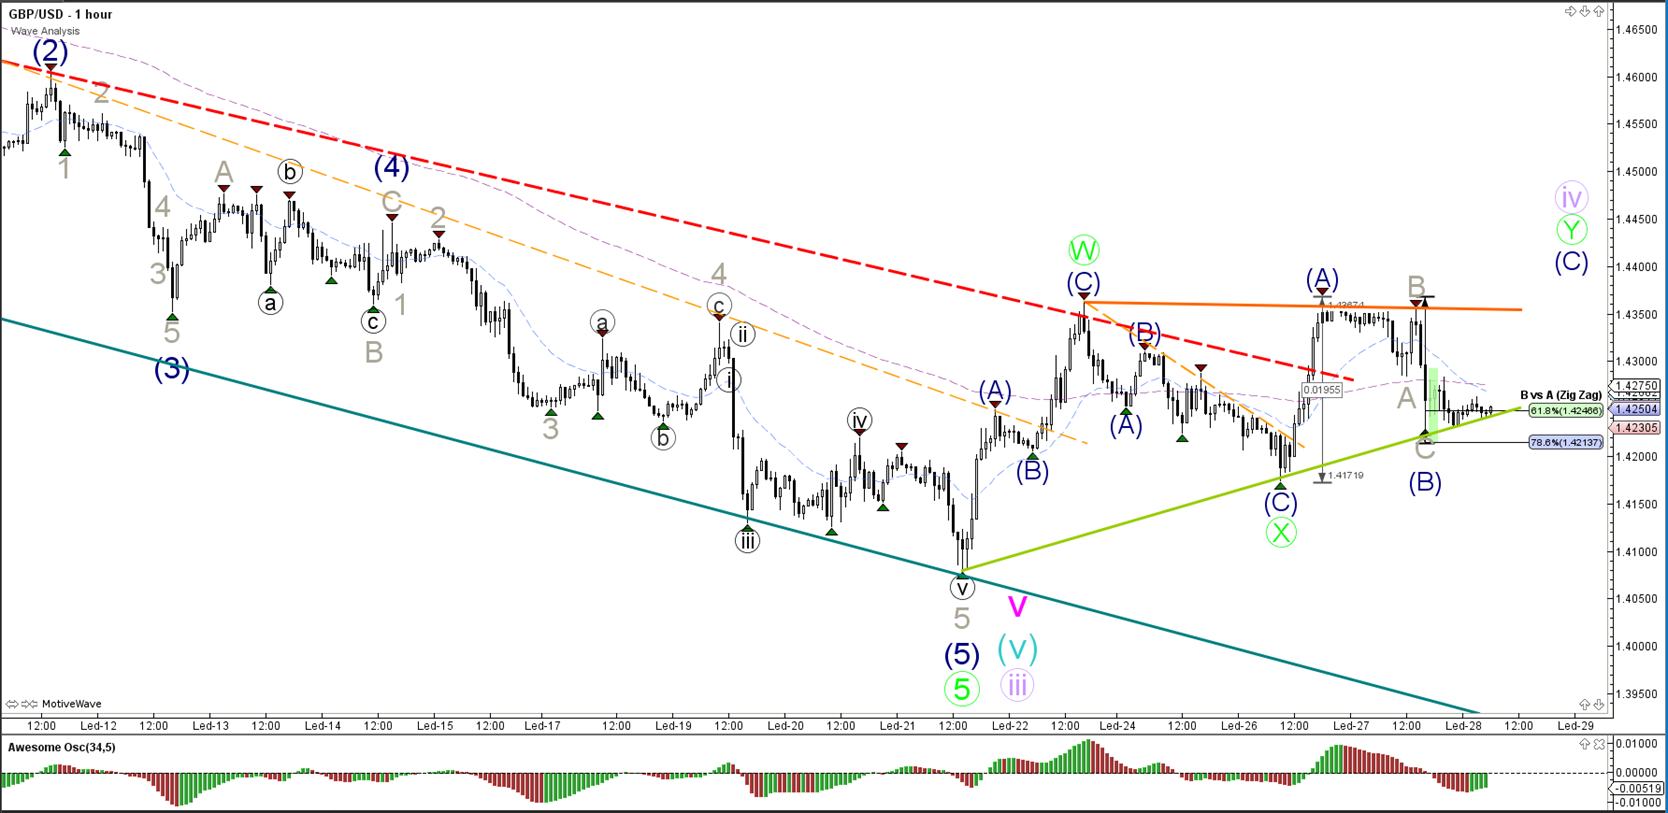
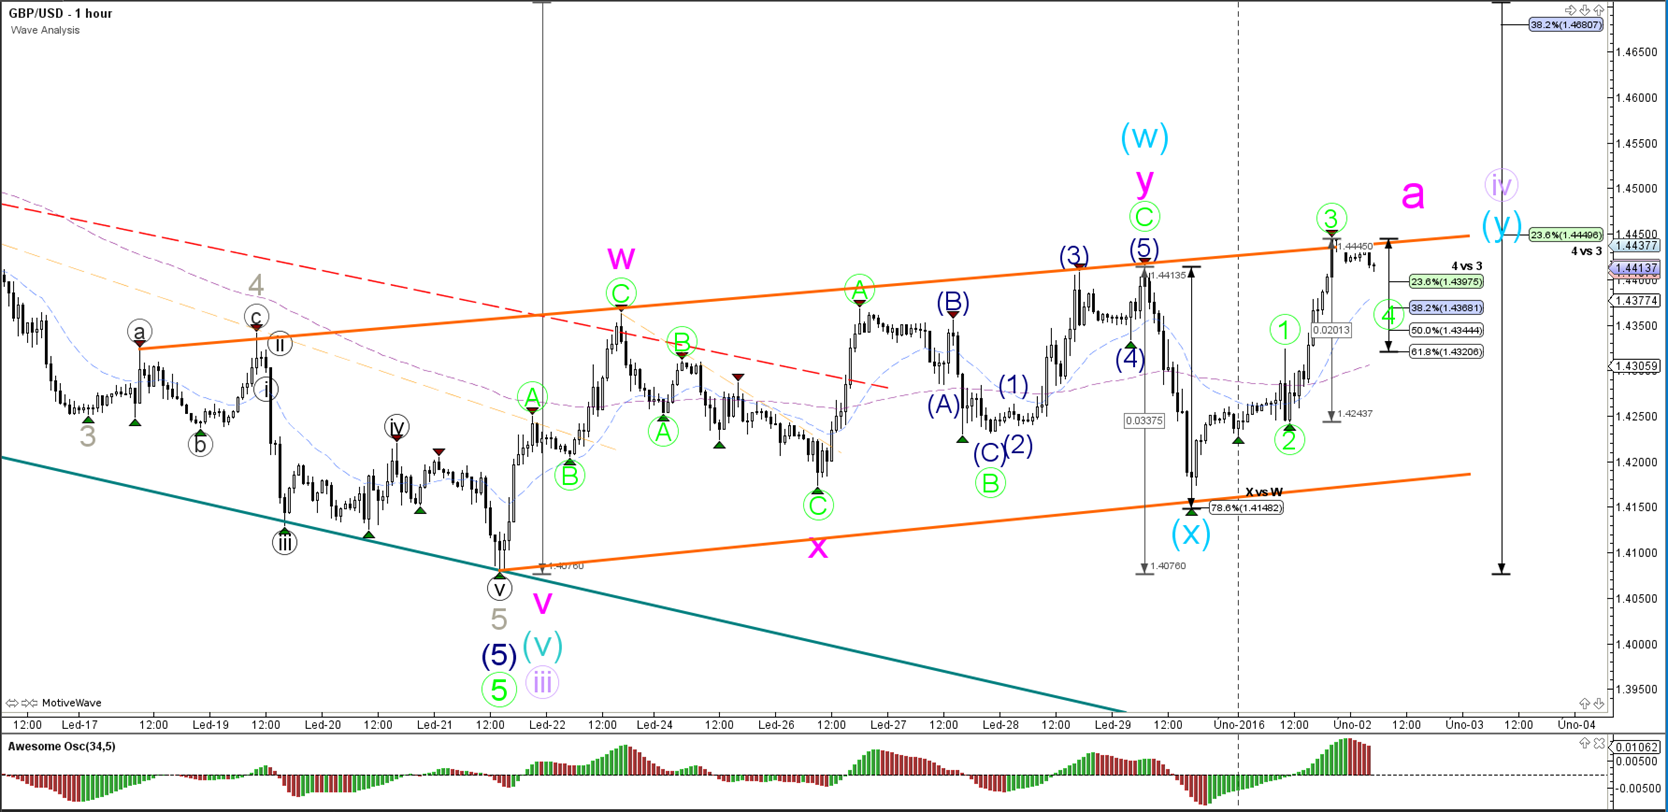
1 hour

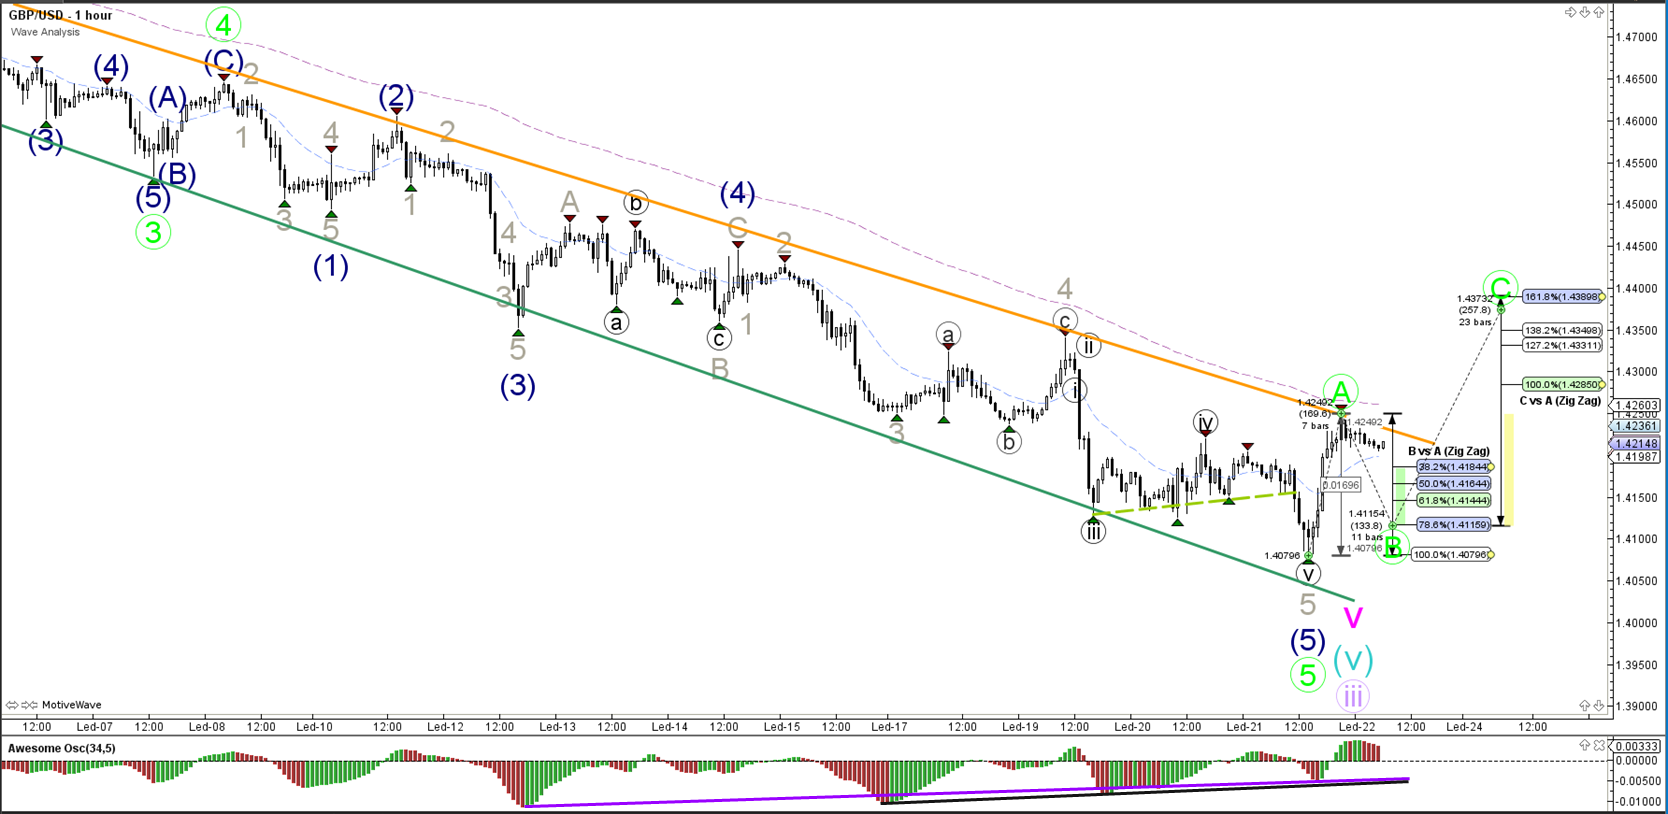
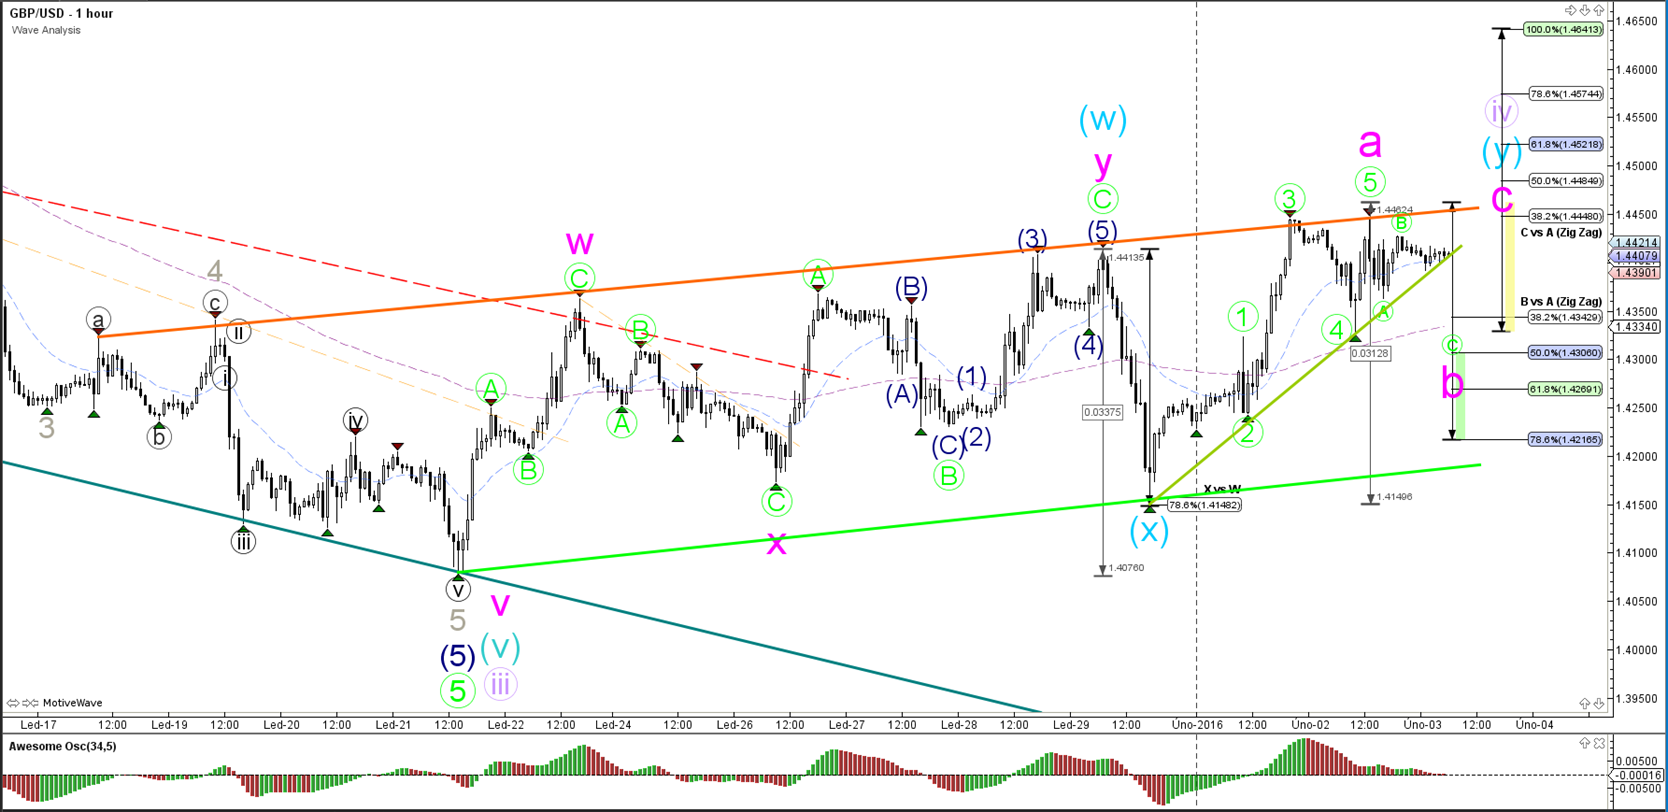
The Cable is building wave extensions within that wave 3 and yesterday made an impulsive bearish fall after hitting the 50% Fibonacci retracement level of wave 4 (grey). There could be another 5 wave extension taking place within the wave 5 (grey) if price respects the Fibonacci levels of the wave 4 (blue circle) and resistance trend line (orange).
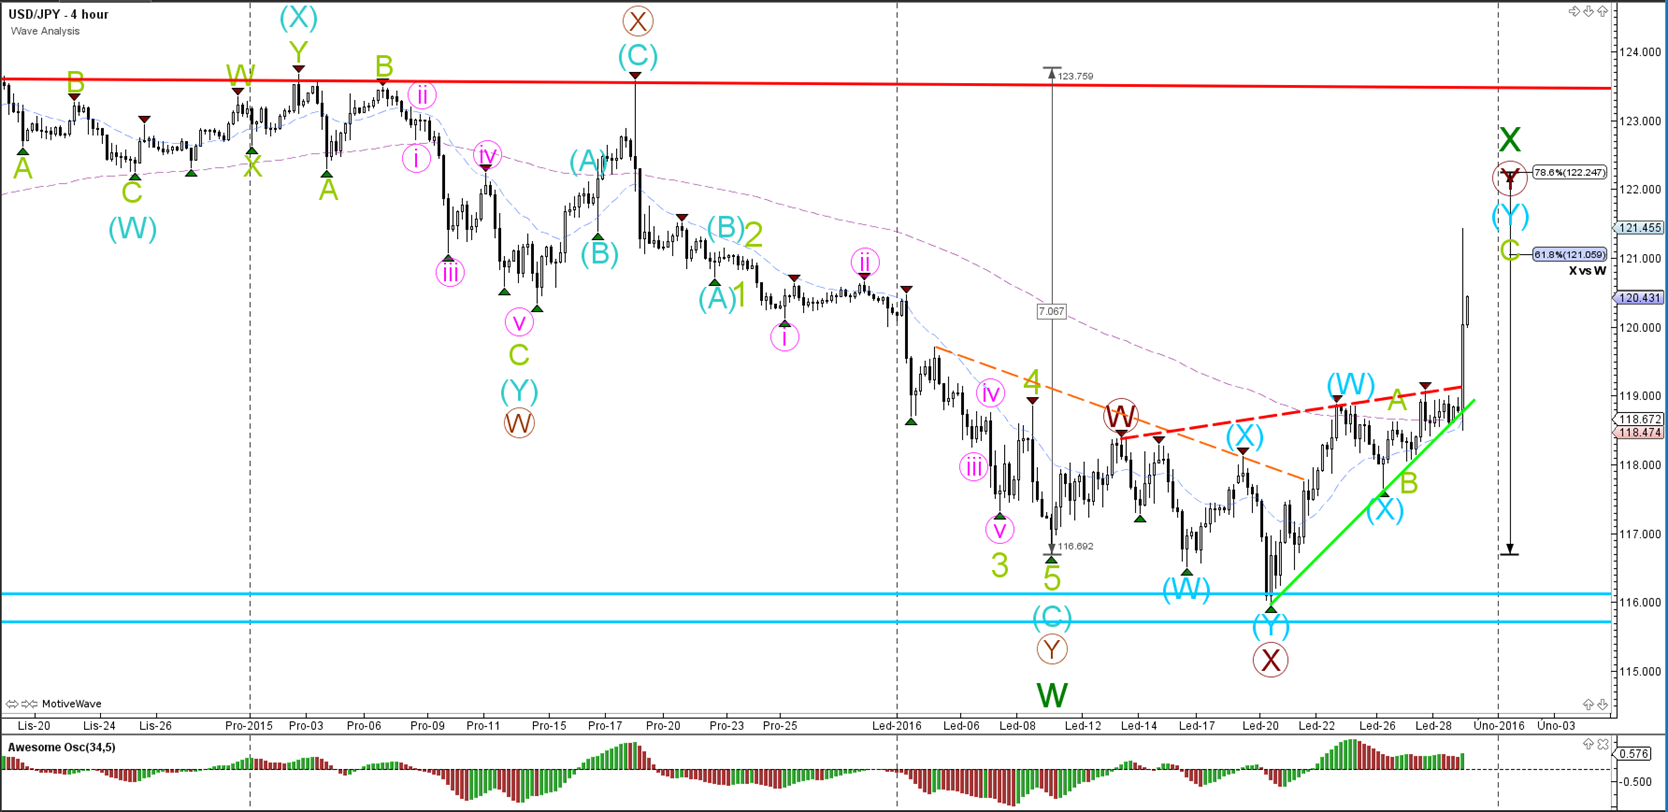
USD/JPY
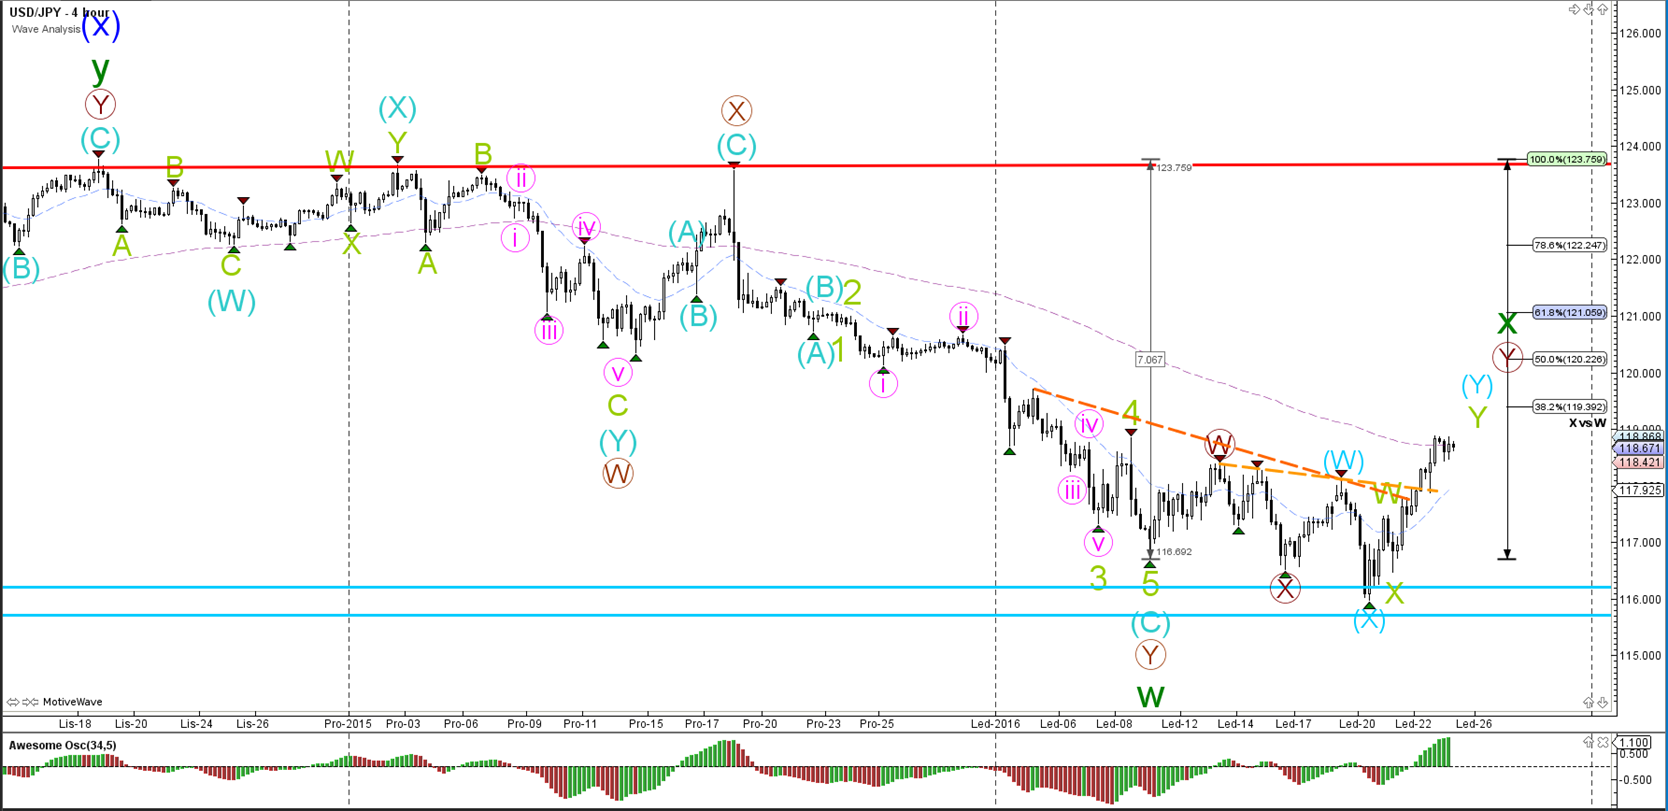
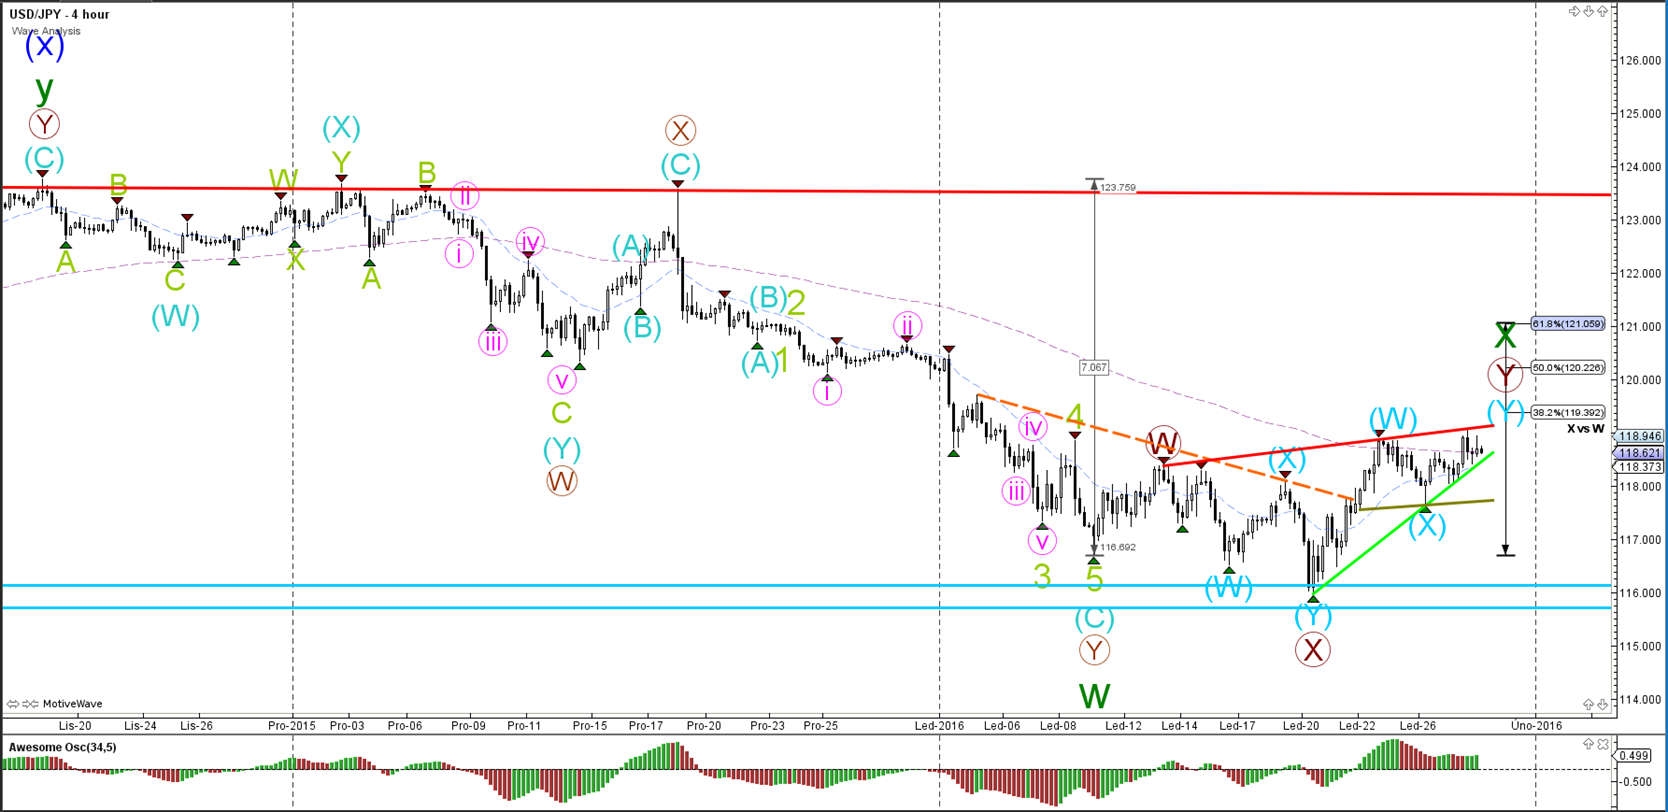
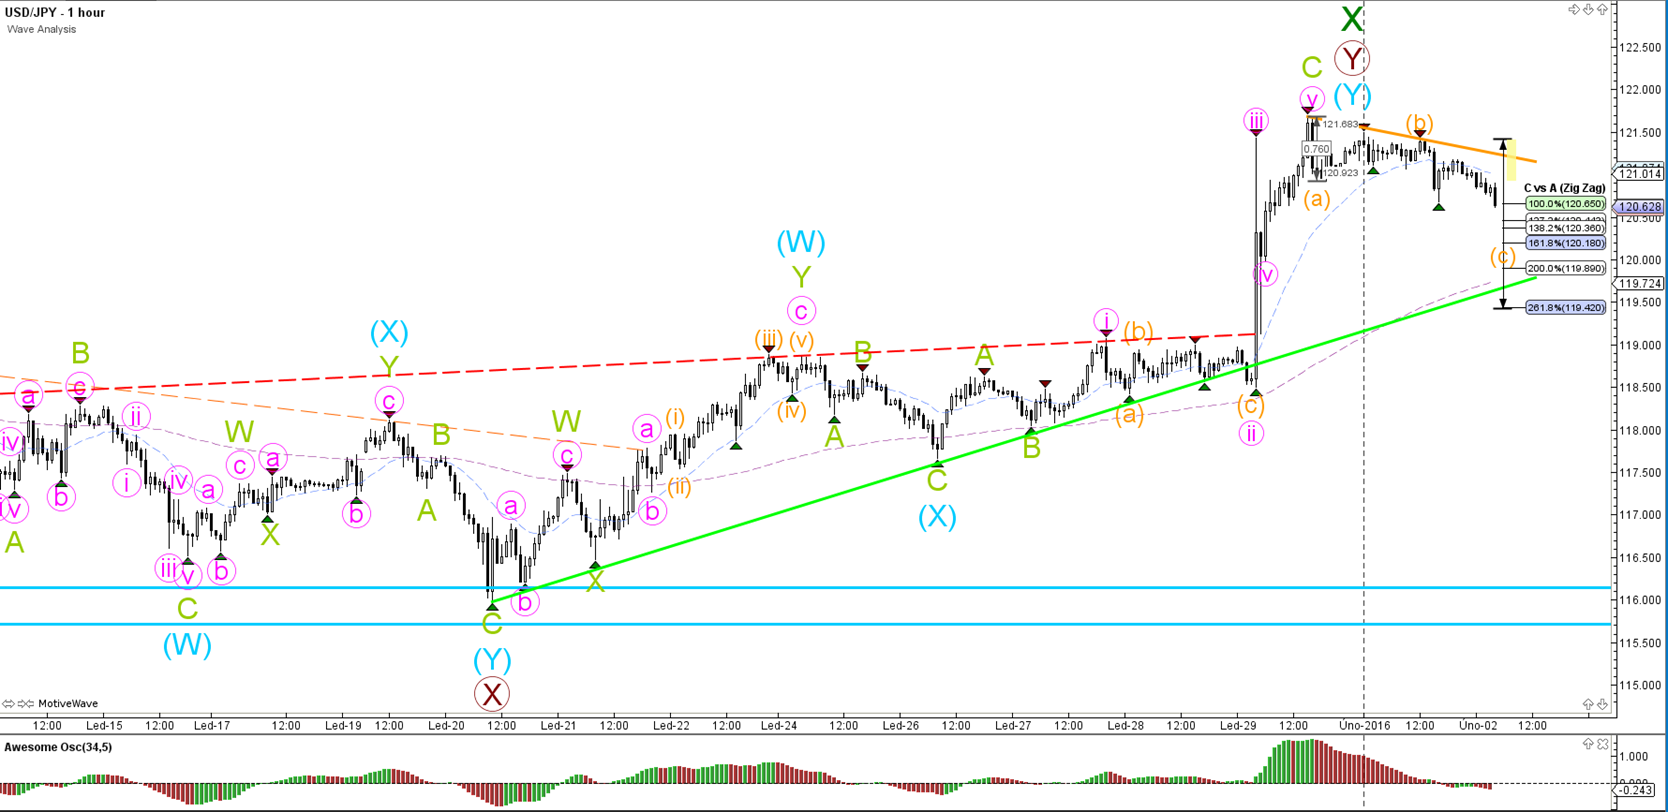
4 hour

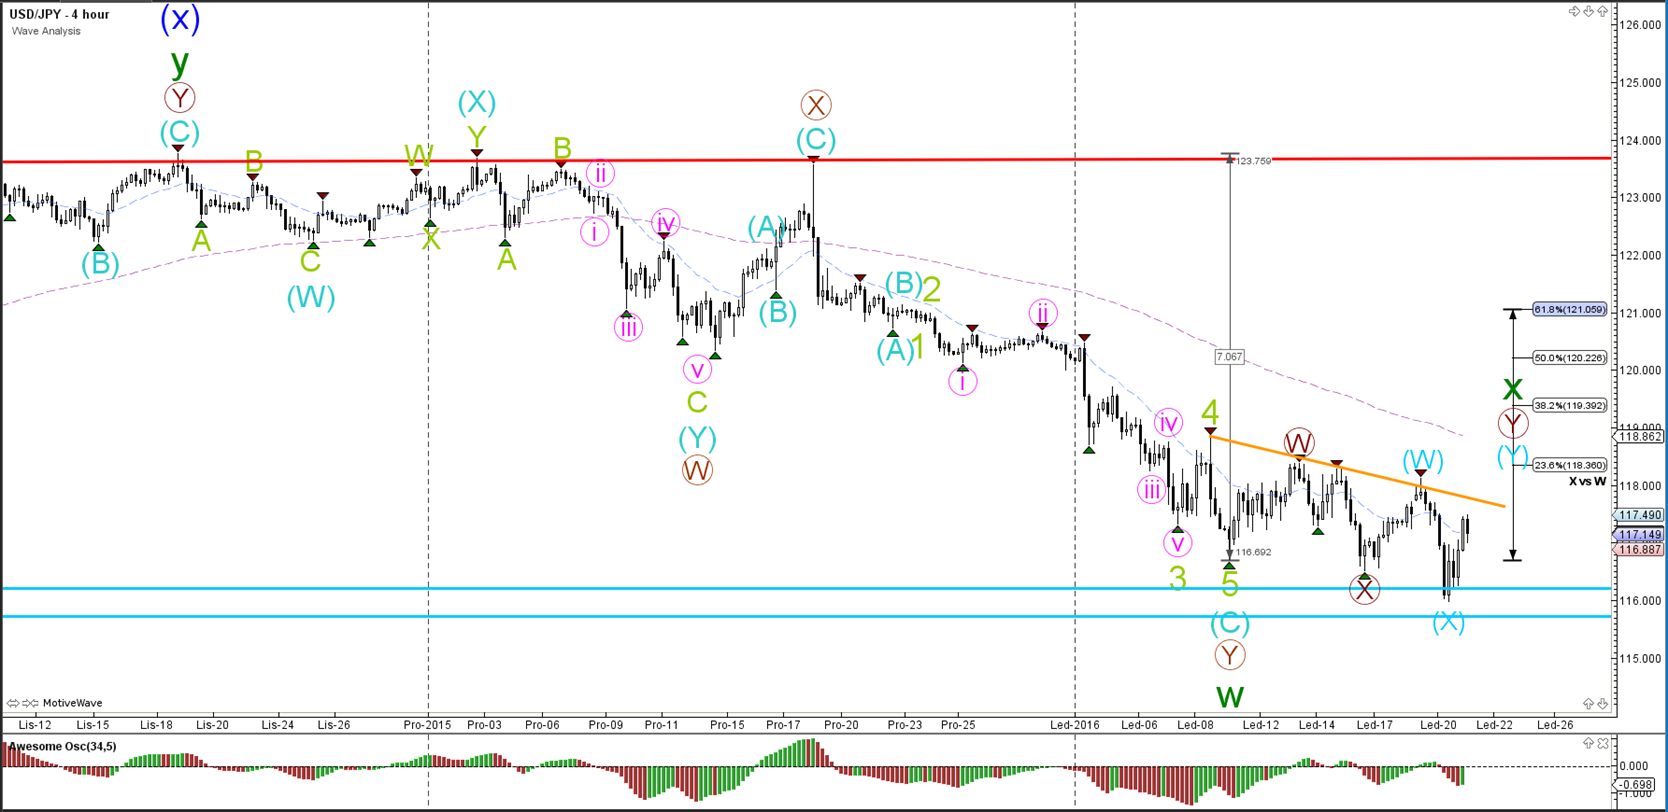
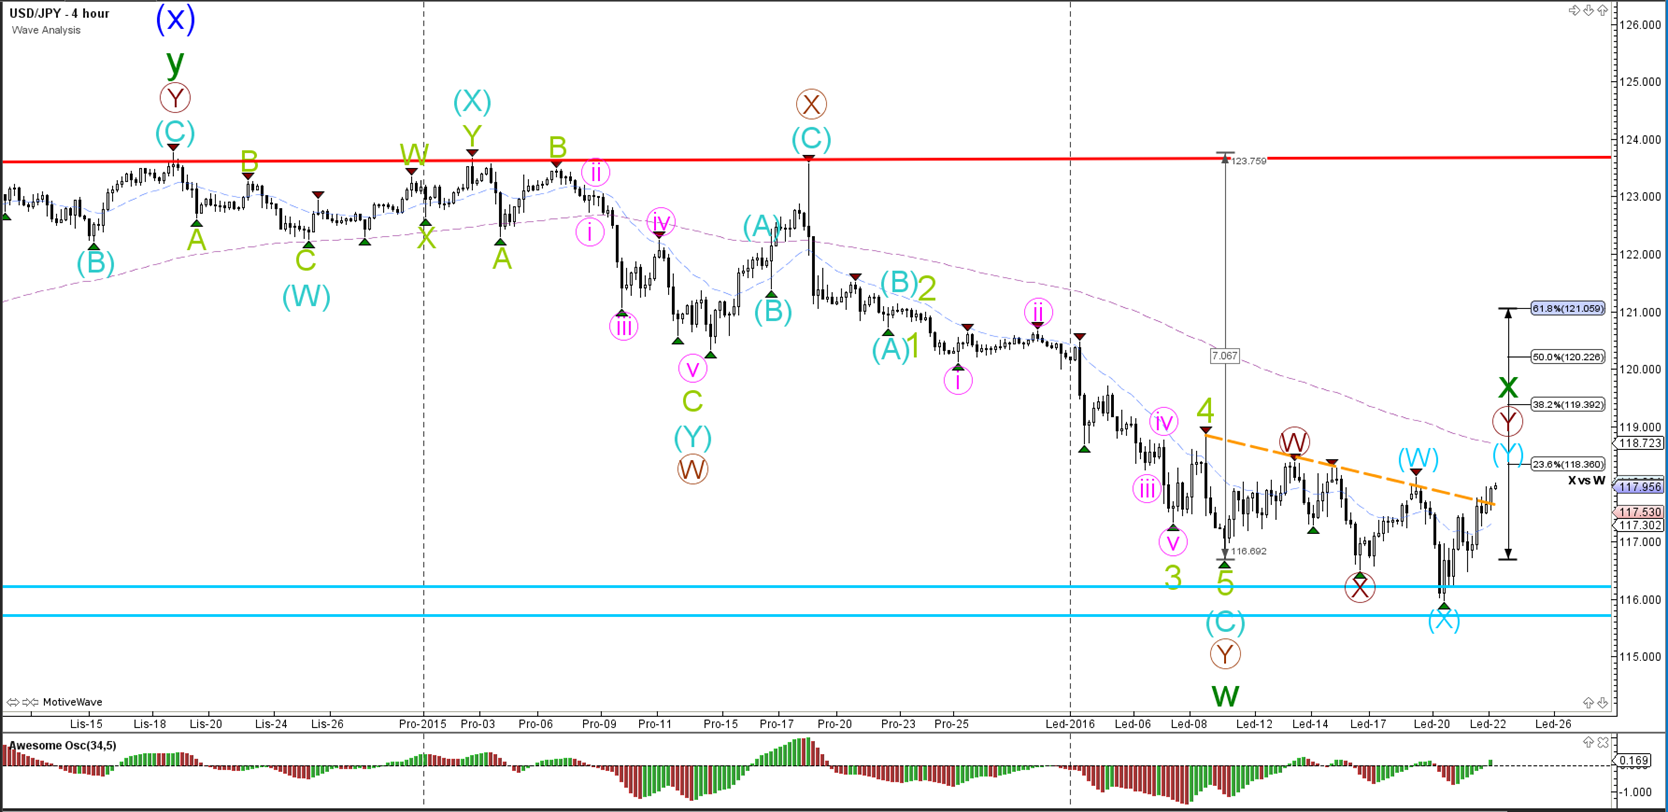
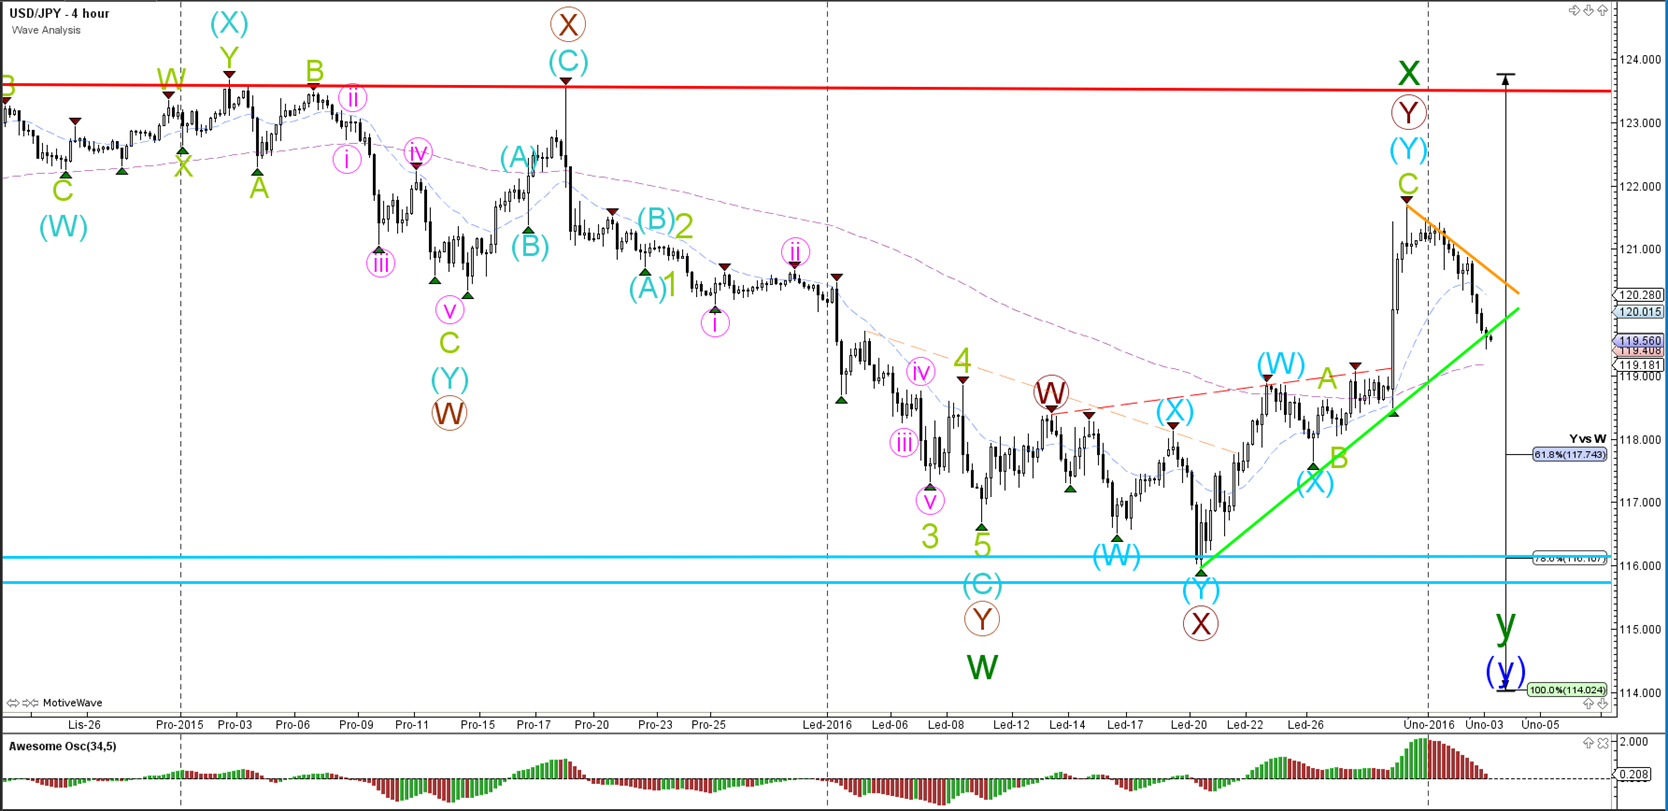
The USD/JPY showed a bearish bounce at the resistance trend line (orange) yesterday and price is falling back towards the horizontal support (green) and bigger weekly bottom (blue). A break below the support levels indicates the potential for a downtrend continuation.
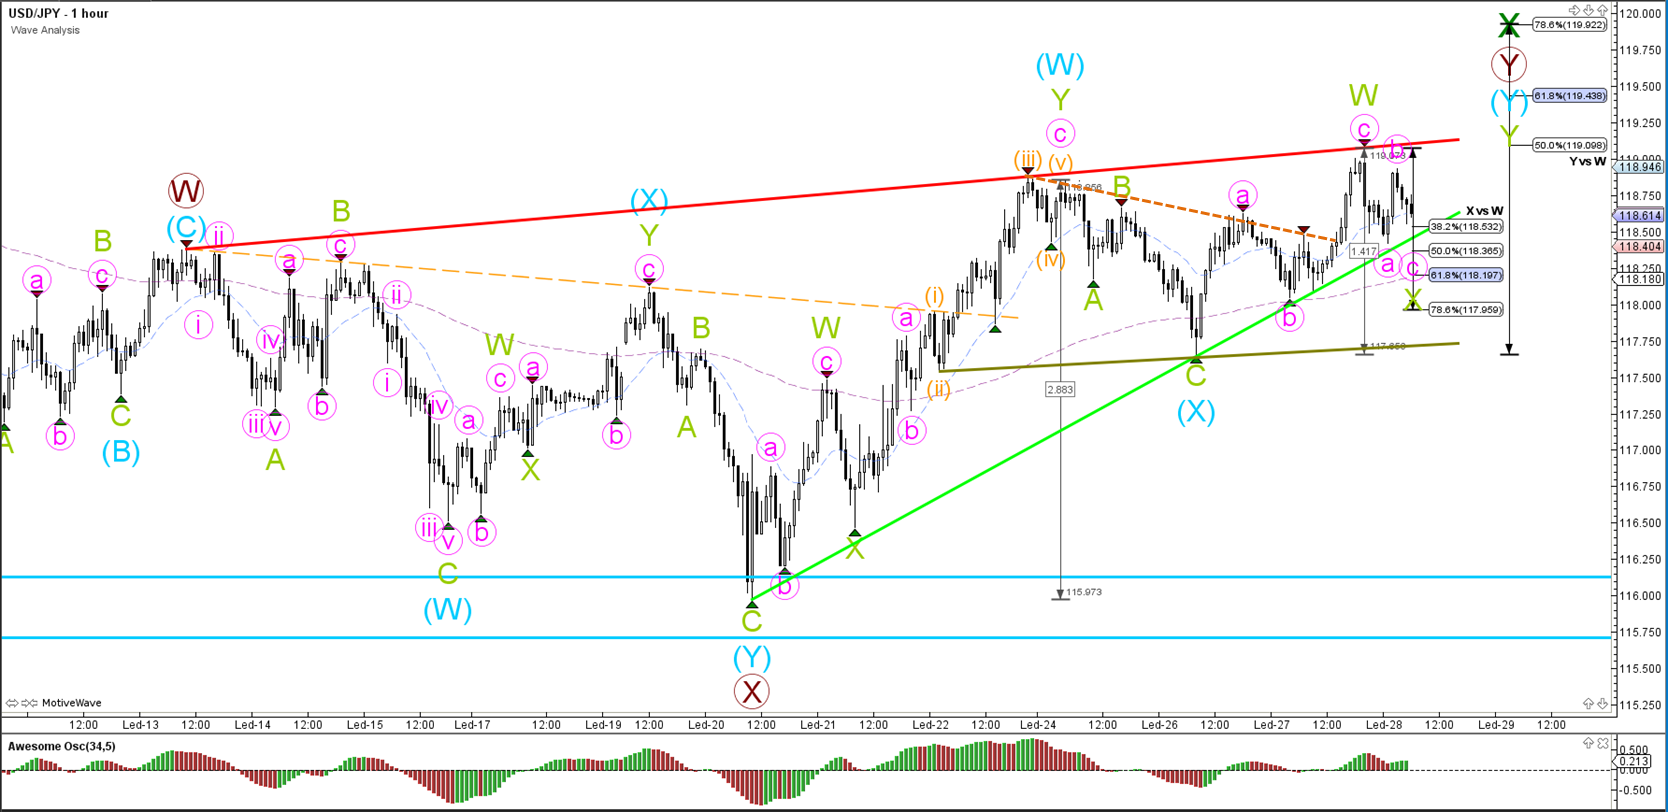
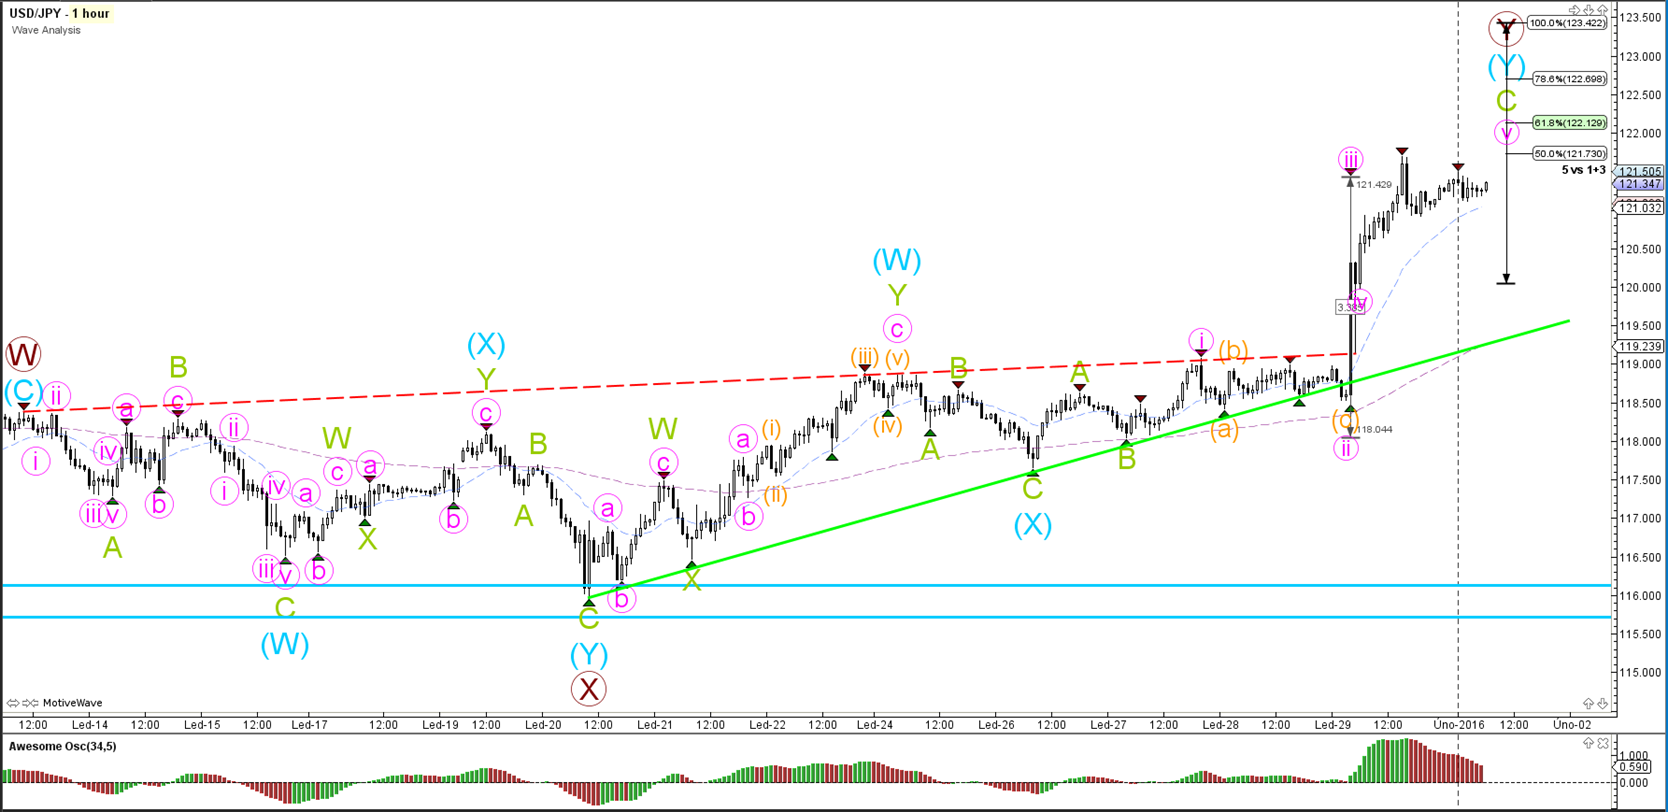
1 hour

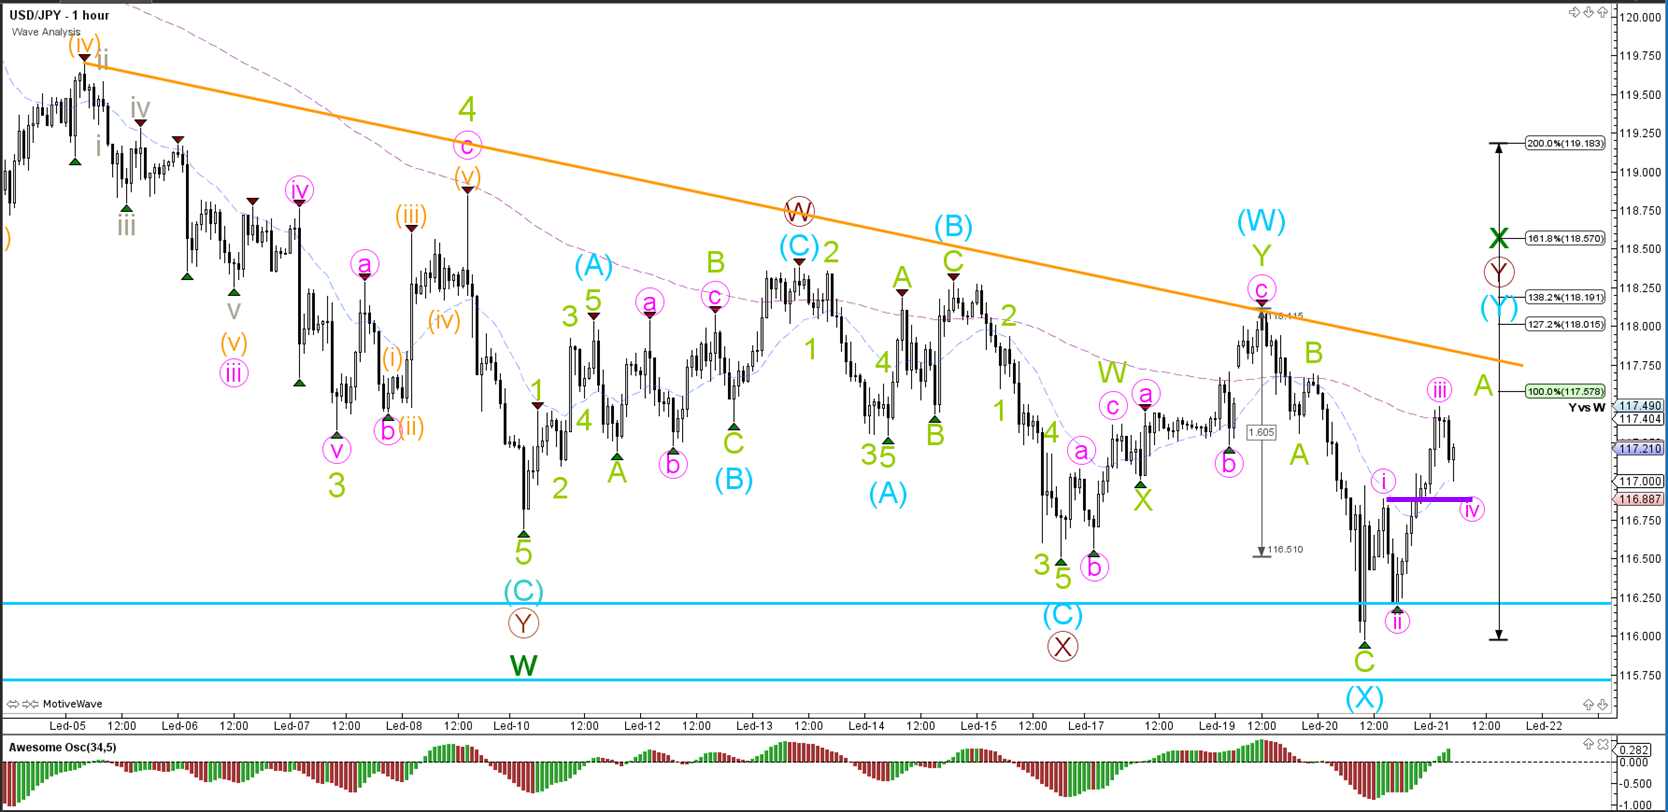
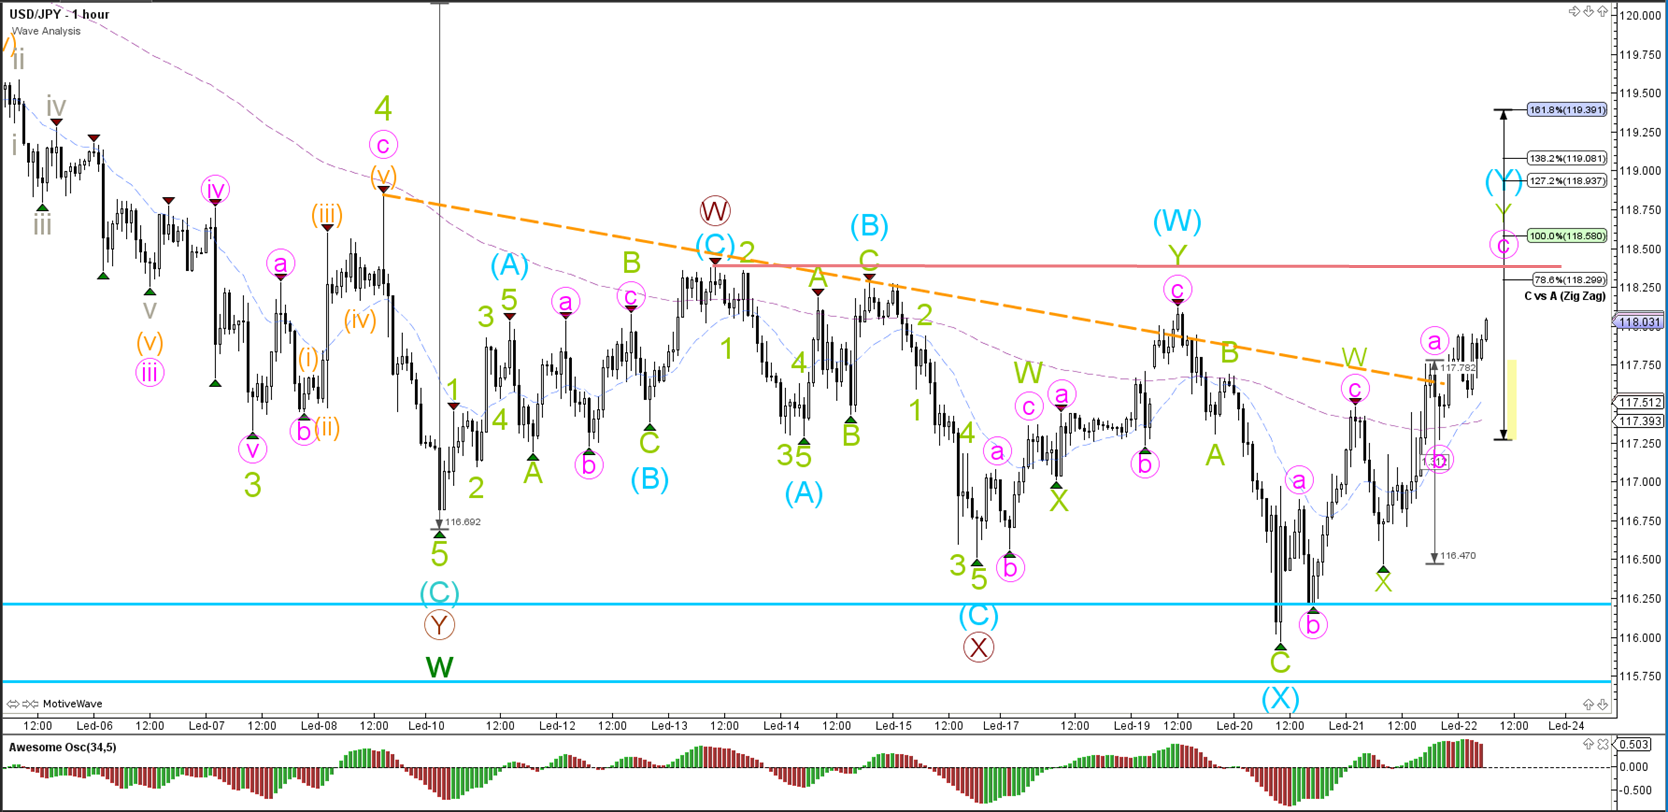
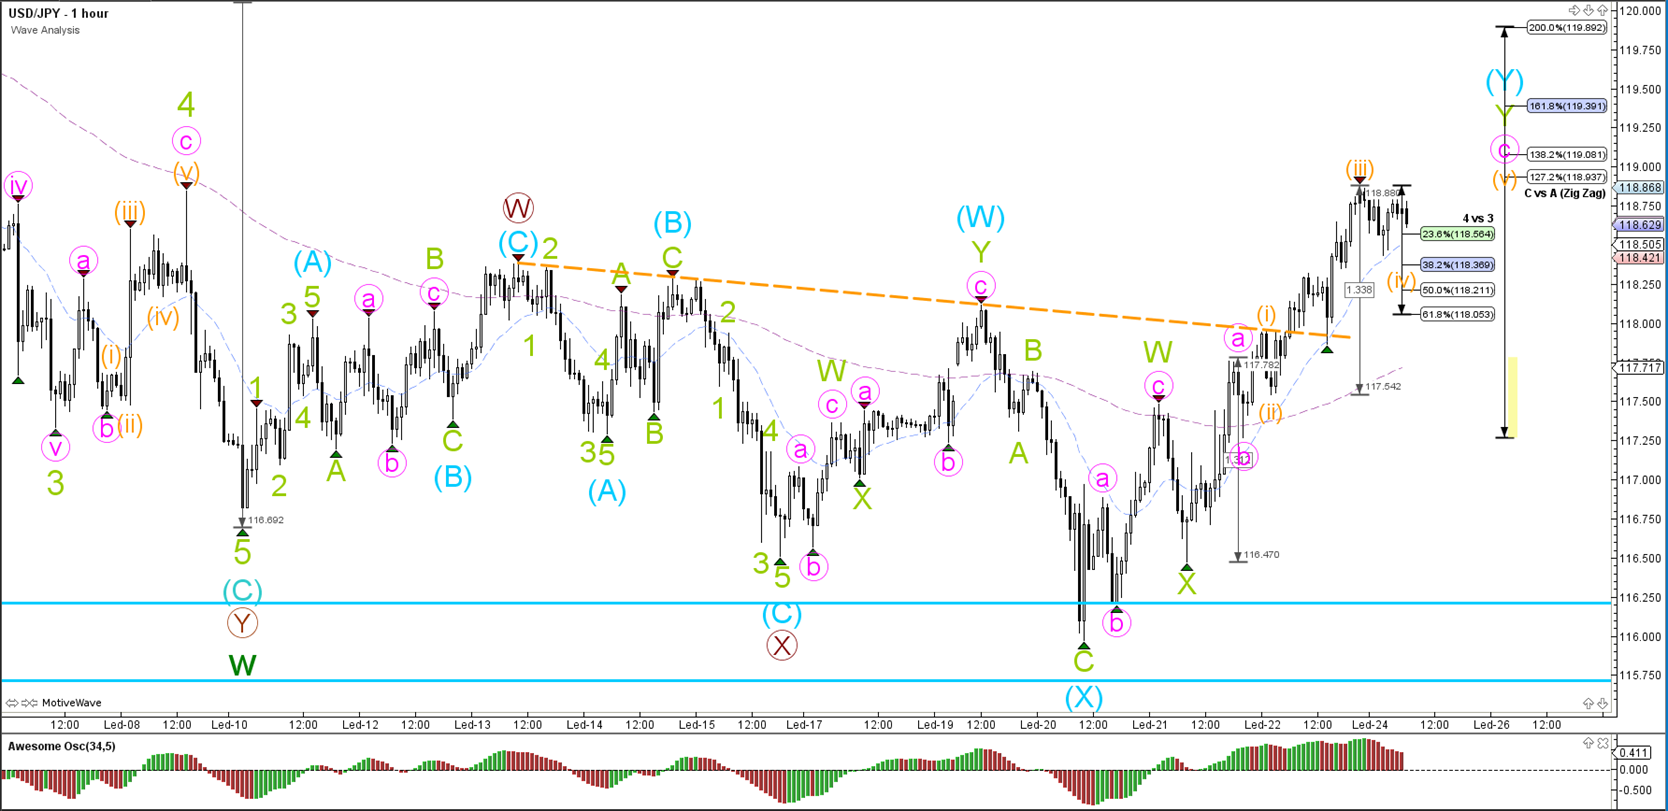
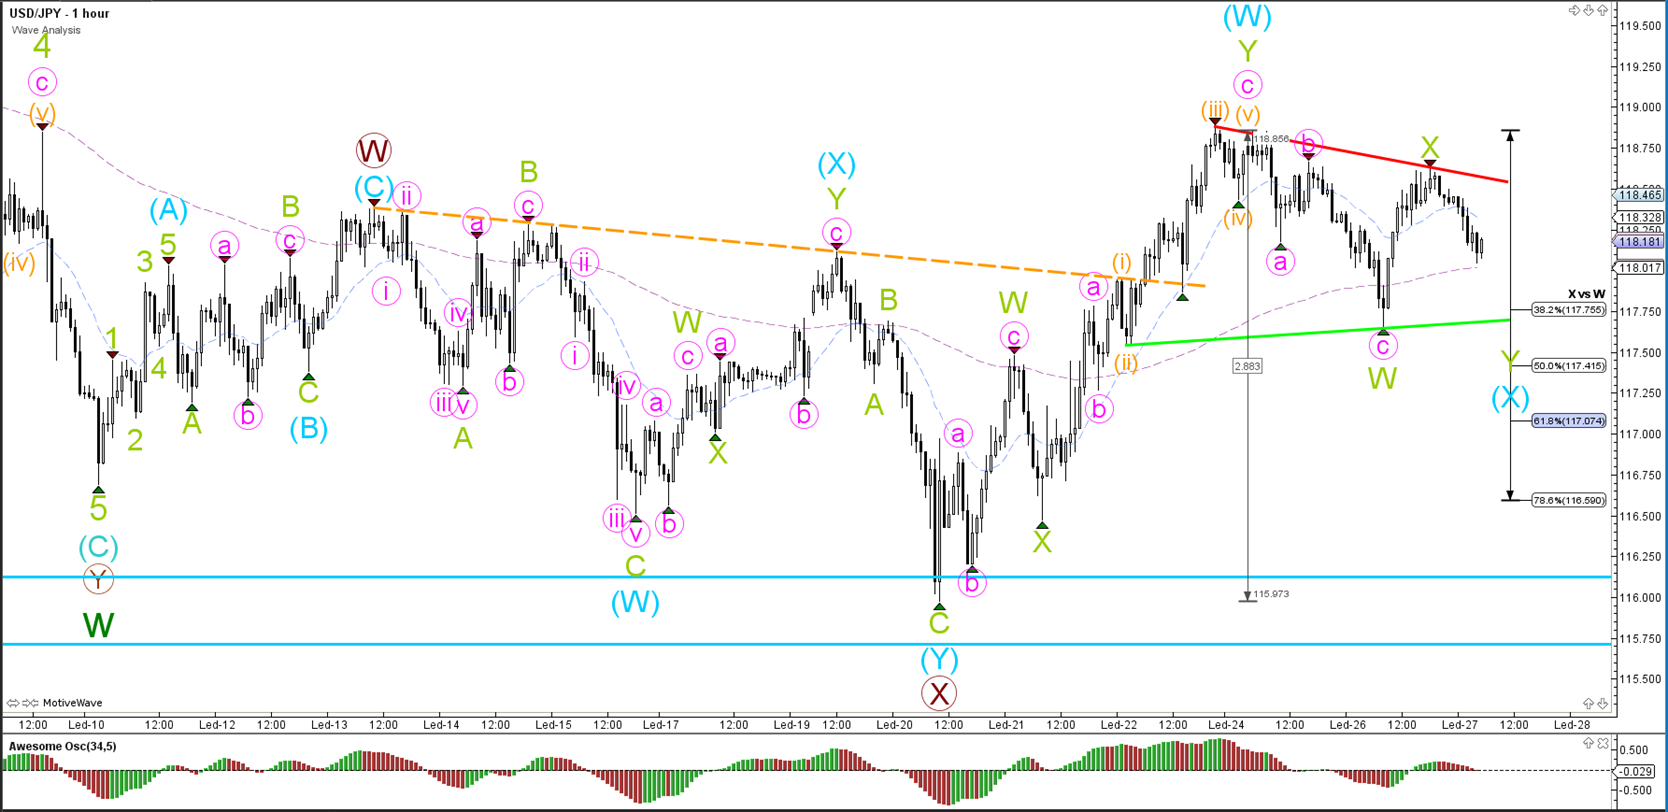
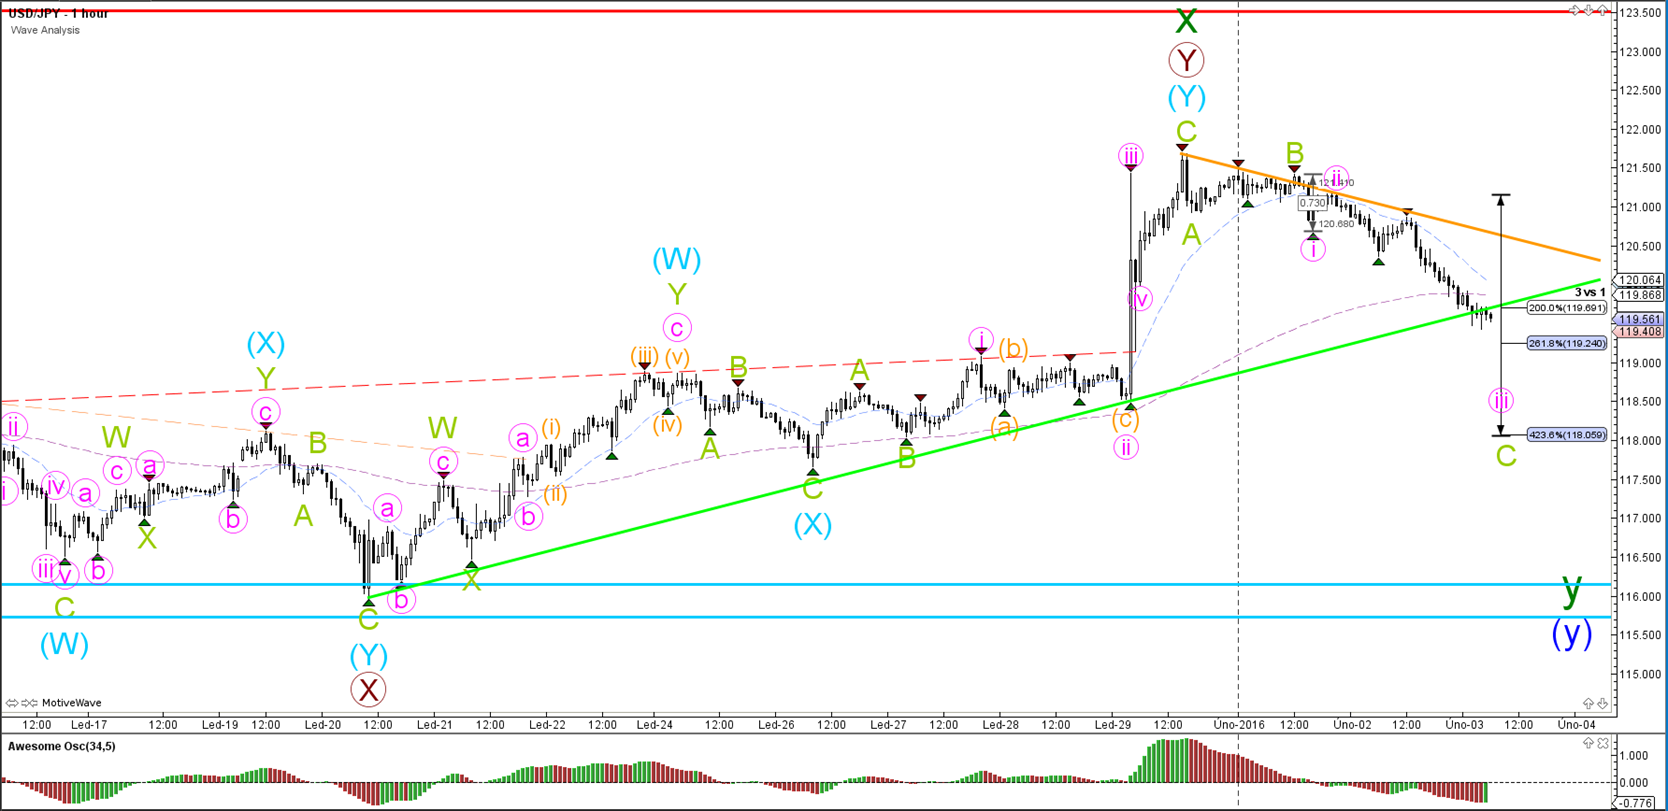
The USD/JPY seems to be building a bearish ABC zigzag (green) as part of wave X (blue). If price does show a bullish bounce at the Fibonacci levels, then price could expand wave Y (brown) of wave X (green).
“Original analysis is provided by Admiral Markets”
EUR/USD
4 hour

The EUR/USD bounced as part of the wave X (blue) support and indeed seems to be expanding the WXY correction. The trend line (orange) at 1.10 is an important resistance spot. A break above that could see price continue its bullish price action towards the 100% Fibonacci levels and thereafter perhaps to the higher Fib targets.
1 hour
The EUR/USD bounced at the confluence of 61.8% Fibonacci retracement and 100% Fibonacci target levels.
GBP/USD
4 hour

The GBP/USD keeps pushing the downtrend to new extremes and price is now approaching the 261.8% Fibonacci target at 1.3942 of wave 3 versus wave 1 (purple).
1 hour

The Cable is building wave extensions within that wave 3 and yesterday made an impulsive bearish fall after hitting the 50% Fibonacci retracement level of wave 4 (grey). There could be another 5 wave extension taking place within the wave 5 (grey) if price respects the Fibonacci levels of the wave 4 (blue circle) and resistance trend line (orange).
USD/JPY
4 hour

The USD/JPY showed a bearish bounce at the resistance trend line (orange) yesterday and price is falling back towards the horizontal support (green) and bigger weekly bottom (blue). A break below the support levels indicates the potential for a downtrend continuation.
1 hour

The USD/JPY seems to be building a bearish ABC zigzag (green) as part of wave X (blue). If price does show a bullish bounce at the Fibonacci levels, then price could expand wave Y (brown) of wave X (green).
“Original analysis is provided by Admiral Markets”